Finance PowerPoint Icons
-
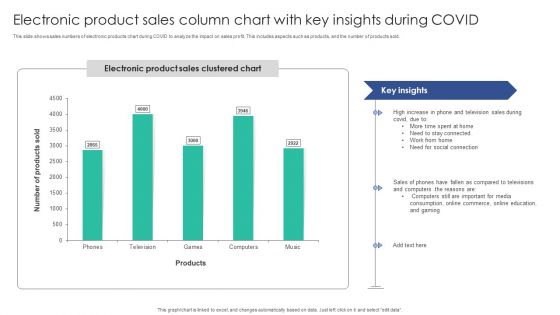
Electronic Product Sales Column Chart With Key Insights During COVID Microsoft PDF
This slide shows sales numbers of electronic products chart during COVID to analyze the impact on sales profit. This includes aspects such as products, and the number of products sold. Pitch your topic with ease and precision using this Electronic Product Sales Column Chart With Key Insights During COVID Microsoft PDF. This layout presents information on Stay Connected, Social Connection, Compared Televisions. It is also available for immediate download and adjustment. So, changes can be made in the color, design, graphics or any other component to create a unique layout.
-
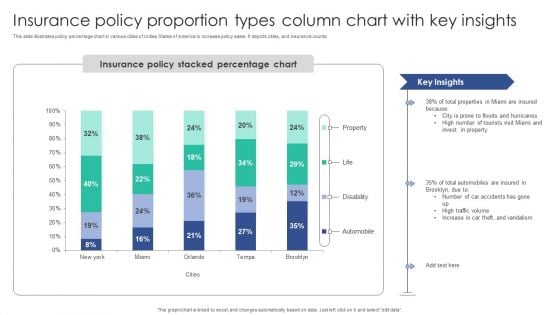
Insurance Policy Proportion Types Column Chart With Key Insights Ideas PDF
This slide illustrates policy percentage chart in various cities of Unites States of America to increase policy sales. It depicts cities, and insurance counts Showcasing this set of slides titled Insurance Policy Proportion Types Column Chart With Key Insights Ideas PDF. The topics addressed in these templates are Floods Hurricanes, Tourists Visit, Invest Property. All the content presented in this PPT design is completely editable. Download it and make adjustments in color, background, font etc. as per your unique business setting.
-
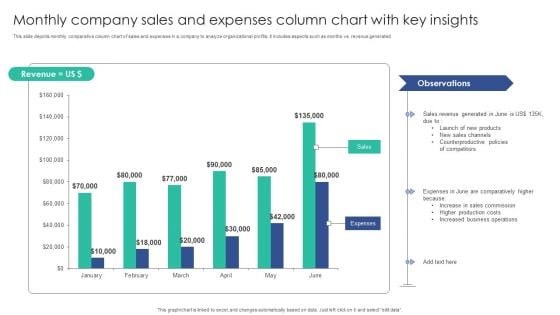
Monthly Company Sales And Expenses Column Chart With Key Insights Mockup PDF
This slide depicts monthly comparative column chart of sales and expenses in a company to analyze organizational profits. It includes aspects such as months vs. revenue generatedPitch your topic with ease and precision using this Monthly Company Sales And Expenses Column Chart With Key Insights Mockup PDF. This layout presents information on Sales Channels, Counterproductive Policies, Sales Commission. It is also available for immediate download and adjustment. So, changes can be made in the color, design, graphics or any other component to create a unique layout.
-
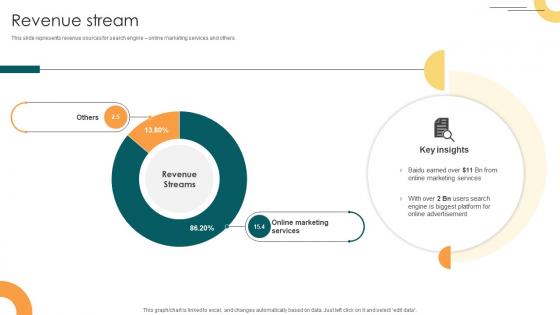
Revenue Stream Internet Company Investor Funding Elevator Pitch Deck
This slide represents revenue sources for search engine online marketing services and others. This modern and well-arranged Revenue Stream Internet Company Investor Funding Elevator Pitch Deck provides lots of creative possibilities. It is very simple to customize and edit with the Powerpoint Software. Just drag and drop your pictures into the shapes. All facets of this template can be edited with Powerpoint, no extra software is necessary. Add your own material, put your images in the places assigned for them, adjust the colors, and then you can show your slides to the world, with an animated slide included.
-
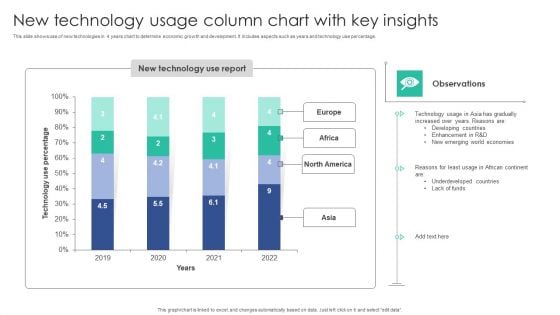
New Technology Usage Column Chart With Key Insights Brochure PDF
This slide shows use of new technologies in 4 years chart to determine economic growth and development. It Includes aspects such as years and technology use percentage.Pitch your topic with ease and precision using this New Technology Usage Column Chart With Key Insights Brochure PDF. This layout presents information on Technology Gradually, Increased Reasons, Developing Countries. It is also available for immediate download and adjustment. So, changes can be made in the color, design, graphics or any other component to create a unique layout.
-
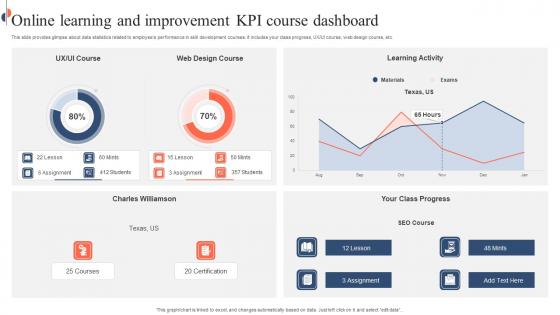
Online Learning And Improvement KPI Course Dashboard Mockup Pdf
This slide provides glimpse about data statistics related to employee performance in skill development courses. It includes your class progress, UX or UI course, web design course, etc. Showcasing this set of slides titled Online Learning And Improvement KPI Course Dashboard Mockup Pdf. The topics addressed in these templates are Online Learning, KPI Course Dashboard, Skill Development Courses. All the content presented in this PPT design is completely editable. Download it and make adjustments in color, background, font etc. as per your unique business setting.
-
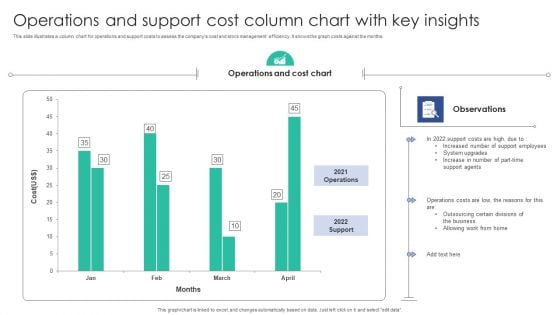
Operations And Support Cost Column Chart With Key Insights Background PDF
This slide illustrates a column chart for operations and support costs to assess the companys cost and stock management efficiency. It shows the graph costs against the months.Showcasing this set of slides titled Operations And Support Cost Column Chart With Key Insights Background PDF. The topics addressed in these templates are Operations Cost, Support Agents, Support Employees. All the content presented in this PPT design is completely editable. Download it and make adjustments in color, background, font etc. as per your unique business setting.
-
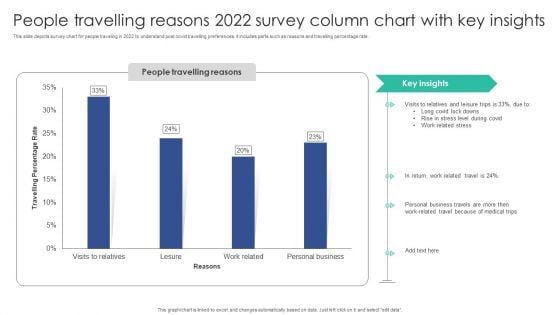
People Travelling Reasons 2022 Survey Column Chart With Key Insights Sample PDF
This slide depicts survey chart for people traveling in 2022 to understand post covid travelling preferences. It includes parts such as reasons and travelling percentage rate.Pitch your topic with ease and precision using this People Travelling Reasons 2022 Survey Column Chart With Key Insights Sample PDF. This layout presents information on Visits Relatives, Leisure Trips, Personal Business. It is also available for immediate download and adjustment. So, changes can be made in the color, design, graphics or any other component to create a unique layout.
-
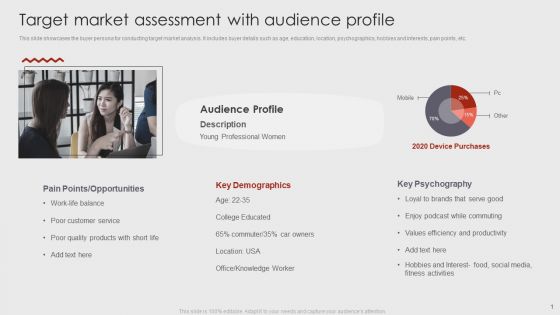
Target Market Assessment With Audience Profile Mockup PDF
This slide showcases the buyer persona for conducting target market analysis. It includes buyer details such as age, education, location, psychographics, hobbies and interests, pain points, etc. Showcasing this set of slides titled Target Market Assessment With Audience Profile Mockup PDF. The topics addressed in these templates are Opportunities, Key Demographics, Key Psychography. All the content presented in this PPT design is completely editable. Download it and make adjustments in color, background, font etc. as per your unique business setting.
-
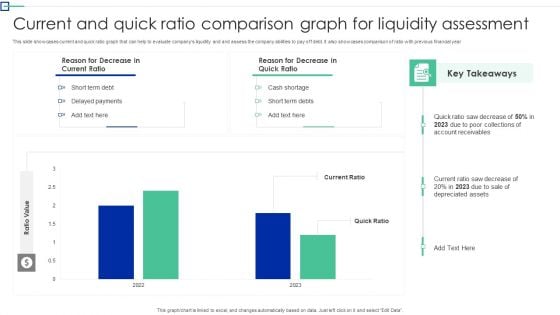
Current And Quick Ratio Comparison Graph For Liquidity Assessment Structure PDF
This slide showcases current and quick ratio graph that can help to evaluate companys liquidity and and assess the company abilities to pay off debt. It also showcases comparison of ratio with previous financial year. Showcasing this set of slides titled Current And Quick Ratio Comparison Graph For Liquidity Assessment Structure PDF. The topics addressed in these templates are Short Term Debt, Delayed Payments, Cash Shortage. All the content presented in this PPT design is completely editable. Download it and make adjustments in color, background, font etc. as per your unique business setting.
-
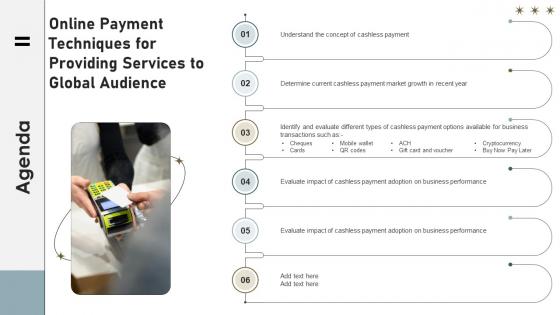
Agenda Online Payment Techniques For Providing Services To Global Audience
From laying roadmaps to briefing everything in detail, our templates are perfect for you. You can set the stage with your presentation slides. All you have to do is download these easy-to-edit and customizable templates. Agenda Online Payment Techniques For Providing Services To Global Audience will help you deliver an outstanding performance that everyone would remember and praise you for. Do download this presentation today.
-
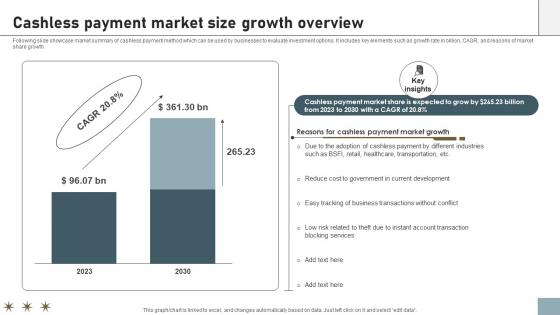
A109 Online Payment Techniques Cashless Payment Market Size Growth
Following slide showcase market summary of cashless payment method which can be used by businesses to evaluate investment options. It includes key elements such as growth rate in billion, CAGR, and reasons of market share growth. Boost your pitch with our creative A109 Online Payment Techniques Cashless Payment Market Size Growth. Deliver an awe-inspiring pitch that will mesmerize everyone. Using these presentation templates you will surely catch everyones attention. You can browse the ppts collection on our website. We have researchers who are experts at creating the right content for the templates. So you do not have to invest time in any additional work. Just grab the template now and use them.
-
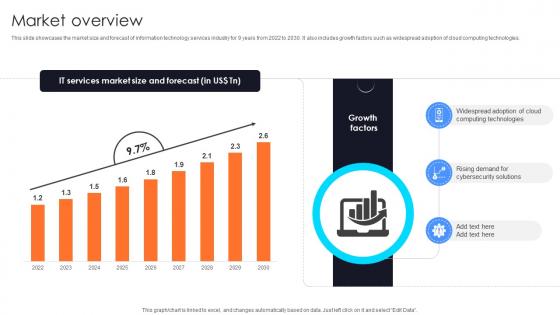
Market Overview Information Technology Startup Go To Market Strategy GTM SS V
This slide showcases the market size and forecast of information technology services industry for 9 years from 2022 to 2030. It also includes growth factors such as widespread adoption of cloud computing technologies. If you are looking for a format to display your unique thoughts, then the professionally designed Market Overview Information Technology Startup Go To Market Strategy GTM SS V is the one for you. You can use it as a Google Slides template or a PowerPoint template. Incorporate impressive visuals, symbols, images, and other charts. Modify or reorganize the text boxes as you desire. Experiment with shade schemes and font pairings. Alter, share or cooperate with other people on your work. Download Market Overview Information Technology Startup Go To Market Strategy GTM SS V and find out how to give a successful presentation. Present a perfect display to your team and make your presentation unforgettable.
-
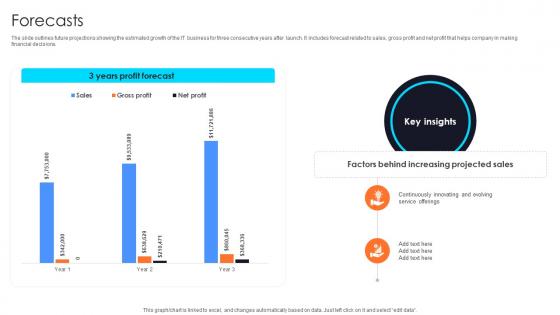
Forecasts Information Technology Startup Go To Market Strategy GTM SS V
The slide outlines future projections showing the estimated growth of the IT business for three consecutive years after launch. It includes forecast related to sales, gross profit and net profit that helps company in making financial decisions.Slidegeeks is here to make your presentations a breeze with Forecasts Information Technology Startup Go To Market Strategy GTM SS V With our easy-to-use and customizable templates, you can focus on delivering your ideas rather than worrying about formatting. With a variety of designs to choose from, you are sure to find one that suits your needs. And with animations and unique photos, illustrations, and fonts, you can make your presentation pop. So whether you are giving a sales pitch or presenting to the board, make sure to check out Slidegeeks first
-
Graph Icon For Quick And Current Liquidity Ratio Analysis Template PDF
Persuade your audience using this Graph Icon For Quick And Current Liquidity Ratio Analysis Template PDF. This PPT design covers Three stages, thus making it a great tool to use. It also caters to a variety of topics including Graph Icon, Quick And Current, Liquidity Ratio Analysis. Download this PPT design now to present a convincing pitch that not only emphasizes the topic but also showcases your presentation skills.
-
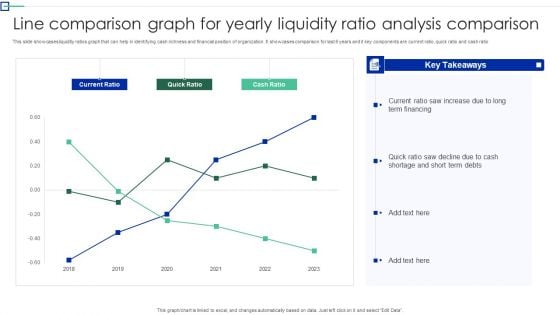
Line Comparison Graph For Yearly Liquidity Ratio Analysis Comparison Topics PDF
This slide showcases liquidity ratios graph that can help in identifying cash richness and financial position of organization. It showcases comparison for last 6 years and it key components are current ratio, quick ratio and cash ratio. Showcasing this set of slides titled Line Comparison Graph For Yearly Liquidity Ratio Analysis Comparison Topics PDF. The topics addressed in these templates are Term Financing, Cash Shortage, Cash Ratio. All the content presented in this PPT design is completely editable. Download it and make adjustments in color, background, font etc. as per your unique business setting.
-
Business Organizational Efficiency Optimization Strategy Icon Background PDF
Presenting Business Organizational Efficiency Optimization Strategy Icon Background PDF to dispense important information. This template comprises three stages. It also presents valuable insights into the topics including Business Organizational, Efficiency Optimization, Strategy Icon. This is a completely customizable PowerPoint theme that can be put to use immediately. So, download it and address the topic impactfully.
-
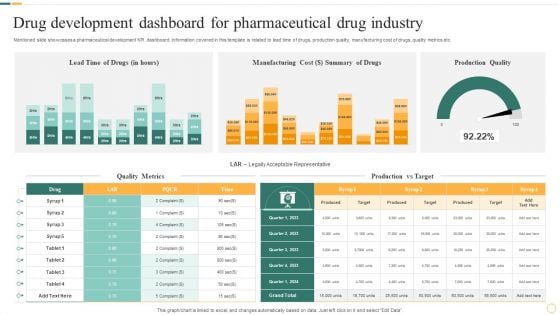
Drug Development Dashboard For Pharmaceutical Drug Industry Portrait PDF
Mentioned slide showcases a pharmaceutical development KPI dashboard. Information covered in this template is related to lead time of drugs, production quality, manufacturing cost of drugs, quality metrics etc. Showcasing this set of slides titled Drug Development Dashboard For Pharmaceutical Drug Industry Portrait PDF. The topics addressed in these templates are Manufacturing Cost, Summary Of Drugs, Production Quality. All the content presented in this PPT design is completely editable. Download it and make adjustments in color, background, font etc. as per your unique business setting.
-
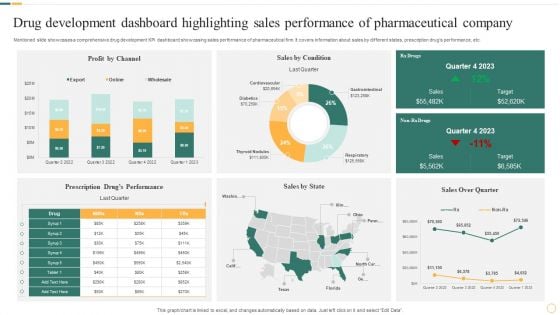
Drug Development Dashboard Highlighting Sales Performance Of Pharmaceutical Company Microsoft PDF
Mentioned slide showcases a comprehensive drug development KPI dashboard showcasing sales performance of pharmaceutical firm. It covers information about sales by different states, prescription drugs performance, etc. Pitch your topic with ease and precision using this Drug Development Dashboard Highlighting Sales Performance Of Pharmaceutical Company Microsoft PDF. This layout presents information on Sales By Condition, Profit By Channel, Sales By State. It is also available for immediate download and adjustment. So, changes can be made in the color, design, graphics or any other component to create a unique layout.
-
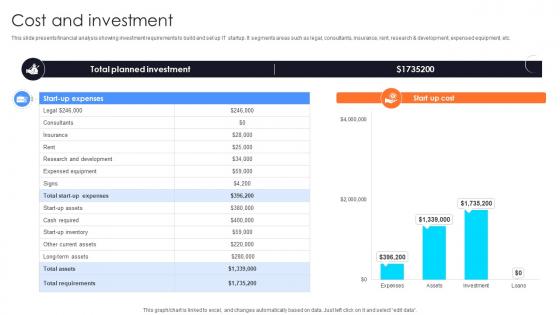
Cost And Investment Information Technology Startup Go To Market Strategy GTM SS V
This slide presents financial analysis showing investment requirements to build and set up IT startup. It segments areas such as legal, consultants, insurance, rent, research and development, expensed equipment, etc.Do you have to make sure that everyone on your team knows about any specific topic I yes, then you should give Cost And Investment Information Technology Startup Go To Market Strategy GTM SS V a try. Our experts have put a lot of knowledge and effort into creating this impeccable Cost And Investment Information Technology Startup Go To Market Strategy GTM SS V. You can use this template for your upcoming presentations, as the slides are perfect to represent even the tiniest detail. You can download these templates from the Slidegeeks website and these are easy to edit. So grab these today
-
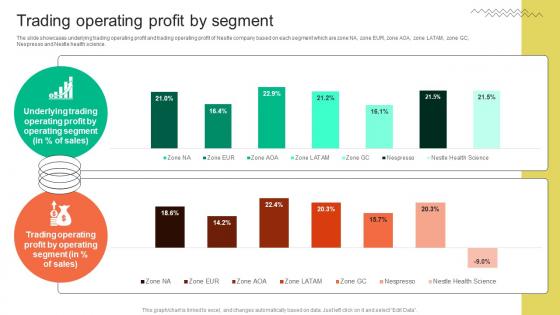
Trading Operating Profit By Segment FMCG Provider Company Profile CP SS V
The slide showcases underlying trading operating profit and trading operating profit of Nestle company based on each segment which are zone NA, zone EUR, zone AOA, zone LATAM, zone GC,Nespresso and Nestle health science.Create an editable Trading Operating Profit By Segment FMCG Provider Company Profile CP SS V that communicates your idea and engages your audience. Whether you are presenting a business or an educational presentation, pre-designed presentation templates help save time. Trading Operating Profit By Segment FMCG Provider Company Profile CP SS V is highly customizable and very easy to edit, covering many different styles from creative to business presentations. Slidegeeks has creative team members who have crafted amazing templates. So, go and get them without any delay.
-
Software Business Management Project Progress Ppt Show Icon PDF
This slide covers the project report on software with planning and building status . It also includes start and finish date , report date , overall status , scope , cost and effort. Pitch your topic with ease and precision using this Software Business Management Project Progress Ppt Show Icon PDF. This layout presents information on Overall Status Summary, Planning, Building. It is also available for immediate download and adjustment. So, changes can be made in the color, design, graphics or any other component to create a unique layout.
-
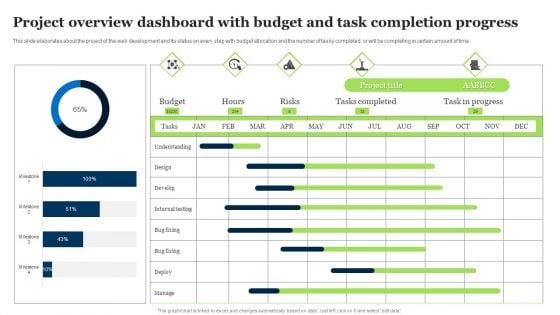
Project Overview Dashboard With Budget And Task Completion Progress Slides PDF
This slide elaborates about the project of the web development and its status on every step with budget allocation and the number of tasks completed or will be completing in certain amount of time. Showcasing this set of slides titled Project Overview Dashboard With Budget And Task Completion Progress Slides PDF. The topics addressed in these templates are Project Title, Budget, Risks. All the content presented in this PPT design is completely editable. Download it and make adjustments in color, background, font etc. as per your unique business setting.
-
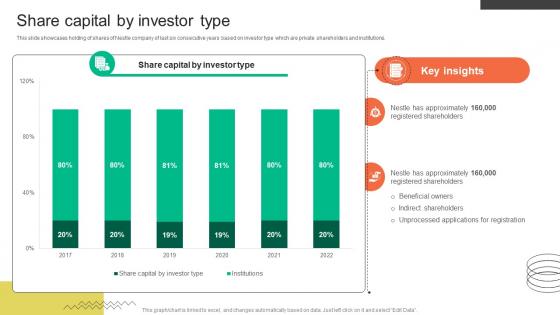
Share Capital By Investor Type FMCG Provider Company Profile CP SS V
This slide showcases holding of shares of Nestle company of last six consecutive years based on investor type which are private shareholders and institutions. Here you can discover an assortment of the finest PowerPoint and Google Slides templates. With these templates, you can create presentations for a variety of purposes while simultaneously providing your audience with an eye-catching visual experience. Download Share Capital By Investor Type FMCG Provider Company Profile CP SS V to deliver an impeccable presentation. These templates will make your job of preparing presentations much quicker, yet still, maintain a high level of quality. Slidegeeks has experienced researchers who prepare these templates and write high-quality content for you. Later on, you can personalize the content by editing the Share Capital By Investor Type FMCG Provider Company Profile CP SS V.
-
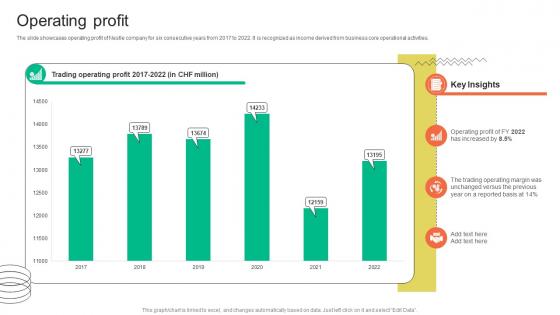
Operating Profit FMCG Provider Company Profile CP SS V
The slide showcases operating profit of Nestle company for six consecutive years from 2017 to 2022. It is recognized as income derived from business core operational activities. The best PPT templates are a great way to save time, energy, and resources. Slidegeeks have 100 percent editable powerpoint slides making them incredibly versatile. With these quality presentation templates, you can create a captivating and memorable presentation by combining visually appealing slides and effectively communicating your message. Download Operating Profit FMCG Provider Company Profile CP SS V from Slidegeeks and deliver a wonderful presentation.
-
Product Promotional Budget Plan Icon Background PDF
Persuade your audience using this Product Promotional Budget Plan Icon Background PDF. This PPT design covers three stages, thus making it a great tool to use. It also caters to a variety of topics including Product Promotional, Budget Plan Icon. Download this PPT design now to present a convincing pitch that not only emphasizes the topic but also showcases your presentation skills.
-
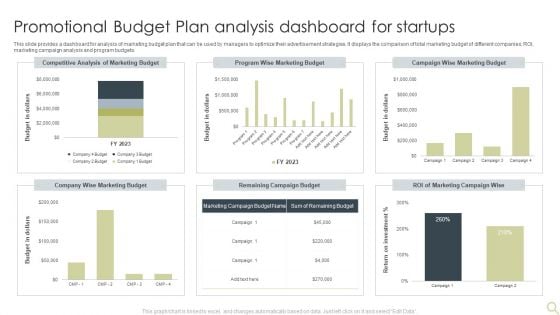
Promotional Budget Plan Analysis Dashboard For Startups Template PDF
This slide provides a dashboard for analysis of marketing budget plan that can be used by managers to optimize their advertisement strategies. It displays the comparison of total marketing budget of different companies, ROI, marketing campaign analysis and program budgets. Showcasing this set of slides titled Promotional Budget Plan Analysis Dashboard For Startups Template PDF. The topics addressed in these templates are Marketing Budget, Marketing Campaign, Competitive Analysis. All the content presented in this PPT design is completely editable. Download it and make adjustments in color, background, font etc. as per your unique business setting.
-
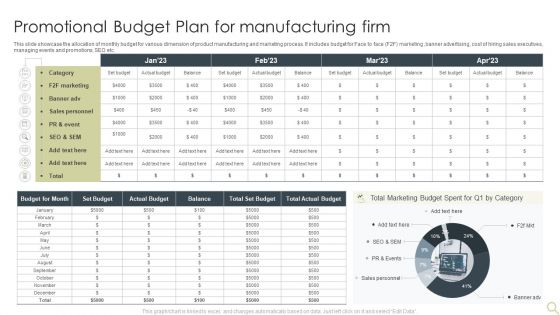
Promotional Budget Plan For Manufacturing Firm Information PDF
This slide showcase the allocation of monthly budget for various dimension of product manufacturing and marketing process. It includes budget for Face to face F2F marketing ,banner advertising, cost of hiring sales executives, managing events and promotions, SEO etc. Pitch your topic with ease and precision using this Promotional Budget Plan For Manufacturing Firm Information PDF. This layout presents information on Marketing, Budget, Sales Personnel. It is also available for immediate download and adjustment. So, changes can be made in the color, design, graphics or any other component to create a unique layout.
-
Social Media Promotional Budget Plan Icon Topics PDF
Presenting Social Media Promotional Budget Plan Icon Topics PDF to dispense important information. This template comprises three stages. It also presents valuable insights into the topics including Social Media Promotional, Budget Plan Icon. This is a completely customizable PowerPoint theme that can be put to use immediately. So, download it and address the topic impactfully.
-
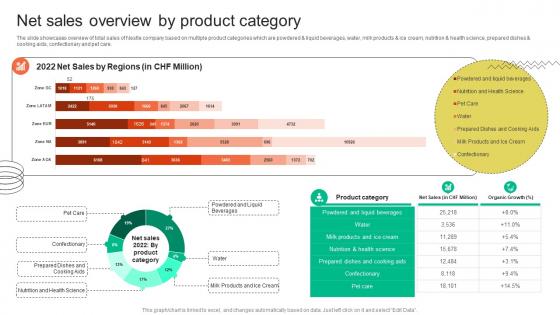
Net Sales Overview By Product Category FMCG Provider Company Profile CP SS V
The slide showcases overview of total sales of Nestle company based on multiple product categories which are powdered and liquid beverages, water, milk products and ice cream, nutrition and health science, prepared dishes and cooking aids, confectionary and pet care.Explore a selection of the finest Net Sales Overview By Product Category FMCG Provider Company Profile CP SS V here. With a plethora of professionally designed and pre-made slide templates, you can quickly and easily find the right one for your upcoming presentation. You can use our Net Sales Overview By Product Category FMCG Provider Company Profile CP SS V to effectively convey your message to a wider audience. Slidegeeks has done a lot of research before preparing these presentation templates. The content can be personalized and the slides are highly editable. Grab templates today from Slidegeeks.
-
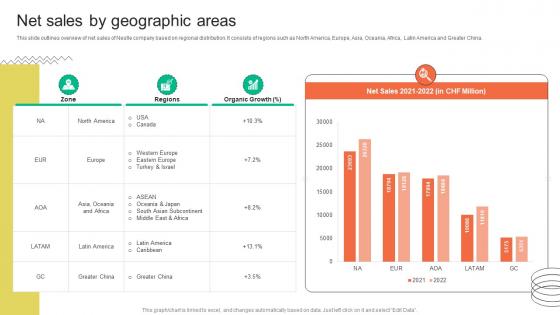
Net Sales By Geographic Areas FMCG Provider Company Profile CP SS V
This slide outlines overview of net sales of Nestle company based on regional distribution. It consists of regions such as North America, Europe, Asia, Oceania, Africa, Latin America and Greater China. Welcome to our selection of the Net Sales By Geographic Areas FMCG Provider Company Profile CP SS V. These are designed to help you showcase your creativity and bring your sphere to life. Planning and Innovation are essential for any business that is just starting out. This collection contains the designs that you need for your everyday presentations. All of our PowerPoints are 100 percent editable, so you can customize them to suit your needs. This multi-purpose template can be used in various situations. Grab these presentation templates today.
-
Icon For Digital Media Strategy Review Rectification Plan Designs PDF
Persuade your audience using this Icon For Digital Media Strategy Review Rectification Plan Designs PDF. This PPT design covers four stages, thus making it a great tool to use. It also caters to a variety of topics including Icon Digital, Media Strategy, Review Rectification. Download this PPT design now to present a convincing pitch that not only emphasizes the topic but also showcases your presentation skills.
-
Scrum Task Project Management And Tracking Dashboard Elements PDF
The following slide showcases tracking dashboard for scrum project management. It includes information about weekly tracking, overall completion, start and end date, remaining days, sprints, status productivity, engaged users, etc. Showcasing this set of slides titled Scrum Task Project Management And Tracking Dashboard Elements PDF. The topics addressed in these templates are Tracking Dashboard, Scrum Task Project Management. All the content presented in this PPT design is completely editable. Download it and make adjustments in color, background, font etc. as per your unique business setting.
-
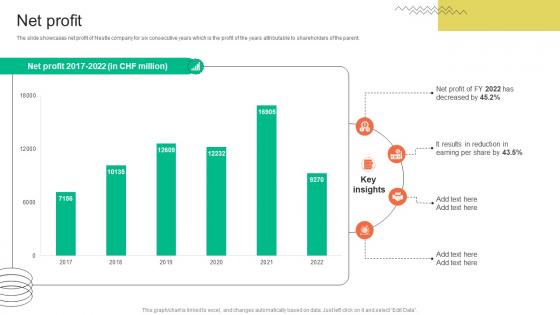
Net Profit FMCG Provider Company Profile CP SS V
The slide showcases net profit of Nestle company for six consecutive years which is the profit of the years attributable to shareholders of the parent. This Net Profit FMCG Provider Company Profile CP SS V is perfect for any presentation, be it in front of clients or colleagues. It is a versatile and stylish solution for organizing your meetings. The Net Profit FMCG Provider Company Profile CP SS V features a modern design for your presentation meetings. The adjustable and customizable slides provide unlimited possibilities for acing up your presentation. Slidegeeks has done all the homework before launching the product for you. So, do not wait, grab the presentation templates today
-
Company Product Selling Forecasts Icon Icons PDF
Persuade your audience using this Company Product Selling Forecasts Icon Icons PDF. This PPT design covers three stages, thus making it a great tool to use. It also caters to a variety of topics including Company Product, Selling Forecasts Icon. Download this PPT design now to present a convincing pitch that not only emphasizes the topic but also showcases your presentation skills.
-
Selling Forecasts Revenue Report Icon Graphics PDF
Persuade your audience using this Selling Forecasts Revenue Report Icon Graphics PDF. This PPT design covers three stages, thus making it a great tool to use. It also caters to a variety of topics including Selling Forecasts, Revenue Report Icon. Download this PPT design now to present a convincing pitch that not only emphasizes the topic but also showcases your presentation skills.
-
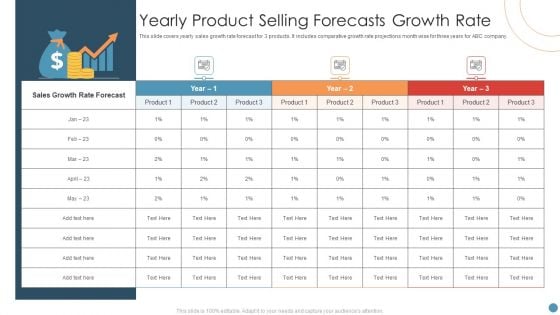
Yearly Product Selling Forecasts Growth Rate Diagrams PDF
This slide covers yearly sales growth rate forecast for 3 products. It includes comparative growth rate projections month wise for three years for ABC company. Presenting Yearly Product Selling Forecasts Growth Rate Diagrams PDF to dispense important information. This template comprises three stages. It also presents valuable insights into the topics including Product Selling Forecasts, Growth Rate. This is a completely customizable PowerPoint theme that can be put to use immediately. So, download it and address the topic impactfully.
-
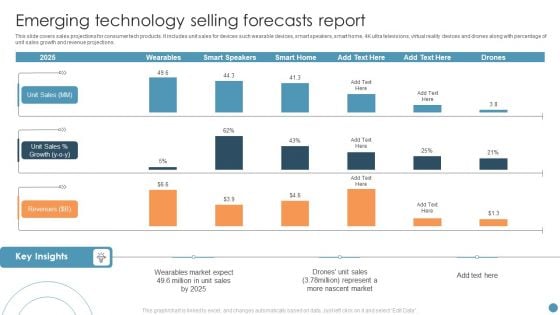
Emerging Technology Selling Forecasts Report Clipart PDF
This slide covers sales projections for consumer tech products. It includes unit sales for devices such wearable devices, smart speakers, smart home, 4K ultra televisions, virtual reality devices and drones along with percentage of unit sales growth and revenue projections. Showcasing this set of slides titled Emerging Technology Selling Forecasts Report Clipart PDF. The topics addressed in these templates are Emerging Technology Selling Forecasts, Market. All the content presented in this PPT design is completely editable. Download it and make adjustments in color, background, font etc. as per your unique business setting.
-
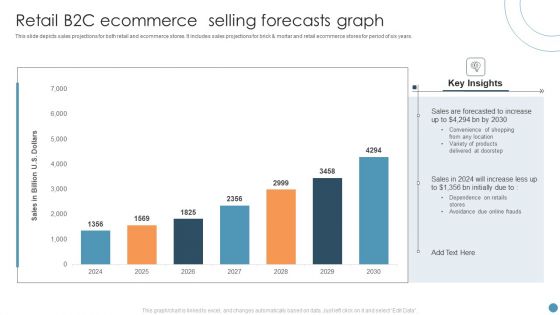
Retail B2C Ecommerce Selling Forecasts Graph Portrait PDF
This slide depicts sales projections for both retail and ecommerce stores. It includes sales projections for brick and mortar and retail ecommerce stores for period of six years. Pitch your topic with ease and precision using this Retail B2C Ecommerce Selling Forecasts Graph Portrait PDF. This layout presents information on Retail B2C Ecommerce, Selling Forecasts Graph. It is also available for immediate download and adjustment. So, changes can be made in the color, design, graphics or any other component to create a unique layout.
-
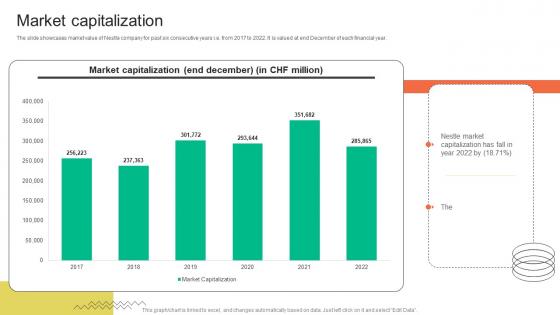
Market Capitalization FMCG Provider Company Profile CP SS V
The slide showcases market value of Nestle company for past six consecutive years i.e. from 2017 to 2022. It is valued at end December of each financial year. Make sure to capture your audiences attention in your business displays with our gratis customizable Market Capitalization FMCG Provider Company Profile CP SS V. These are great for business strategies, office conferences, capital raising or task suggestions. If you desire to acquire more customers for your tech business and ensure they stay satisfied, create your own sales presentation with these plain slides.
-
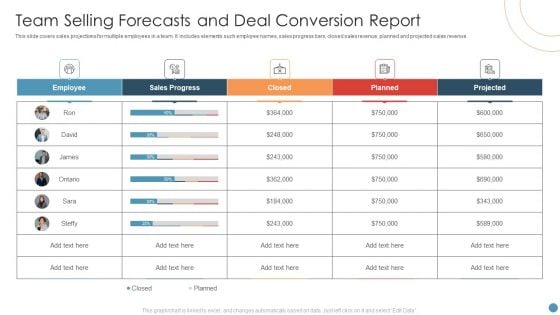
Team Selling Forecasts And Deal Conversion Report Themes PDF
This slide covers sales projections for multiple employees in a team. It includes elements such employee names, sales progress bars, closed sales revenue, planned and projected sales revenue. Pitch your topic with ease and precision using this Team Selling Forecasts And Deal Conversion Report Themes PDF. This layout presents information on Sales Progress, Employee, Team Selling Forecasts. It is also available for immediate download and adjustment. So, changes can be made in the color, design, graphics or any other component to create a unique layout.
-
Yearly Selling Forecasts Revenue Chart Summary PDF
This slide covers projections for yearly revenue generation from product sales. It includes forecasted revenue for different years and a graph depicting the projected sales revenue growth. Showcasing this set of slides titled Yearly Selling Forecasts Revenue Chart Summary PDF. The topics addressed in these templates are Project Sales Revenue, Forecasts Revenue Chart. All the content presented in this PPT design is completely editable. Download it and make adjustments in color, background, font etc. as per your unique business setting.
-
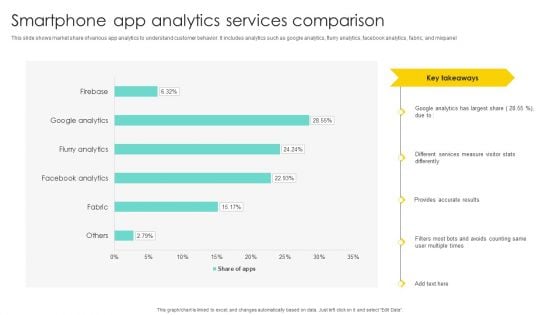
Smartphone App Analytics Services Comparison Brochure PDF
This slide shows market share of various app analytics to understand customer behavior. It includes analytics such as google analytics, flurry analytics, facebook analytics, fabric, and mixpanel. Pitch your topic with ease and precision using this Smartphone App Analytics Services Comparison Brochure PDF. This layout presents information on Different Services Measure, Visitor Stats Differently, Provides Accurate Results. It is also available for immediate download and adjustment. So, changes can be made in the color, design, graphics or any other component to create a unique layout.
-
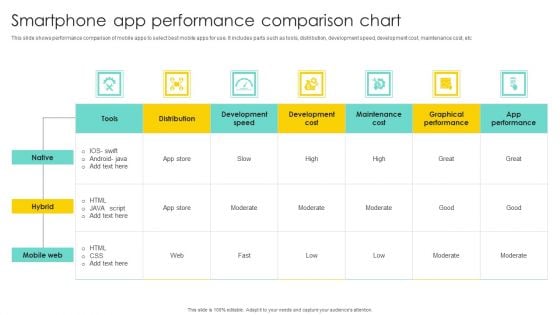
Smartphone App Performance Comparison Chart Rules PDF
Showcasing this set of slides titled Smartphone App Performance Comparison Chart Rules PDF. The topics addressed in these templates are Development Speed, Maintenance Cost, Graphical Performance. All the content presented in this PPT design is completely editable. Download it and make adjustments in color, background, font etc. as per your unique business setting.
-
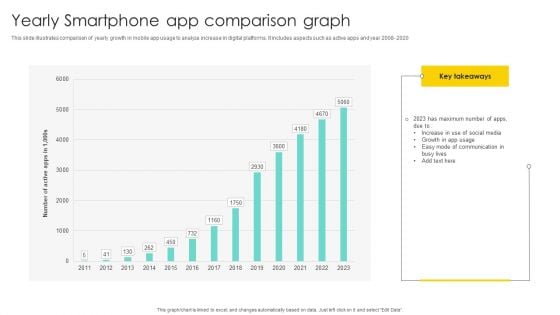
Yearly Smartphone App Comparison Graph Diagrams PDF
Showcasing this set of slides titled Yearly Smartphone App Comparison Graph Diagrams PDF. The topics addressed in these templates are Comparison Graph, Comparison Of Yearly, Growth In App . All the content presented in this PPT design is completely editable. Download it and make adjustments in color, background, font etc. as per your unique business setting.
-
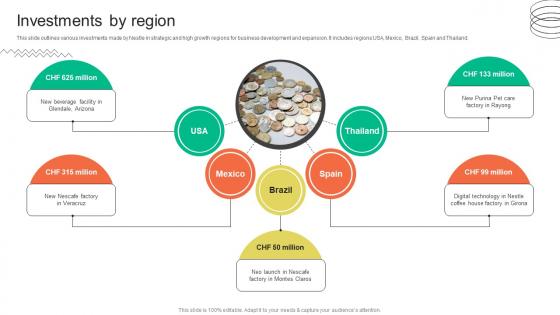
Investments By Region FMCG Provider Company Profile CP SS V
This slide outlines various investments made by Nestle in strategic and high growth regions for business development and expansion. It includes regions USA, Mexico, Brazil, Spain and Thailand. Are you in need of a template that can accommodate all of your creative concepts This one is crafted professionally and can be altered to fit any style. Use it with Google Slides or PowerPoint. Include striking photographs, symbols, depictions, and other visuals. Fill, move around, or remove text boxes as desired. Test out color palettes and font mixtures. Edit and save your work, or work with colleagues. Download Investments By Region FMCG Provider Company Profile CP SS V and observe how to make your presentation outstanding. Give an impeccable presentation to your group and make your presentation unforgettable.
-
Icon For Starbucks Product Based Pricing Technique Slides PDF
Persuade your audience using this Icon For Starbucks Product Based Pricing Technique Slides PDF. This PPT design covers three stages, thus making it a great tool to use. It also caters to a variety of topics including Increase Sales Volumes, Increase User Engagement, Increase Brand Awareness. Download this PPT design now to present a convincing pitch that not only emphasizes the topic but also showcases your presentation skills.
-
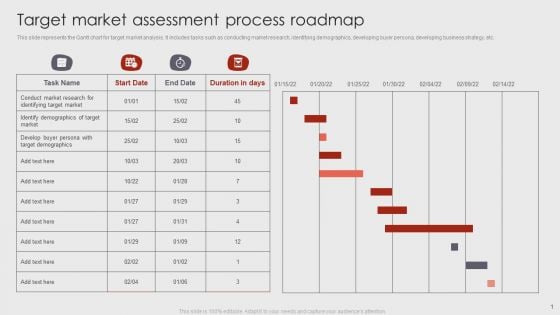
Target Market Assessment Process Roadmap Demonstration PDF
This slide represents the Gantt chart for target market analysis. It includes tasks such as conducting market research, identifying demographics, developing buyer persona, developing business strategy, etc. Showcasing this set of slides titled Target Market Assessment Process Roadmap Demonstration PDF. The topics addressed in these templates are Develop, Target Demographics, Target Market. All the content presented in this PPT design is completely editable. Download it and make adjustments in color, background, font etc. as per your unique business setting.
-
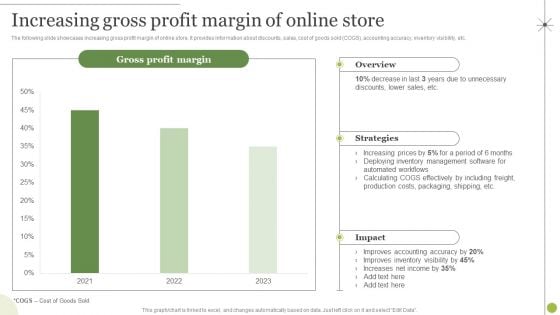
Managing E Commerce Business Accounting Increasing Gross Profit Margin Of Online Store Introduction PDF
The following slide showcases increasing gross profit margin of online store. It provides information about discounts, sales, cost of goods sold COGS, accounting accuracy, inventory visibility, etc. Are you in need of a template that can accommodate all of your creative concepts This one is crafted professionally and can be altered to fit any style. Use it with Google Slides or PowerPoint. Include striking photographs, symbols, depictions, and other visuals. Fill, move around, or remove text boxes as desired. Test out color palettes and font mixtures. Edit and save your work, or work with colleagues. Download Managing E Commerce Business Accounting Increasing Gross Profit Margin Of Online Store Introduction PDF and observe how to make your presentation outstanding. Give an impeccable presentation to your group and make your presentation unforgettable.
-
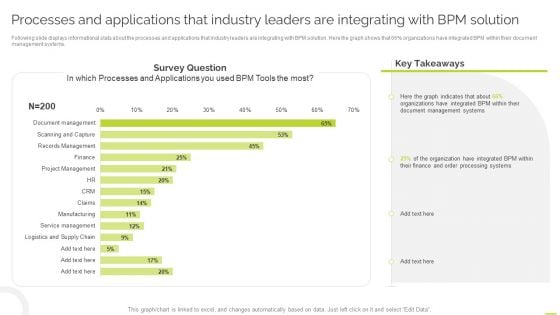
Processes And Applications That Industry Leaders Are Integrating With BPM Solution Mockup PDF
Following slide displays informational stats about the processes and applications that industry leaders are integrating with BPM solution. Here the graph shows that 66 percent organizations have integrated BPM within their document management systems. Are you searching for a Processes And Applications That Industry Leaders Are Integrating With BPM Solution Mockup PDF that is uncluttered, straightforward, and original Its easy to edit, and you can change the colors to suit your personal or business branding. For a presentation that expresses how much effort you have put in, this template is ideal With all of its features, including tables, diagrams, statistics, and lists, its perfect for a business plan presentation. Make your ideas more appealing with these professional slides. Download Processes And Applications That Industry Leaders Are Integrating With BPM Solution Mockup PDF from Slidegeeks today.
-
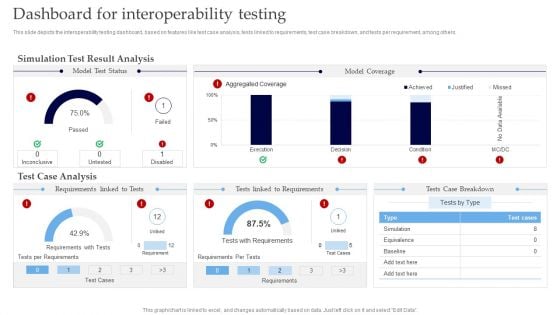
Interoperability Software Testing Dashboard For Interoperability Testing Information PDF
This slide depicts the interoperability testing dashboard, based on features like test case analysis, tests linked to requirements, test case breakdown, and tests per requirement, among others. Do you have an important presentation coming up Are you looking for something that will make your presentation stand out from the rest Look no further than Interoperability Software Testing Dashboard For Interoperability Testing Information PDF. With our professional designs, you can trust that your presentation will pop and make delivering it a smooth process. And with Slidegeeks, you can trust that your presentation will be unique and memorable. So why wait Grab Interoperability Software Testing Dashboard For Interoperability Testing Information PDF today and make your presentation stand out from the rest.
-
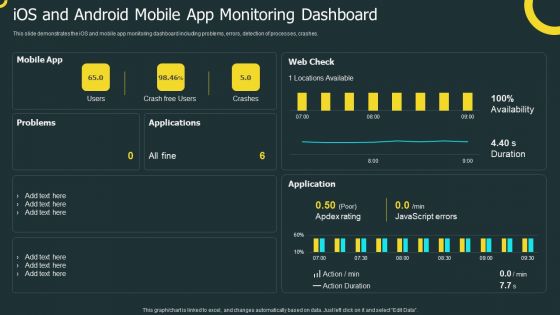
IOS Application Development Ios And Android Mobile App Monitoring Dashboard Pictures PDF
This slide demonstrates the iOS and mobile app monitoring dashboard including problems, errors, detection of processes, crashes. Crafting an eye catching presentation has never been more straightforward. Let your presentation shine with this tasteful yet straightforward IOS Application Development Ios And Android Mobile App Monitoring Dashboard Pictures PDF template. It offers a minimalistic and classy look that is great for making a statement. The colors have been employed intelligently to add a bit of playfulness while still remaining professional. Construct the ideal IOS Application Development Ios And Android Mobile App Monitoring Dashboard Pictures PDF that effortlessly grabs the attention of your audience Begin now and be certain to wow your customers.
-
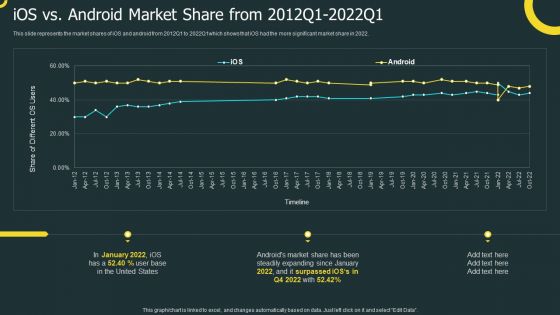
IOS Application Development Ios Vs Android Market Share From 2012Q1 2022Q1 Clipart PDF
This slide represents the market shares of iOS and android from 2012Q1 to 2022Q1which shows that iOS had the more significant market share in 2022. Formulating a presentation can take up a lot of effort and time, so the content and message should always be the primary focus. The visuals of the PowerPoint can enhance the presenters message, so our IOS Application Development Ios Vs Android Market Share From 2012Q1 2022Q1 Clipart PDF was created to help save time. Instead of worrying about the design, the presenter can concentrate on the message while our designers work on creating the ideal templates for whatever situation is needed. Slidegeeks has experts for everything from amazing designs to valuable content, we have put everything into IOS Application Development Ios Vs Android Market Share From 2012Q1 2022Q1 Clipart PDF.
-
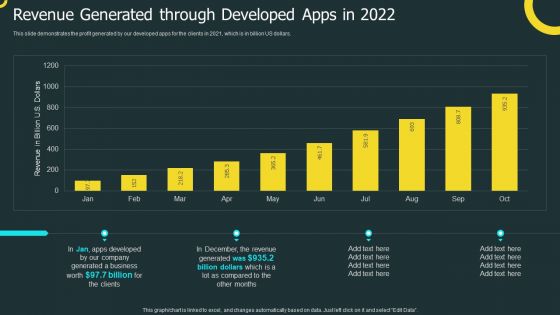
IOS Application Development Revenue Generated Through Developed Apps In 2022 Diagrams PDF
This slide demonstrates the profit generated by our developed apps for the clients in 2021, which is in billion US dollars. Slidegeeks has constructed IOS Application Development Revenue Generated Through Developed Apps In 2022 Diagrams PDF after conducting extensive research and examination. These presentation templates are constantly being generated and modified based on user preferences and critiques from editors. Here, you will find the most attractive templates for a range of purposes while taking into account ratings and remarks from users regarding the content. This is an excellent jumping off point to explore our content and will give new users an insight into our top notch PowerPoint Templates.
-
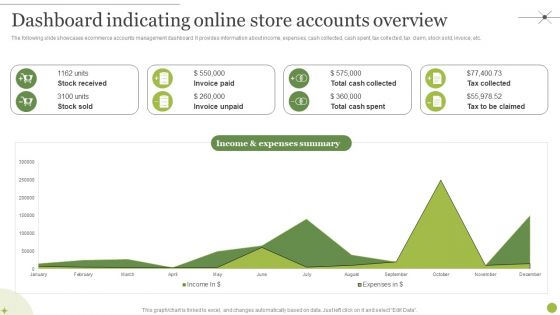
Managing E Commerce Business Accounting Dashboard Indicating Online Store Accounts Overview Inspiration PDF
The following slide showcases ecommerce accounts management dashboard. It provides information about income, expenses, cash collected, cash spent, tax collected, tax claim, stock sold, invoice, etc. There are so many reasons you need a Managing E Commerce Business Accounting Dashboard Indicating Online Store Accounts Overview Inspiration PDF. The first reason is you can not spend time making everything from scratch, Thus, Slidegeeks has made presentation templates for you too. You can easily download these templates from our website easily.
-
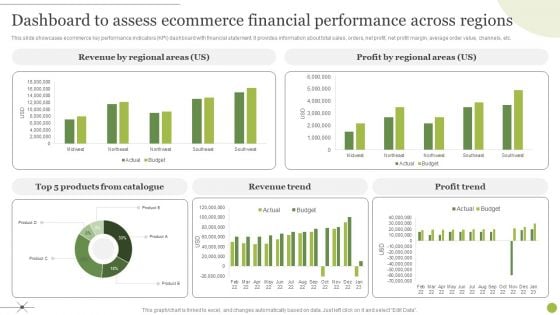
Managing E Commerce Business Accounting Dashboard To Assess Ecommerce Financial Performance Across Regions Graphics PDF
This slide showcases ecommerce key performance indicators KPI dashboard with financial statement. It provides information about total sales, orders, net profit, net profit margin, average order value, channels, etc. Do you have to make sure that everyone on your team knows about any specific topic I yes, then you should give Managing E Commerce Business Accounting Dashboard To Assess Ecommerce Financial Performance Across Regions Graphics PDF a try. Our experts have put a lot of knowledge and effort into creating this impeccable Managing E Commerce Business Accounting Dashboard To Assess Ecommerce Financial Performance Across Regions Graphics PDF. You can use this template for your upcoming presentations, as the slides are perfect to represent even the tiniest detail. You can download these templates from the Slidegeeks website and these are easy to edit. So grab these today.
-
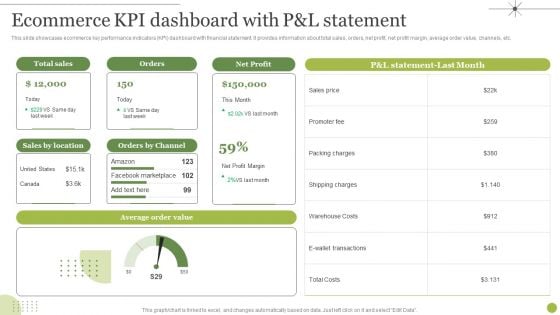
Managing E Commerce Business Accounting Ecommerce KPI Dashboard With P And L Statement Diagrams PDF
This slide showcases ecommerce key performance indicators KPI dashboard with financial statement. It provides information about total sales, orders, net profit, net profit margin, average order value, channels, etc. Present like a pro with Managing E Commerce Business Accounting Ecommerce KPI Dashboard With P And L Statement Diagrams PDF Create beautiful presentations together with your team, using our easy to use presentation slides. Share your ideas in real time and make changes on the fly by downloading our templates. So whether you are in the office, on the go, or in a remote location, you can stay in sync with your team and present your ideas with confidence. With Slidegeeks presentation got a whole lot easier. Grab these presentations today.
-
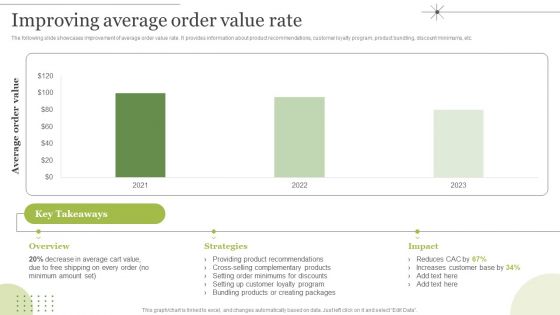
Managing E Commerce Business Accounting Improving Average Order Value Rate Graphics PDF
The following slide showcases improvement of average order value rate. It provides information about product recommendations, customer loyalty program, product bundling, discount minimums, etc. If you are looking for a format to display your unique thoughts, then the professionally designed Managing E Commerce Business Accounting Improving Average Order Value Rate Graphics PDF is the one for you. You can use it as a Google Slides template or a PowerPoint template. Incorporate impressive visuals, symbols, images, and other charts. Modify or reorganize the text boxes as you desire. Experiment with shade schemes and font pairings. Alter, share or cooperate with other people on your work. Download Managing E Commerce Business Accounting Improving Average Order Value Rate Graphics PDF and find out how to give a successful presentation. Present a perfect display to your team and make your presentation unforgettable.
-
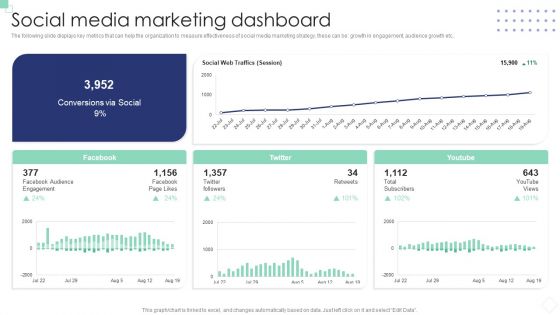
Implementing B2B And B2C Marketing Social Media Marketing Dashboard Designs PDF
The following slide displays key metrics that can help the organization to measure effectiveness of social media marketing strategy, these can be growth in engagement, audience growth etc. The best PPT templates are a great way to save time, energy, and resources. Slidegeeks have 100 percent editable powerpoint slides making them incredibly versatile. With these quality presentation templates, you can create a captivating and memorable presentation by combining visually appealing slides and effectively communicating your message. Download Implementing B2B And B2C Marketing Social Media Marketing Dashboard Designs PDF from Slidegeeks and deliver a wonderful presentation.
-
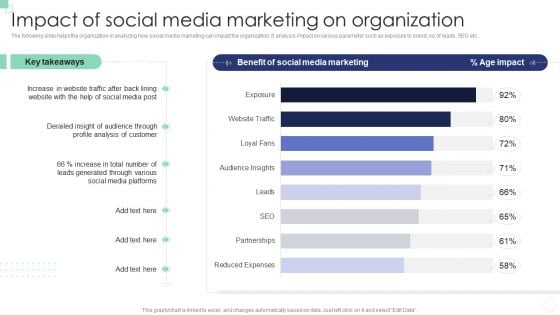
Implementing B2B And B2C Marketing Impact Of Social Media Marketing On Organization Background PDF
The following slide helps the organization in analyzing how social media marketing can impact the organization. It analysis impact on various parameter such as exposure to brand, no of leads, SEO etc. Coming up with a presentation necessitates that the majority of the effort goes into the content and the message you intend to convey. The visuals of a PowerPoint presentation can only be effective if it supplements and supports the story that is being told. Keeping this in mind our experts created Implementing B2B And B2C Marketing Impact Of Social Media Marketing On Organization Background PDF to reduce the time that goes into designing the presentation. This way, you can concentrate on the message while our designers take care of providing you with the right template for the situation.

 Home
Home 


