Finance PowerPoint Icons
-
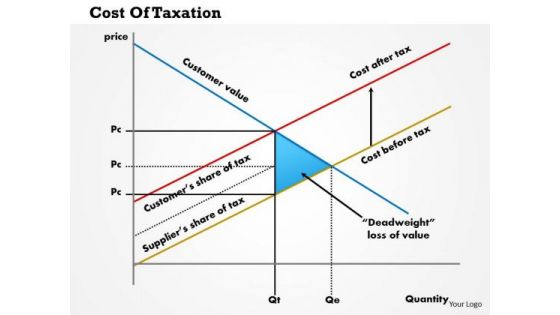
Business Framework Cost Of Taxation PowerPoint Presentation
This innovative image slide has been designed to display coat of taxation graph. This business framework template may be used to display financial ratios of taxation in your presentations. This image slide will impart professional appearance to your presentations.
-
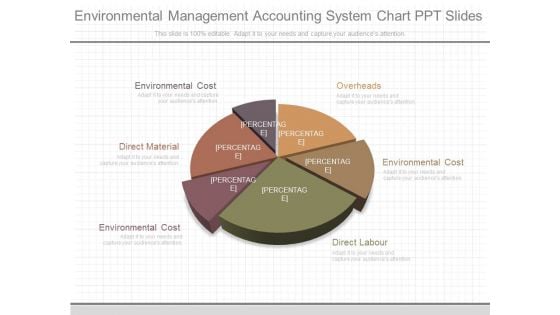
Environmental Management Accounting System Chart Ppt Slides
This is a environmental management accounting system chart ppt slides. This is a six stage process. The stages in this process are overheads, environmental cost, direct labour, environmental cost, direct material, environmental cost.
-
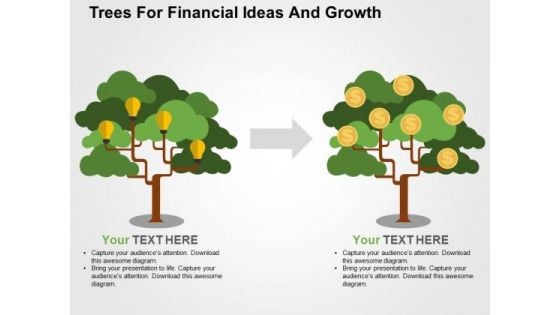
Trees For Financial Ideas And Growth PowerPoint Template
Create dynamic presentations with our professional template containing graphics of trees with bulb and dollar symbols. This diagram represents the concept of financial ideas and growth. Download this template to leave permanent impression on your audience.
-
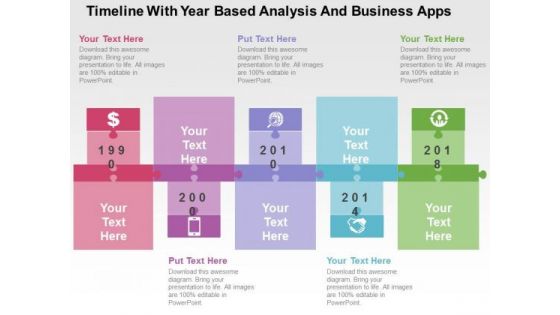
Timeline With Year Based Analysis And Business Apps PowerPoint Template
Create dynamic presentations with our professional template containing graphics of timeline with business icons. This diagram may be used to display planning and analysis. Download this template to leave permanent impression on your audience.
-
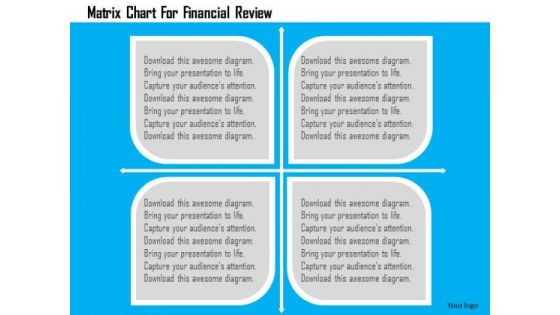
Business Diagram Matrix Chart For Financial Review Presentation Template
Our above business diagram has been designed with graphics of matrix chart. This slide is suitable to present financial review. Use this business diagram to present your work in a more smart and precise manner.
-
Laptop Globe Bar Graph Dollar Coins Ppt Slides Graphics
Icons of laptop, globe and bar graph with dollar coins have been used to design this icon PPT slide. Download these icons to display concepts of technology and financial growth. Use this slide to build an exclusive presentation.
-
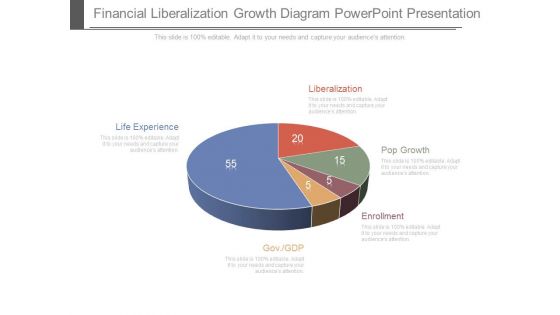
Financial Liberalization Growth Diagram Powerpoint Presentation
This is a financial liberalization growth diagram powerpoint presentation. This is a five stage process. The stages in this process are liberalization, pop growth, enrollment, gov gdp, life experience.
-
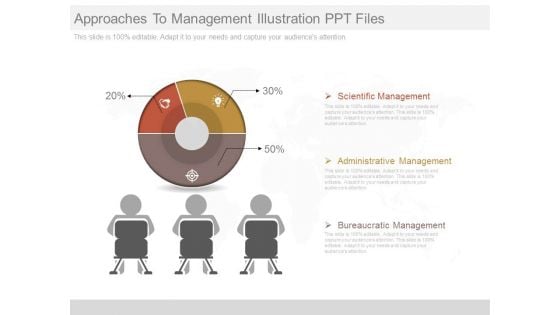
Approaches To Management Illustration Ppt Files
This is a approaches to management illustration ppt files. This is a three stage process. The stages in this process are scientific management, administrative management, bureaucratic management.
-
Stock Photo Blue Globe With Golden Dollar Coins PowerPoint Slide
Be The Doer With Our stock photo blue globe with golden dollar coins powerpoint slide Powerpoint Templates. Put Your Thoughts Into Practice.
-
Stock Photo Illustration Of Four Soccer Balls PowerPoint Slide
Our stock photo illustration of four soccer balls powerpoint slide Powerpoint Templates Leave No One In Doubt. Provide A Certainty To Your Views.
-
Stock Photo Increasing Stack Of Coins With Globe PowerPoint Slide
Edit Your Work With Our stock photo increasing stack of coins with globe powerpoint slide Powerpoint Templates. They Will Help You Give The Final Form.
-
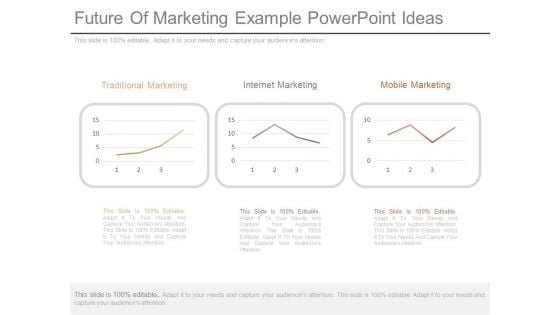
Future Of Marketing Example Powerpoint Ideas
This is a future of marketing example powerpoint ideas. This is a three stage process. The stages in this process are traditional marketing, internet marketing, mobile marketing.
-
Stock Photo 50 Percent Discount With Shopping Cart PowerPoint Slide
This image of 50 percent discount with shopping cart is very useful for presentations on shopping and purchasing. Discount and sale concepts can also be described with this image slide. Create eye-catching presentation using this image.
-
Money Market Example Diagram Ppt Examples Slides
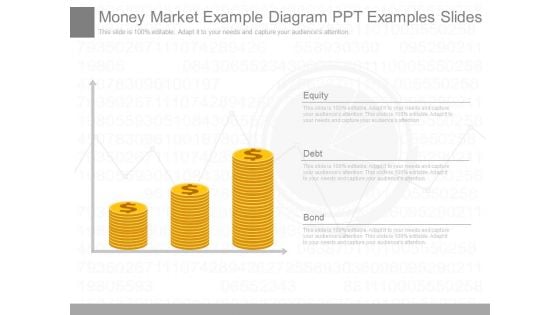
This is a money market example diagram ppt examples slides. This is a three stage process. The stages in this process are equity, debt, bond.
-
Stock Photo Cart With 15 Percent Discount Sale Concept PowerPoint Slide
The above image is designed with 15 percent discount with shopping cart. This image is designed to represent concept of shopping, sale and discount. Our unique image makes your presentations more professional.
-
Stock Photo Computer Mouse In Shopping Cart For Online Shopping PowerPoint Slide
Our above image has been designed with computer mouse in shopping cart. This image is well designed to portray concepts of online shopping. Use this shopping cart image to make outstanding presentations.
-
Pound Currency Symbol With Six Segments PowerPoint Template
Visually support your presentation with our above template showing pound currency symbol. This slide is suitable for finance related presentations. This template offers an excellent background to build impressive presentation.
-
Business Diagram Circular Framework For Strategic Plan Presentation Template
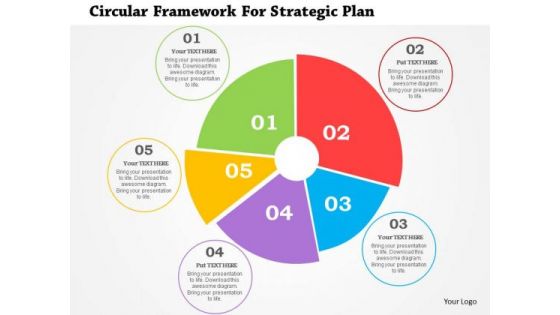
Download this exclusive business diagram to present marketing research study. This slide contains the circular framework. This diagram can be useful for business presentations.
-
Stock Photo Falling Dominoes Of Dollar Symbol PowerPoint Slide
Create stunning presentations with our professional image containing a graphic of falling dominoes of dollar symbols. Accelerate the impact of your ideas with this image slide. It will take you to a higher gear.
-
Identify Insights Diagram Powerpoint Slides
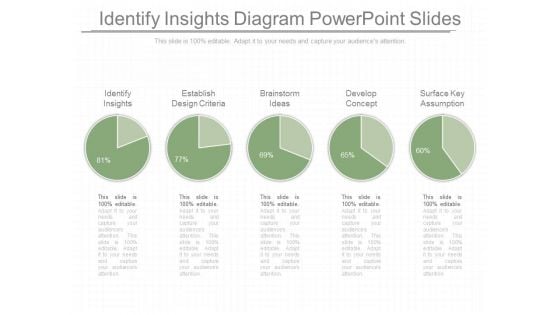
This is a identify insights diagram powerpoint slides. This is a five stage process. The stages in this process are identify insights, establish design criteria, brainstorm ideas, develop concept, surface key assumption.
-
Web Sales Powerpoint Slide Presentation Guidelines
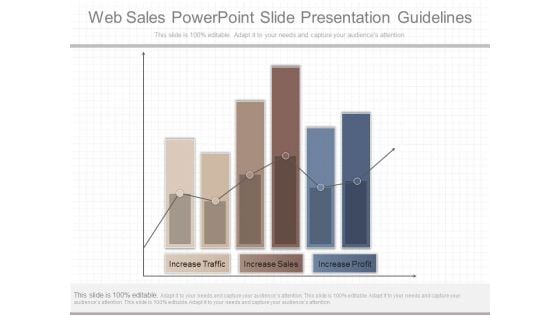
This is a web sales powerpoint slide presentation guidelines. This is a six stage process. The stages in this process are increase traffic, increase sales, increase profit.
-
0814 Bargraph Of Dollars Bundles With Arrow Graphic Image Graphics For PowerPoint
This unique image has backdrop of bar graph of dollars bundles with growth arrow. This image displays the concept of financial growth. Define the business growth with this suitable image. Use this image to make outstanding presentations
-
0814 Bundles Of Dollars Stacked Together Image Graphics For PowerPoint
This professional image depicts graphics of dollars bundles. You can download this image to make presentations on finance and business related topics. Make a professional presentation with this high quality image slide.
-
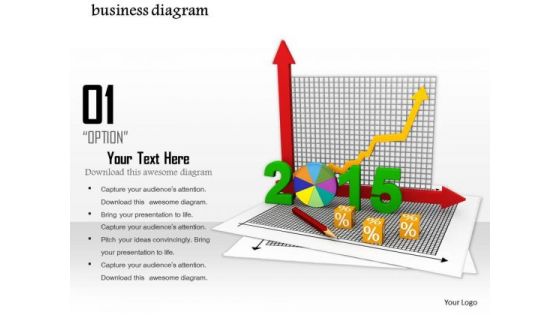
0814 Business Diagram 2015 For Planning Image Graphics For PowerPoint
Define the concepts of target and success with this unique image. This image depicts planning for year 2015. In this image pie chart and bar graph is displayed with year 2015. Use this image in business, marketing and sales related presentations.
-
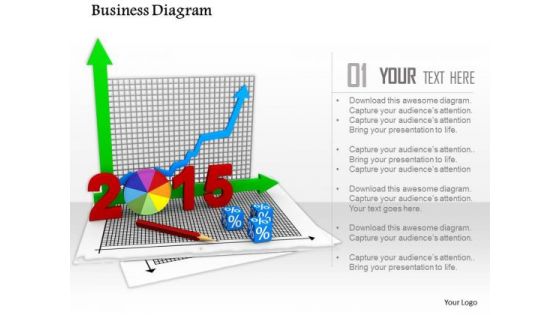
0814 Business Diagram For Planning Image Graphics For PowerPoint
Define the concepts of planning with this unique image. This image of charts and graphs depicts planning for year 2015. In this image pie chart and bar graph is displayed with year 2015. Use this image in business, marketing and sales related presentations.
-
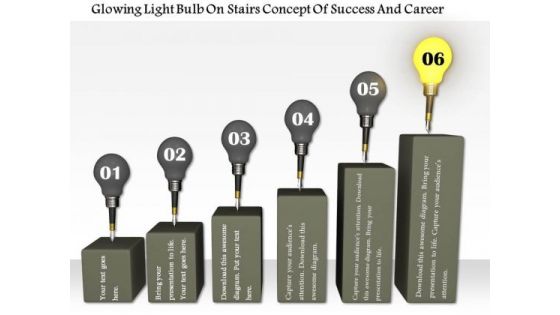
Stock Photo Glowing Bulb On Top Of Bar Graph PowerPoint Slide
This conceptual image slide displays bulbs on bar graph. This image slide has been crafted with graphic of bar graph and bulbs and individual glowing bulb. This image slide depicts success and carrier. Use this image slide to express views on leadership, teamwork, success, achievements and growth in your presentations. This image slide may also be used to represent different business strategies. Create beautiful presentations using this image slide.
-
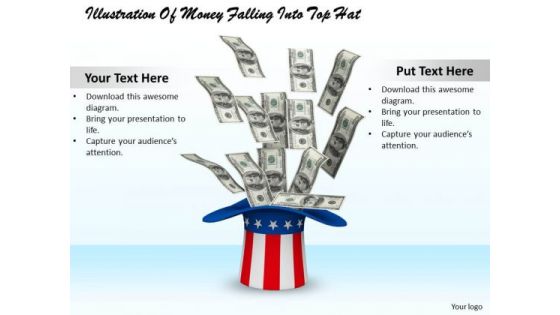
Stock Photo Illustration Of Money Falling Into Top Hat PowerPoint Slide
Use this professional image in finance and money related topics. This image depicts graphics of American bank notes falling in top hat. Make an outstanding presentation with this unique image slide.
-
Stock Photo Lifesaving Belts On Dollars PowerPoint Slide
Define your ideas in inspiring manner with this image of lifesaving belts with dollars. Use this image to describe the concept of financial crisis. You may use this image to share a plan to achieve the desired goals.
-
Stock Photo Patricks Day Symbols On Clover Leaf PowerPoint Slide
This image contains clover leaf designs with awesome ornaments and symbols of St. Patrick day. The clover is a sign of good luck. You can use this image to explain about the customs of St. Patrick day.
-
0814 Stock Photo Dollar On Top Of Books Graph PowerPoint Slide
The above image represent concept of financial growth. Adjust the above image of dollar currency symbol on top of books graph in order to show financial growth. Dazzle the audience with your thoughts.
-
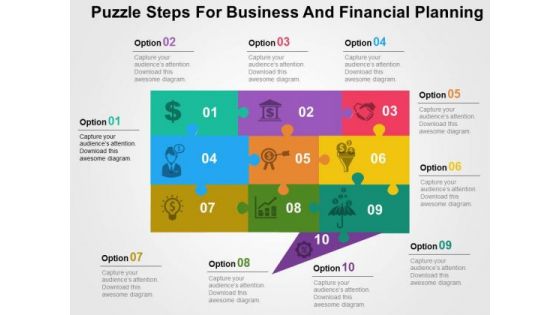
Puzzle Steps For Business And Financial Planning PowerPoint Templates
This creative slide has been designed with graphics of puzzle steps. Use this unique slide in presentations related to business and financial planning. This template adds value to your idea.
-
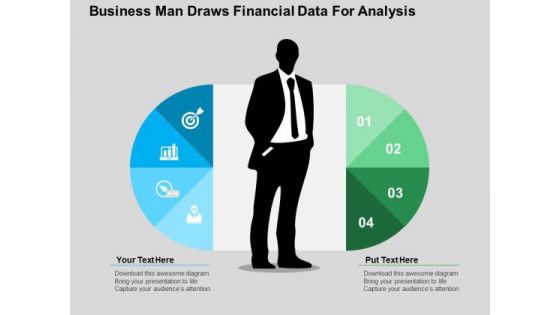
Business Man Draws Financial Data For Analysis PowerPoint Templates
This PowerPoint slide has a theme for financial data analysis. This image has been designed to display concept of financial planning and analysis. Deliver amazing presentations to mesmerize your audience using this image
-
Stock Photo Time For Money Text On Computer Key PowerPoint Slide
We have used graphic of key with word time for money to craft this image. Display the concept of timely action for earning money with this conceptual image. This image is suitable for business and finance related presentations. Create an extra ordinary presentation with this exclusive image.
-
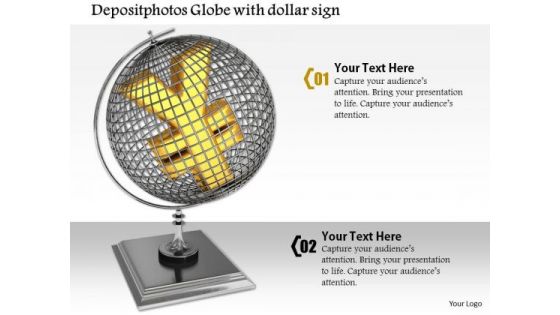
Stock Photo Yen Symbol On Globe For Currency Value PowerPoint Slide
This image slide displays yen symbol on globe for currency value. This conceptual image has been crafted to depict finance. You may change size, color and orientation of any icon to your liking. Use this PowerPoint template, in your presentations to express views on financial concepts like global monetary policies and strategies etc. This image may also be used to represent cash flow finance. This image slide will enhance the quality of your presentations.
-
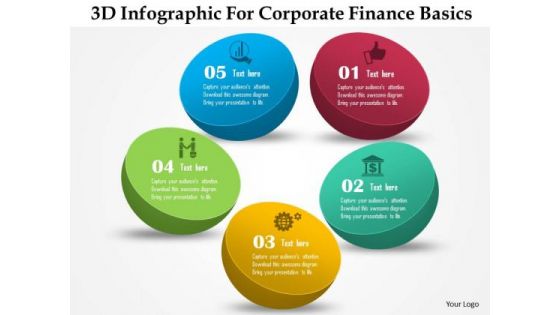
Business Diagram 3d Infographic For Corporate Finance Basics Presentation Template
This power point template displays business infographic. You may use these icons to display market research. Use our template to emphasize your views.
-
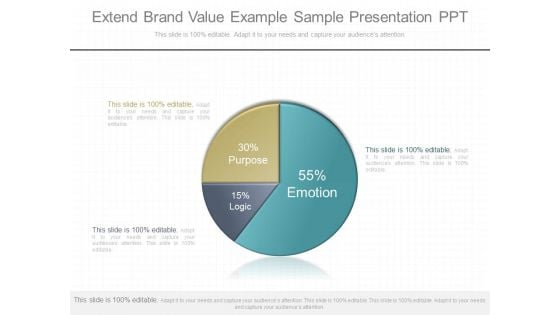
Extend Brand Value Example Sample Presentation Ppt
This is a extend brand value example sample presentation ppt. This is a three stage process. The stages in this process are purpose, logic, emotion.\n\n\n\n\n\n\n\n\n\n\n\n
-
Stock Photo Design Of Financial Charts And Reports PowerPoint Slide
This image slide has been professionally designed to give complete look to your business presentations. This image is designed with graphics of business reports and charts. Use this image in marketing and sales related presentations.
-
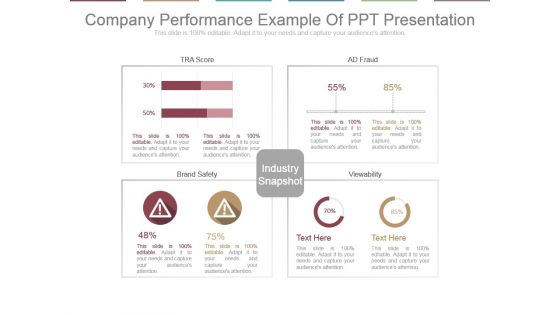
Company Performance Example Of Ppt Presentation
This is a company performance example of ppt presentation. This is a four stage process. The stages in this process are tra score, ad fraud, brand safety, view ability, industry snapshot.
-
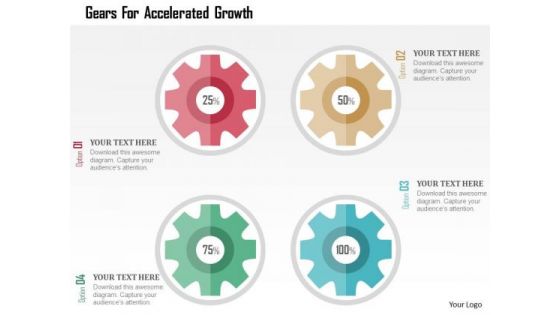
Business Diagram Gears For Accelerated Growth Presentation Template
This business slide displays graphics of gears. Download this diagram to display information in visual manner. This template is innovatively designed to highlight your worthy views
-
Stock Photo Shopping Carts In Shape Of Dollar Symbol PowerPoint Slide
Use this image to make financial and business presentations. This image displays shopping carts in shape of dollar symbol. Concept of money and finance can be described with this imge.
-
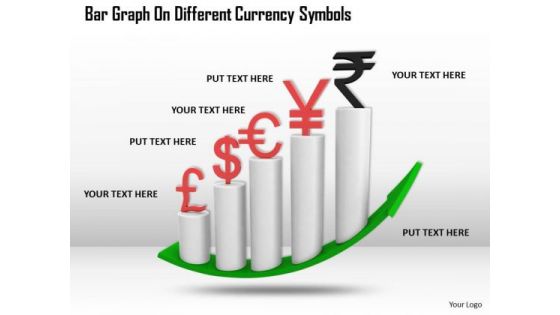
Stock Photo Bar Graph On Different Currency Symbols PowerPoint Slide
This image slide displays bar graph with different currency symbols. This image has been designed with graphic of bar graph, green colored growth arrow and symbols of different currencies. Use this image slide, in your presentations to express views on finance, monetary growth and achievements. This image slide may also be used to exhibit finance accounts in your presentations. This image slide will enhance the quality of your presentations.
-
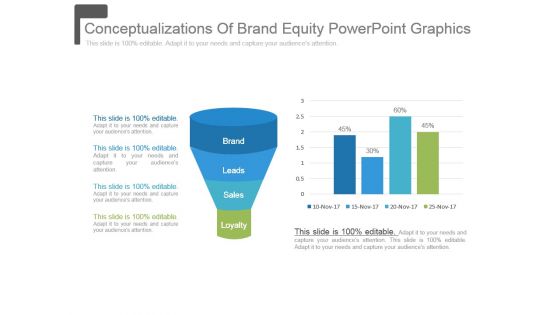
Conceptualizations Of Brand Equity Powerpoint Graphics
This is a conceptualizations of brand equity powerpoint graphics. This is a two stage process. The stages in this process are brand, leads, sales, loyalty.
-
Stock Photo Atm Card With Lock For Security PowerPoint Slide
This image slide contains graphics of ATM card with lock. You may use this image to depict safe, secure and easy way to manage your money. Accelerate the impact of your ideas with this image slide.
-
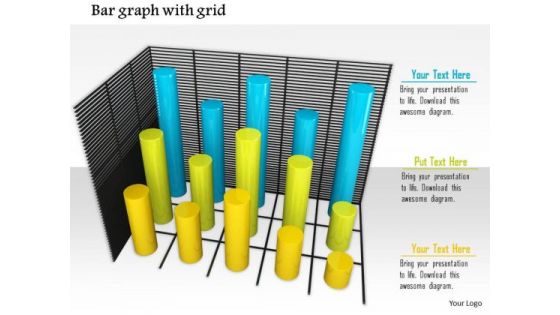
Stock Photo Bar Graph With Grid PowerPoint Slide
This image slide displays bar graph with grid. This image has been designed with graphic of 3d multicolor bar graph. Use this image slide, in your presentations to express views on finance, growth and success. This image slide may also be used to exhibit any information which requires visual presentation in your presentations. This image slide will enhance the quality of your presentations.
-
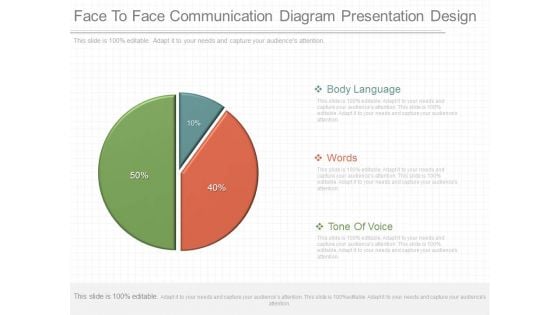
Face To Face Communication Diagram Presentation Design
This is a face to face communication diagram presentation design. This is a three stage process. The stages in this process are body language, words, tone of voice.
-
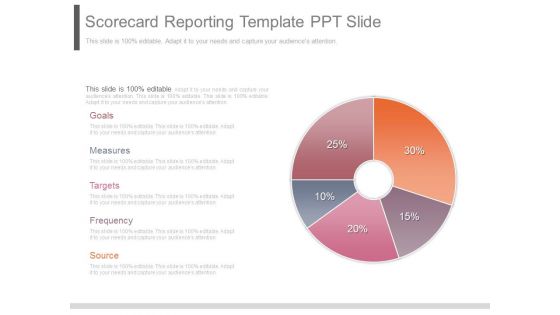
Scorecard Reporting Template Ppt Slide
This is a scorecard reporting template ppt slide. This is a five stage process. The stages in this process are goals, measures, targets, frequency, source.
-
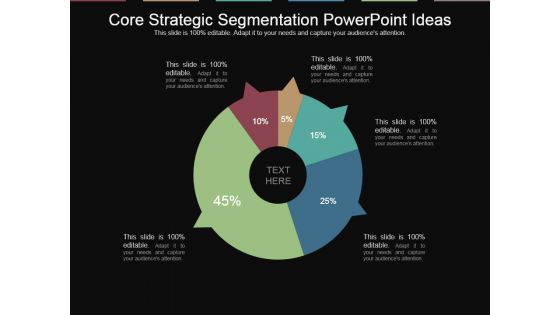
Core Strategic Segmentation Powerpoint Ideas
This is a core strategic segmentation powerpoint ideas. This is a five stage process. The stages in this process are data, diagram, business, marketing, analysis.
-
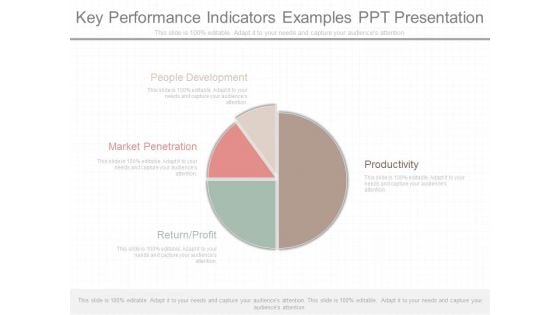
Key Performance Indicators Examples Ppt Presentation
This is a key performance indicators examples ppt presentation. This is a four stage process. The stages in this process are people development, productivity, market penetration, return profit.
-
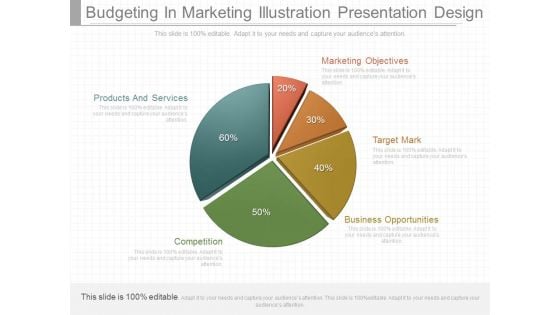
Budgeting In Marketing Illustration Presentation Design
This is a budgeting in marketing illustration presentation design. This is a five stage process. The stages in this process are products and services, marketing objectives, target mark, business opportunities, competition.
-
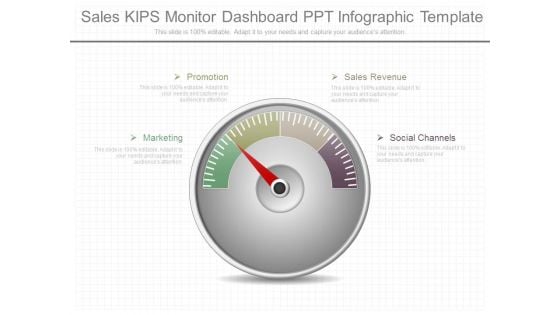
Sales Kips Monitor Dashboard Ppt Infographic Template
This is a sales kips monitor dashboard ppt infographic template. This is a four stage process. The stages in this process are promotion, marketing, sales revenue, social channels.
-
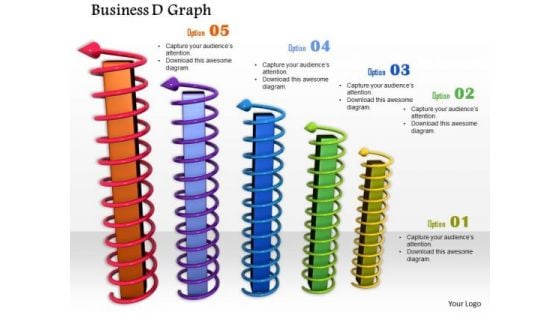
Stock Photo Twisted Arrows Around Bars PowerPoint Slide
This conceptual image displays graphics of bar graph. This image of bar graph can be used to show growth in sales or profit. Pass your ideas through this image slide in relation to profit growth.
-
Stock Photo Book On Learn To Save Money PowerPoint Slide
Create visually stunning and define your presentations in a unique and inspiring manner using this above Image which contains graphics of book of learn to save money. So be a successful presenter by using this wonderful image slide.
-
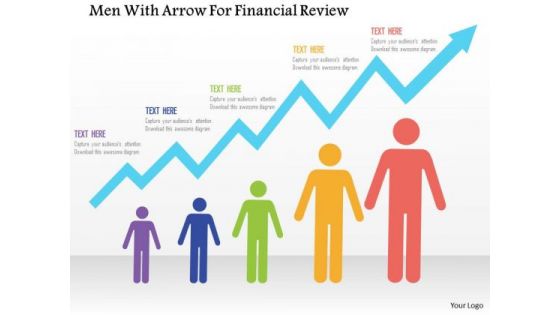
Business Diagram Men With Arrow For Financial Review Presentation Template
This business slide displays 3d men with arrow. Use this diagram slide in your presentations for financial review. This slide provides the framework to accommodate your thoughts.
-
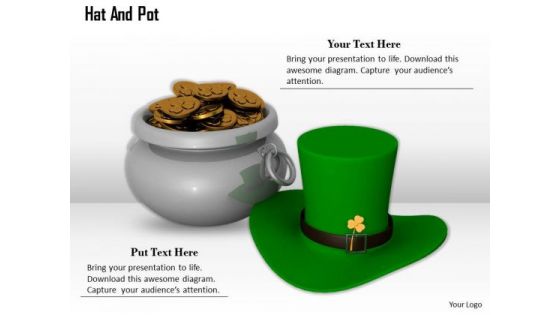
Stock Photo Design Of Money Pot With Hat PowerPoint Slide
This image contains design of money pot with hat of St. Patrick day. The clover on hat is a sign of good luck. You can use this image to explain about the customs of St. Patricks day.
-
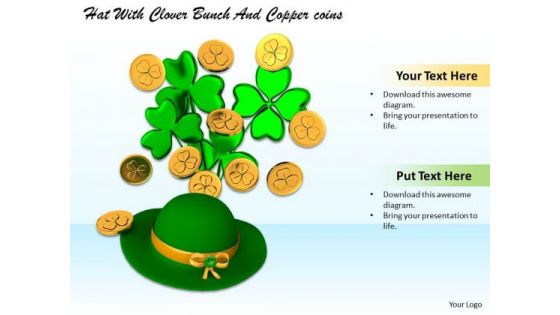
Stock Photo Hat With Gold Coins And Clover PowerPoint Slide
This image contains symbols of hat with gold coins and clover for St. Patricks day. The clover is a sign of good luck. You can use this image to explain about the customs of St. Patricks day.
-
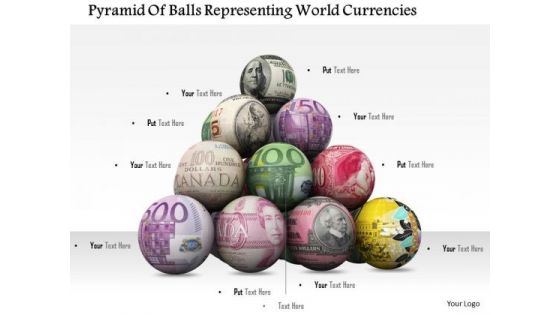
Stock Photo Global Currencies On Ball In Pyramid Shape PowerPoint Slide
Use this image of global currencies on balls in finance and business related topics. You can download this image of 3d pyramid of balls with global currencies design to make awesome presentations for global business.
-
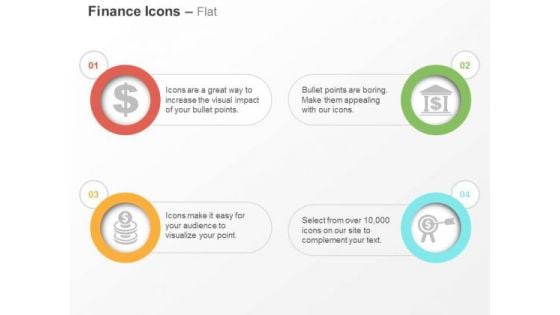
Dollar Symbol Coins Banking Target Ppt Slides Graphics
Icons of dollar, coins, banking and target have been displayed in this PPT slide. These icons are designed to display the concepts of finance and banking. This icon template
-
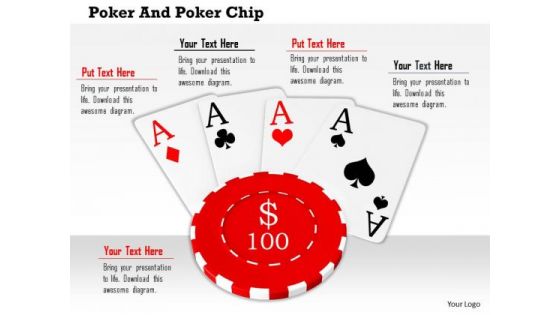
Stock Photo Aces On 100 Dollar Poker Chip PowerPoint Slide
The above image contains a graphic of aces on 100 dollar chip. This image portrays the concepts of gambling, poker and casino. You may use this image to make outstanding presentations. Accelerate the impact of your ideas using this image.
-
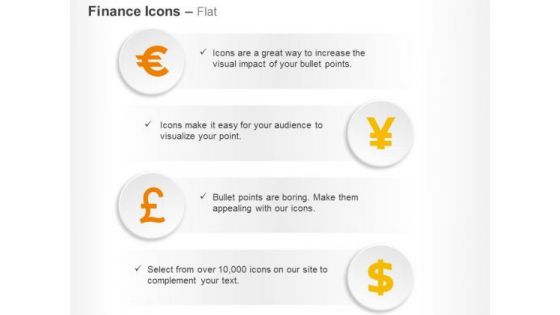
Euro Pound Yen Dollar Currencies Ppt Slides Graphics
Icons of Euro, Pound, Yen and dollar currencies have been displayed in this slide. This icon template is suitable for finance and currency related presentations. Use these icons and explain the topics in a visual manner.
-
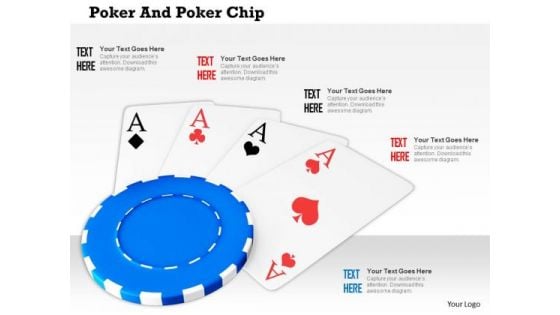
Stock Photo Four Aces On Blue Poker Chip PowerPoint Slide
The above image contains a graphic of aces on poker chip. This image portrays the concepts of gambling, poker and casino. You may use this image to make outstanding presentations. Accelerate the impact of your ideas using this image.
-
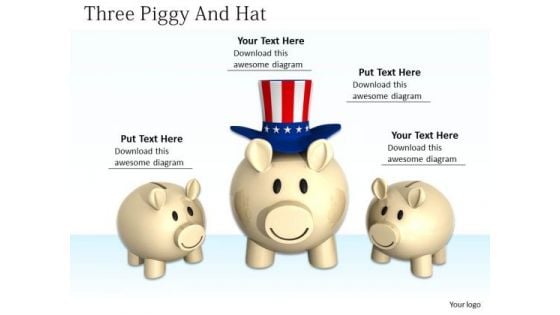
Stock Photo American Hat On Big Piggy Bank Pwerpoint Slide
This conceptual image is designed with graphics of American hat on piggy bank. Concept of success is well explained in this image. This Unique image provides impressive background for your presentations.
-
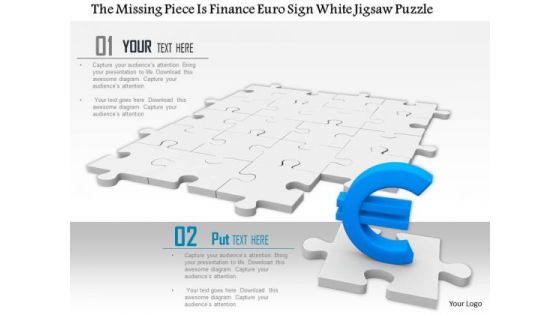
Stock Photo Blue Euro Symbol On Puzzle Piece Pwerpoint Slide
This image is designed with graphic of Euro symbol on puzzle piece. This image contains finance and currency concepts. Use this image in your presentation to display business, finance and currency related topics.
-
Stock Photo Conceptual Image Of Time For Money Pwerpoint Slide
We have used graphic of key with time for money word in this image. Display the concept of timely action for earning money with this conceptual image. This image is suitable for business and finance related presentations. Create an extra ordinary presentation with this exclusive image.
-
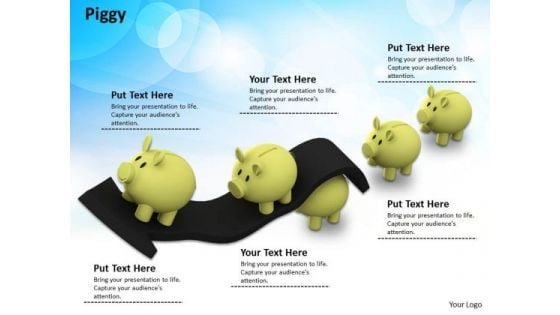
Stock Photo Piggy Banks On Growth Arrow PowerPoint Slide
This image is designed with piggy banks on growth arrow. This image portrays the concepts of saving and investment. You may use this image to make outstanding presentations.
-
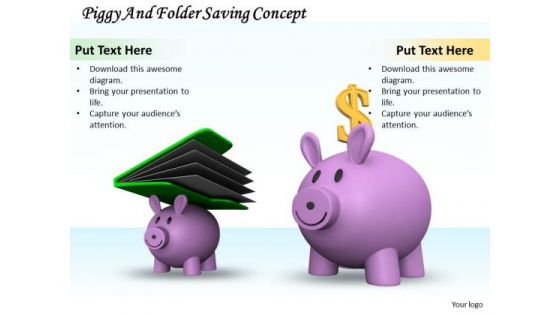
Stock Photo Piggy Banks Saving Money Illustration PowerPoint Slide
Explain the concept of saving money with this unique image. To define this concept we have used graphic of piggy banks with folder and dollar symbol. Use this image in your business related presentations to explain the concept in visual manner.
-
Business Diagram Piggy With Icons For Financial Planning Presentation Template
Download our above diagram to express information in a visual way. It contains piggy with icons displaying financial planning. Download this diagram to make professional presentations.
-
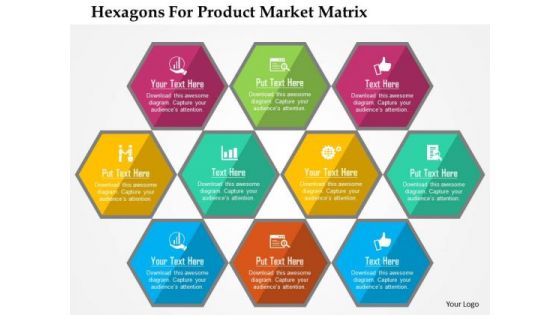
Business Diagram Hexagons For Product Market Matrix Presentation Template
This business diagram has been designed with colorful hexagons. Use this diagram to represent business information in visual manner. Download this diagram to make business presentations.
-
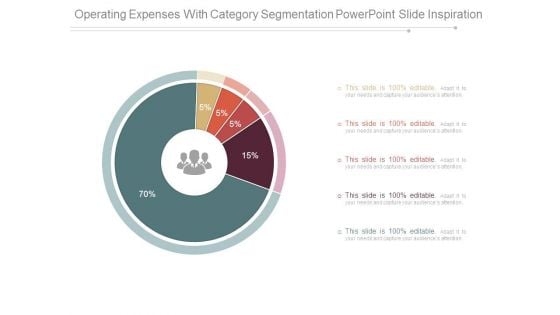
Operating Expenses With Category Segmentation Powerpoint Slide Inspiration
This is a operating expenses with category segmentation powerpoint slide inspiration. This is a five stage process. The stages in this process are finance, success, business, marketing, percentage.
-
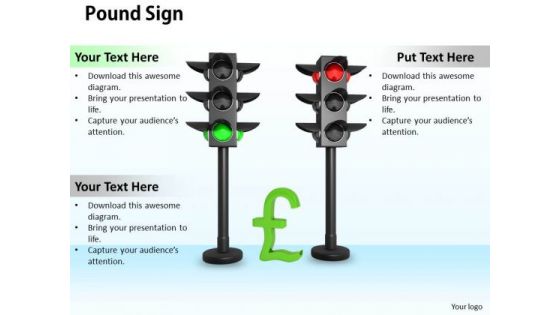
Stock Photo Pound Sign In Traffic Lights PowerPoint Slide
Use this image in money and finance related topics. To define this concept we have used graphic of pound symbol in traffic lights. Use this image in your business related presentations to explain the concept in visual manner.
-
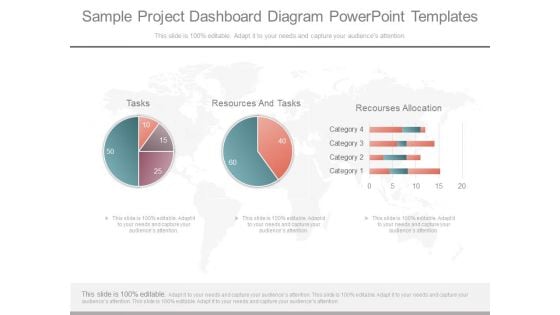
Sample Project Dashboard Diagram Powerpoint Templates
This is a sample project dashboard diagram powerpoint templates. This is a three stage process. The stages in this process are tasks, resources and tasks, resources allocation.
-
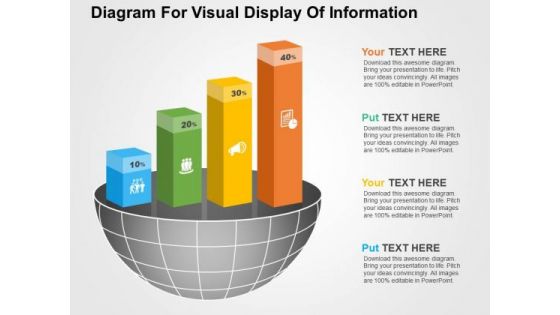
Diagram For Visual Display Of Information PowerPoint Templates
Visually support your presentation with our above template illustrating quantitative information. It contains graphics of bars. Etch your views in the brains of your audience with this diagram slide.
-
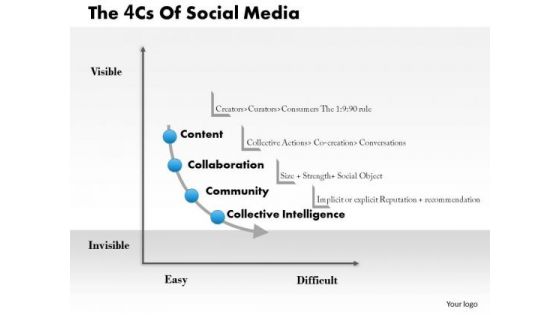
Business Framework 4cs Of Social Media PowerPoint Presentation
This diagram graphically represents 4cs of social media. 4Cs are customer, cost, convenience and communication. This diagram has area for your own text to assist you get your point across.
-
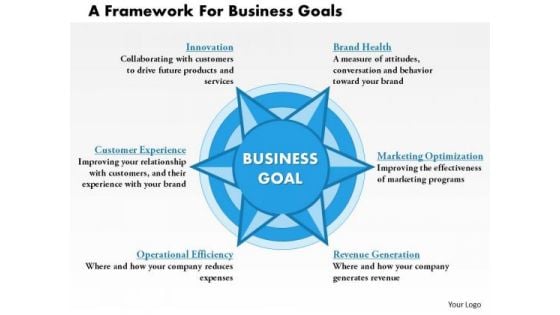
Business Framework A Framework For Business Goals PowerPoint Presentation
This powerpoint diagram is ideal graphics to professionally present your business goals and objectives. Illustrate specific project stages or development steps with the assistance of this integrated graphics.
-
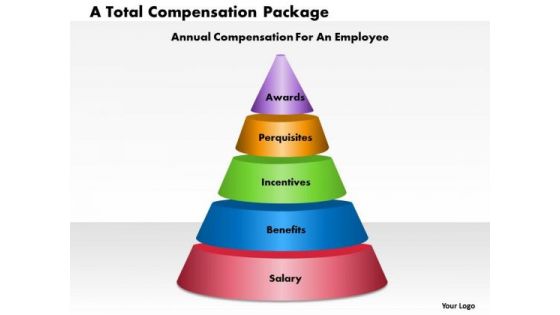
Business Framework A Total Compensation Package PowerPoint Presentation
This slide displays pyramid diagram of total compensation package. This diagram displays framework for annual compensation for an employee. For an effective impact on the viewers, Use this stunning diagram for business presentations.
-
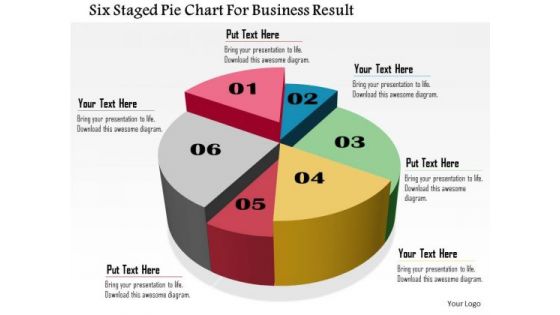
Business Daigram Six Staged Pie Chart For Business Result Presentation Templets
Six staged pie chart is used to design this business slide. Download this diagram to make business and financial reports. Use our above diagram to express information in a visual way.
-
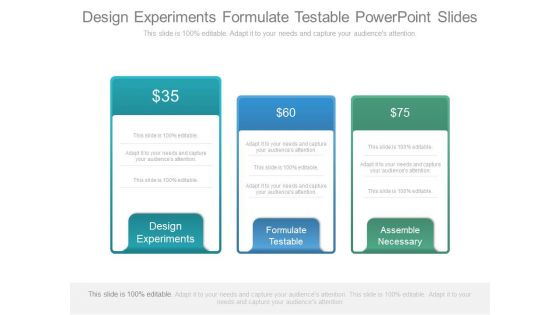
Design Experiments Formulate Testable Powerpoint Slides
This is a design experiments formulate testable powerpoint slides. This is a Three stage process. The stages in this process are finance, success, business, marketing.
-
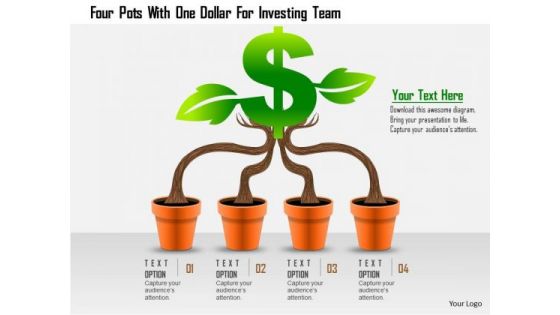
Business Daigram Four Pots With One Dollar For Investing Team Presentation Templets
This diagram contains design of four money plants. This business slide is designed with graphics of dollar plant depicting finance, investment and growth. Download this diagram slide to make finance and business related presentations.
-
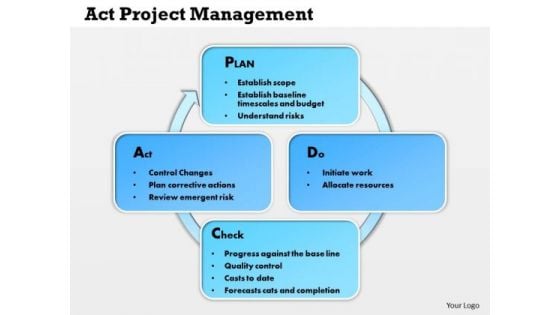
Business Framework Act Project Management PowerPoint Presentation
This act project diagram make your audience understands essential elements of your overall strategy and also shows an organized view of business processes. This unique diagram makes your presentations more professional.
-
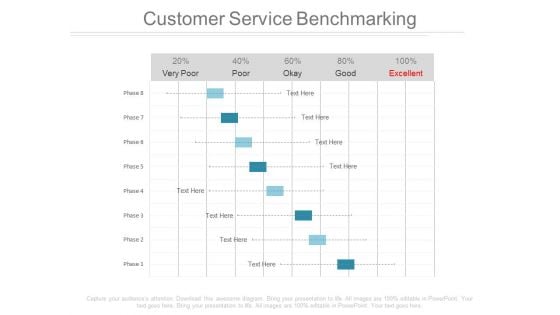
Customer Service Benchmarking Ppt Slides
This is a customer service benchmarking ppt slides. This is a eight stage process. The stages in this process are success, business, marketing.
-
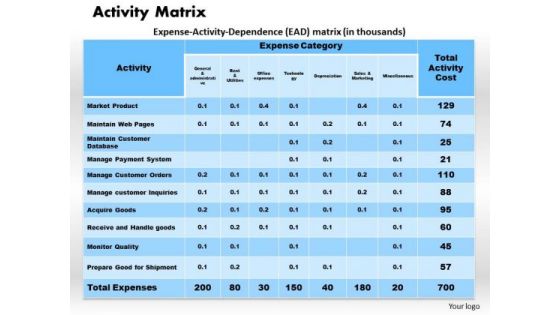
Business Framework Activity Matrix PowerPoint Presentation
This PowerPoint diagram has theme of activity matrix. Streamline the flow of information across the board. This business diagram helps you to grab the attention of your listener.
-
Business Diagram Three Icons Arrow Text Boxes PowerPoint Template
Graphic of three icons and arrow text boxes are used to craft this power point template slide. This PPT contains the concept of business growth. This PPT slide is suitable for business and marketing data flow related presentations.
-
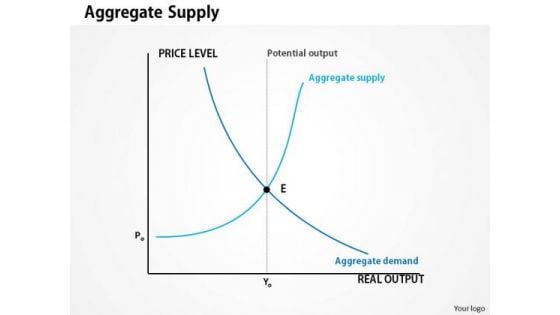
Business Framework Aggregate Supply PowerPoint Presentation
This diagram displays graph of aggregate supply. Aggregate supply is the total value of the goods and services produced. Use this diagram to present information in the visual manner.
-
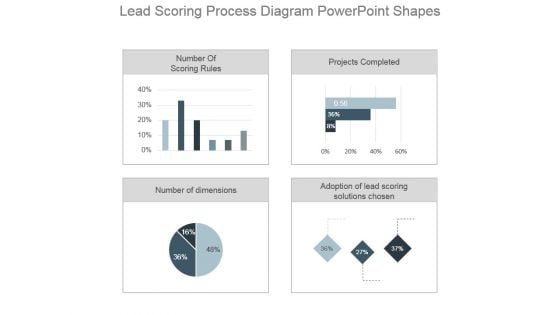
Lead Scoring Process Diagram Powerpoint Shapes
This is a lead scoring process diagram powerpoint shapes. This is a four stage process. The stages in this process are number of scoring rules, projects completed, number of dimensions, adoption of lead scoring solutions chosen.
-
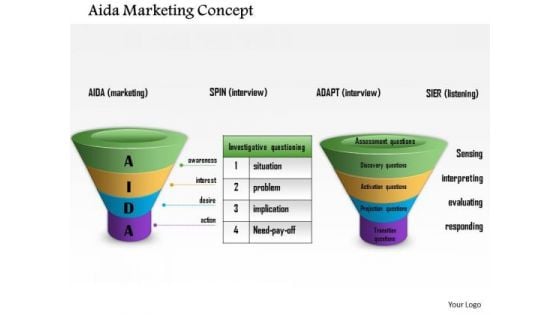
Business Framework Aida Marketing Concept PowerPoint Presentation
Use this graphic to explain Aida marketing concepts. It is an excellent graphic to attract the attention of your audience. Download this AIDA marketing diagram for your business presentations.
-
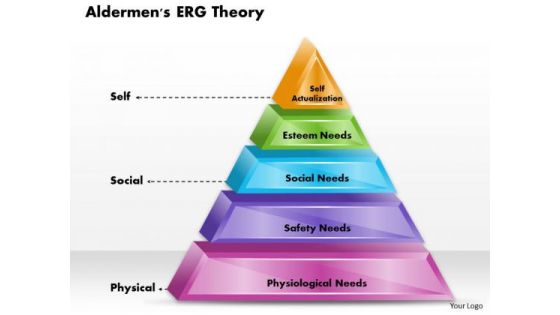
Business Framework Aldermens Erg Theory PowerPoint Presentation
This diagram has been designed with Aldermen erg theory. This diagram displays pyramid diagram, of self actualization, esteem needs, social needs, safety needs and physiological needs. Use this diagram to present information in the visual manner.
-
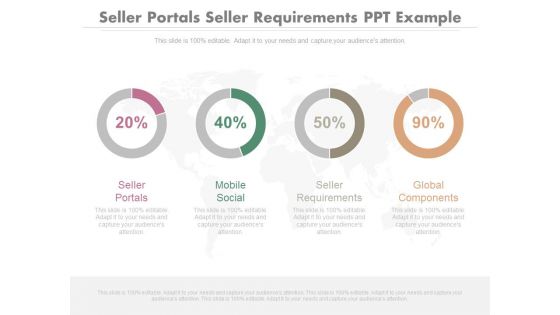
Seller Portals Seller Requirements Ppt Example
This is a seller portals seller requirements ppt example. This is a four stage process. The stages in this process are globe, finance, business, marketing.
-
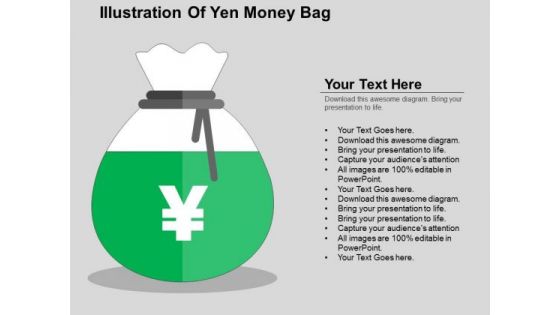
Illustration Of Yen Money Bag PowerPoint Templates
Define your message in convincing manner with this diagram slide. This PPT slide contains graphics of Yen money bag. Download this PPT slide to make finance related presentation.
-
Business Framework Animated Graphics PowerPoint Presentation
This diagram is a simple diagram that provides overview of a continuing sequence of stages, tasks. This is an effective way of displaying information you may edit text, color, shade and style as per you need.
-
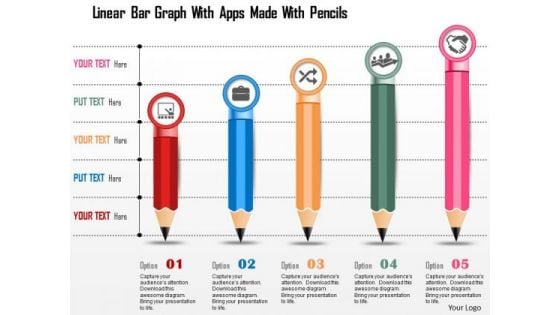
Business Diagram Linear Bar Graph With Apps Made With Pencils Presentation Template
This power point template has been crafted with graphic of linear bar graph and apps made with pencils. This PPT diagram can be used for business growth analysis and result analysis. Use this PPT for business and marketing related presentations.
-
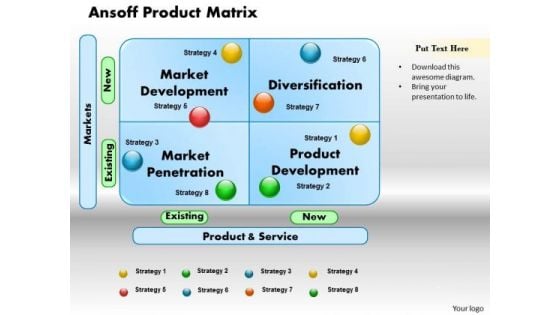
Business Framework Ansoff Product Matrix PowerPoint Presentation
The Ansoff Matrix, designed by Igor Ansoff, classifies and explains different growth strategies for a company. Use this diagram to explain diversification strategies of a new product.
-
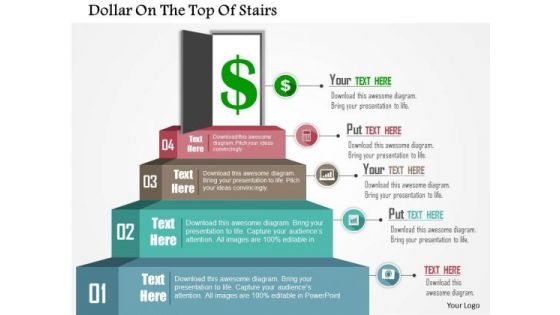
Business Diagram Dollar On The Top Of Stairs Presentation Template
Graphic of dollar on the top of the stairs has been used to craft this power point template. This PPT diagram contains the concept of financial growth. Use this PPT for business and finance related presentations.
-
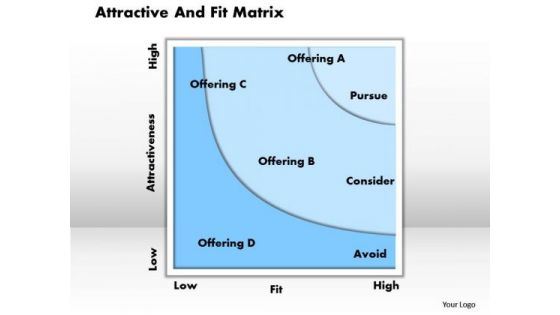
Business Framework Attractive And Fit Matrix PowerPoint Presentation
Walk your team through your plans using our attractive and fit matrix PowerPoint presentation slide template. See their energy levels rise as you show them the way. This diagram is perfect to make professional presentations.
-
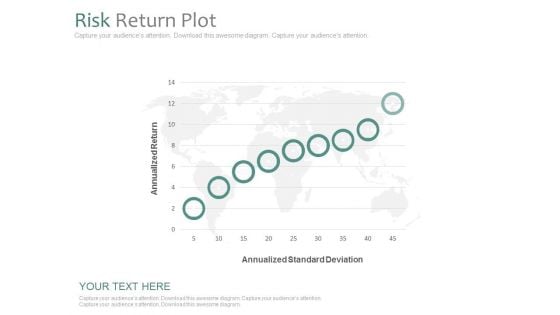
Risk Return Plot Ppt Slides
This is a risk return plot ppt slides. This is a nine stage process. The stages in this process are business, finance, marketing.
-
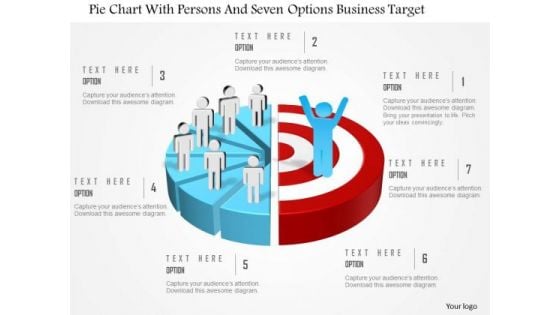
Business Diagram Pie Chart With Persons And Seven Options Business Target Presentation Template
This power point template slide has been crafted with graphic of pie chart ,persons and seven options. This PPT contains the concept of option representation for business targets. This PPT diagram is can be used business and marketing presentations.
-
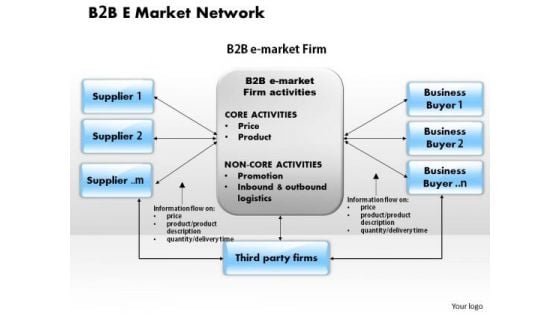
Business Framework B 2 B E Market Network PowerPoint Presentation
This diagram displays b 2 b e market network. Use this diagram in your presentation and make it more effective. This pre designed high quality business diagram will make your presentation simply the best.
-
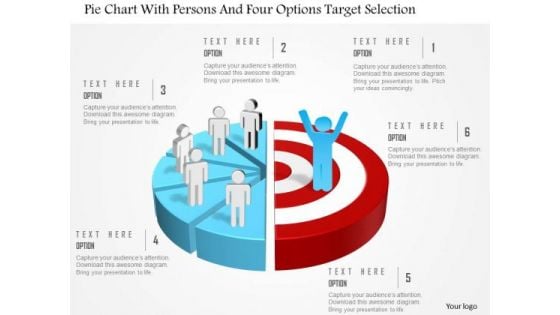
Business Diagram Pie Chart With Persons And Four Options Target Selection Presentation Template
This power point template slide has been crafted with graphic of pie chart ,persons and four options. This PPT contains the concept of option representation for targets selection. This PPT diagram is can be used business and sales presentations.
-
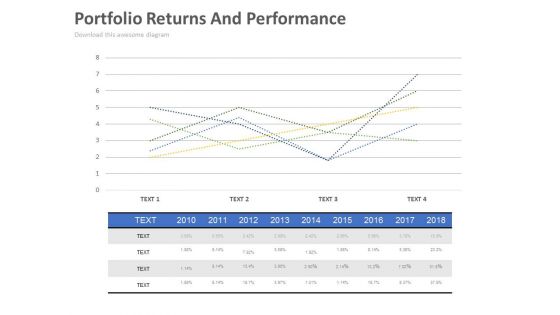
Portfolio Returns And Performance Ppt Slides
This is a portfolio returns and performance ppt slides. This is a five stage process. The stages in this process are business, finance, marketing, time planning.
-
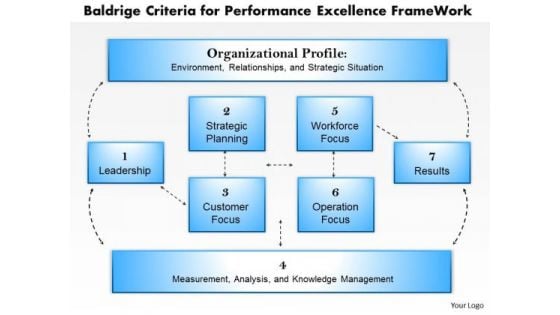
Business Framework Baldrige Criteria For Performance Excellence Frame Work PowerPoint Presentation
This business power point slide has been designed with graphic of performance excellence frame work. This frame work is used to explain baldrige criteria. This framework is usable for various business criteria. Use this diagram slide and build quality presentation for your viewers.
-
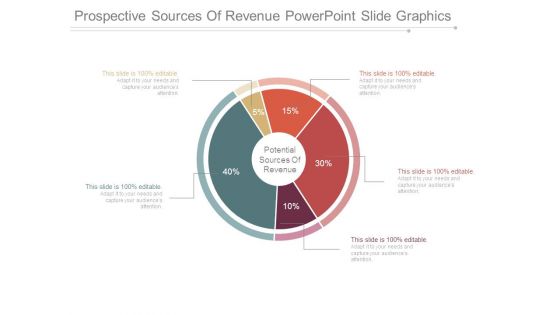
Prospective Sources Of Revenue Powerpoint Slide Graphics
This is a prospective sources of revenue powerpoint slide graphics. This is a five stage process. The stages in this process are potential sources of revenue.
-
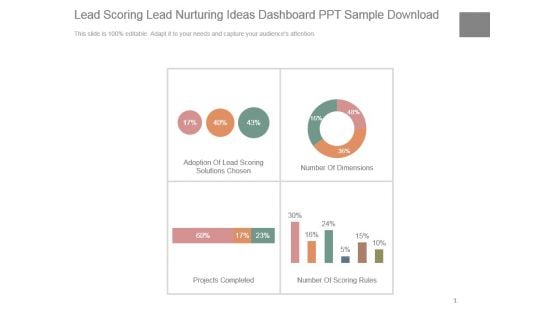
Lead Scoring Lead Nurturing Ideas Dashboard Ppt Sample Download
This is a lead scoring lead nurturing ideas dashboard ppt sample download. This is a four stage process. The stages in this process are adoption of lead scoring solutions chosen, number of dimensions, projects completed, number of scoring rules.
-
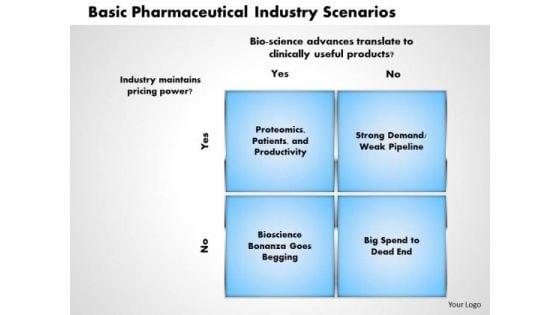
Business Framework Basic Pharmaceutical Industry Scenarios PowerPoint Presentation
Define the scenarios of any pharmaceutical industry with this power point diagram slide. We have used graphic of blue colored square with four sections. Each sections can be used to show different scenario. Use this diagram slide for pharma company related scenario and presentations based on those scenarios.
-
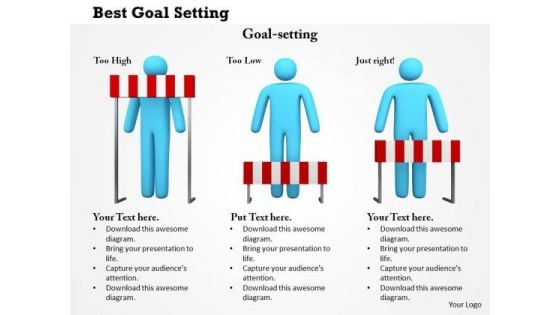
Business Framework Best Goal Setting PowerPoint Presentation
Define best goal setting process with this power point diagram template. To display goal setting we have used graphic of three 3d men with hurdles. Each man holding different position of hurdles to show goals. Use this diagram for business and finance related presentation to display goals.
-
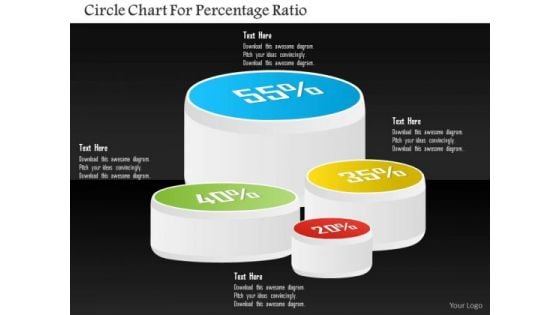
Business Diagram Circle Chart For Percentage Ratio Presentation Template
Four staged circular chart has been used to craft this PPT diagram. This PPT contains the concept of result analysis. Use this PPT in your business and sales presentation and display any kind of result analysis in a graphical way.
-
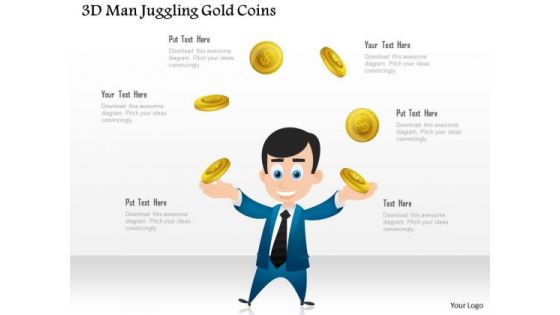
Business Diagram 3d Man Juggling Gold Coins Presentation Template
In this power point template we have displayed concept of juggling. To show this concept we have used graphic of 3d man and gold coins. Use this diagram PPT for your finance and business elated presentation.
-
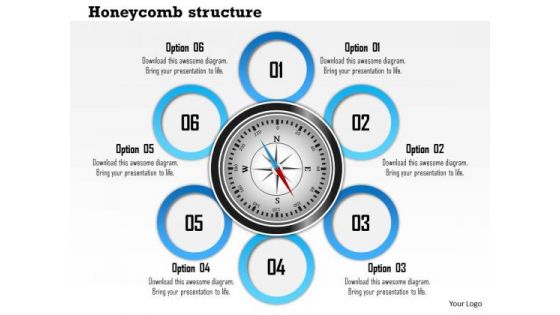
Business Diagram Six Staged Honey Comb Structure Diagram Presentation Template
This Power Point template slide has been designed with graphic of 3d compass and six text circles around it. Display any six levels of data with this exclusive diagram and get good remarks. Give professional appearance to your presentations using this business slide.
-
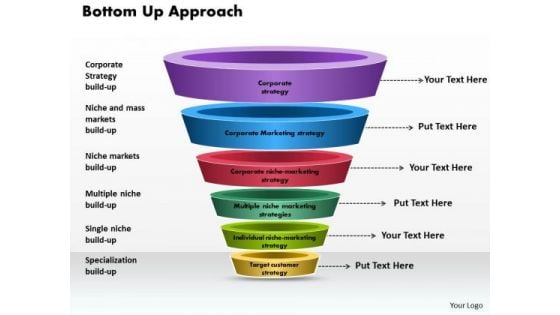
Business Framework Bottom Up Approach PowerPoint Presentation
This power point diagram slide has been crafted with bottom up approach. In this diagram, we have used multilevel funnel diagram with individual state. Use this diagram for your financial presentations and display bottom up approach in an graphical manner.
-
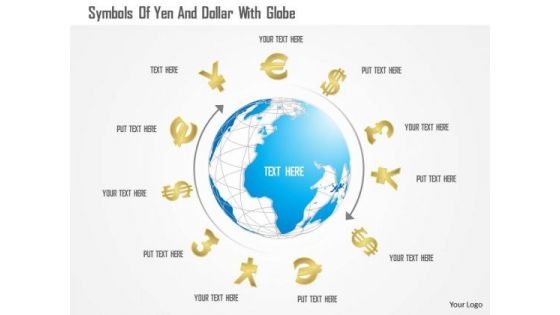
Business Diagram Symbols Of Yen And Dollar With Globe Presentation Template
Symbols of Yen and dollar around globe have been used in this business diagram. This slide is helpful to represent topics like global economy and business. Display your strategy in your presentation with this exclusive diagram.
-
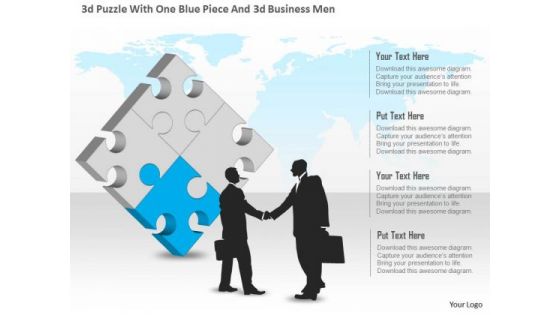
Business Diagram 3d Puzzle With One Blue Piece And 3d Business Men Presentation Template
This business slide displays two business men shaking hands with puzzle in background. This slide helps to depict successful business deal. Download our above diagram to express information in a visual way.
-
Business Diagram 3d Business Team For Marketing Strategy Presentation Template
This business diagram has been designed with graphic of 3d business people. This slide depicts business team and meeting. Download this diagram slide to make professional presentations.
-
Business Diagram 3d Business People In Meeting For Business Presentation Template
This business diagram has been designed with graphic of 3d business people. This slide depicts business team and meeting. Download this diagram slide to make professional presentations.
-
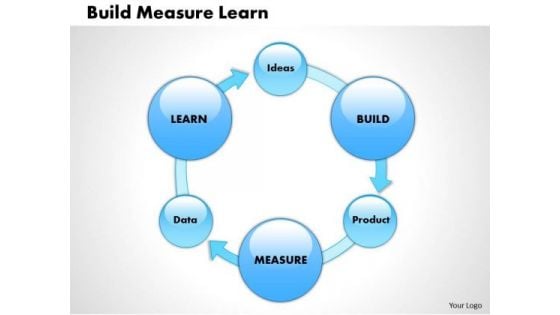
Business Framework Build Measure Learn PowerPoint Presentation
This business power point diagram slide has been designed with build measure learn. This is used in lean manufacturing system where you have to show continuous deployment and minimal viable production. Use this PPT slide in your production related presentations.
-
Financial Expectations Market Share Ppt Example
This is a financial expectations market share ppt example. This is a four stage process. The stages in this process are finance, computer, technology.
-
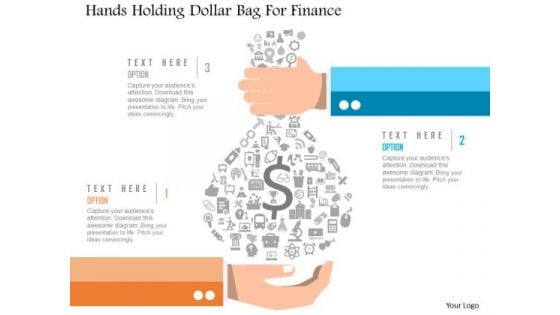
Business Diagram Hands Holding Dollar Bag For Finance Presentation Template
Our above slide displays hands holding dollar bag for finance. Download our above diagram to express information in a visual way. This diagram offers a way for your audience to visually conceptualize the process.
-
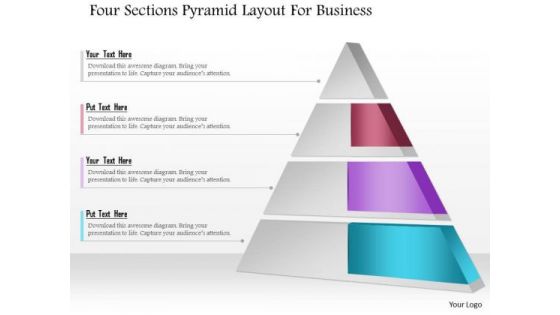
Business Diagram Four Sections Pyramid Layout For Business Presentation Template
Our above slide displays four sections pyramid layout. It helps to depict workflow or a process. This diagram offers a way for your audience to visually conceptualize the process.
-
Business Diagram Five Staged Business Process Diagram With Icons Presentation Template
Our above slide displays five staged business process diagram. Download our above diagram to express information in a visual way. Use this diagram and get good comments for data related presentations.
-
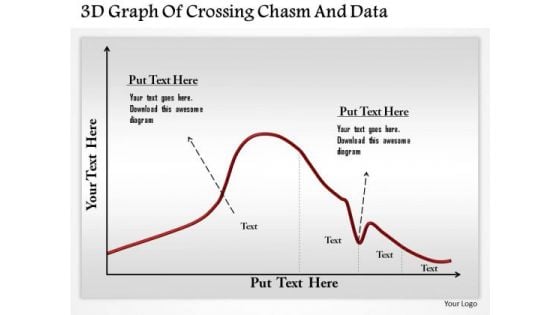
Business Diagram 3d Graph Of Crossing Chasm And Data Presentation Template
This business diagram has been designed with graphic of 3d graph. This slide contains the concept of chasm and data calculation. Use this slide to display chasm crossing condition. This business diagram adds value to your ideas.
-
Stock Photo Two Piggy Banks With Yellow Umbrellas PowerPoint Slide
This image slide displays two blue piggy banks with yellow color umbrella. This image slide may be used in your presentations to express views on finance, savings, protection and accounting business finance. Create wonderful presentations using this image slide.
-
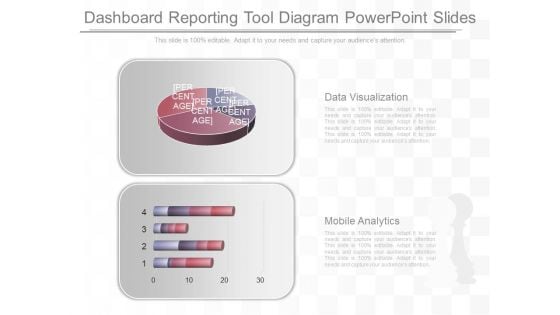
Dashboard Reporting Tool Diagram Powerpoint Slides
This is a dashboard reporting tool diagram powerpoint slides. This is a two stage process. The stages in this process are data visualization, mobile analytics.
-
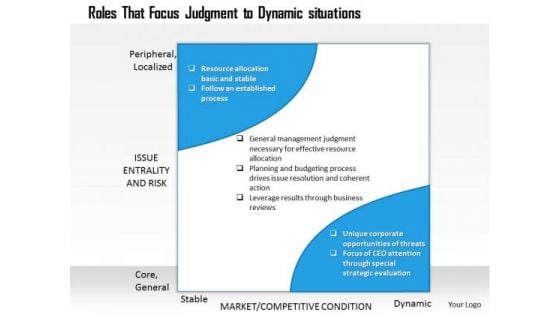
Business Framework Dynamic Situations PowerPoint Presentation
This beautiful image slide has been designed to display roles that focus judgment to dynamic situations in your presentations. This image slide may used to express views on business plan outline. You may change color, size and orientation of any icon to your liking. Create professional presentations using this image slide.
-
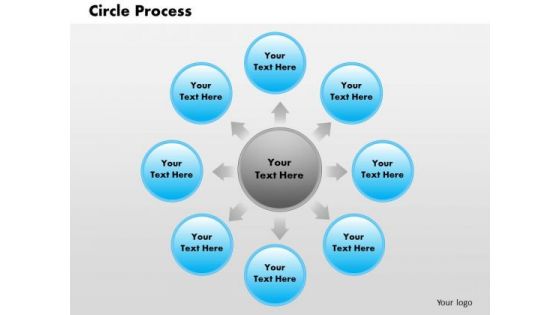
Business Framework Circle Process PowerPoint Presentation
A five staged multicolored circular process chart has been used to decorate this PPT. this business framework PPT is usable for various process flow with multiple levels. Use this PPT in your presentation and get good comments from viewers.
-
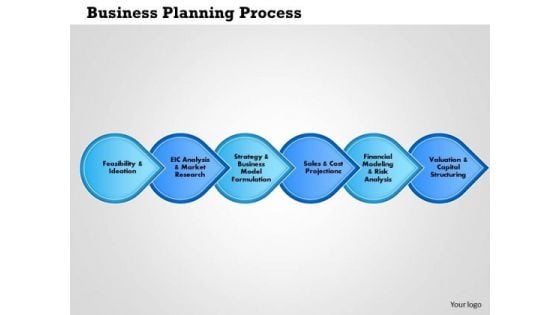
Business Framework Business Planning Process PowerPoint Presentation
a six staged linear processing diagram has been used in this power point slide. Use this Pot slide for business planning related topics. Add this planning process diagram in your business and marketing research related presentations.
-
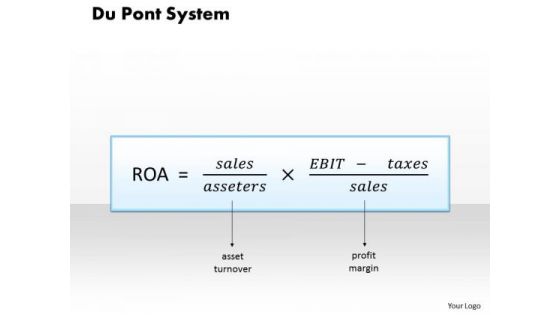
Business Framework Du Pont System PowerPoint Presentation
This beautiful image slide has been designed to display calculation formula for DuPont schema in your presentations. This image slide may be used in business and marketing presentations. You may change color, size and orientation of any icon to your liking. Create professional presentations using this image slide.
-
Business Framework Du Pont Schema PowerPoint Presentation
This beautiful image slide has been designed to display DuPont schema flow chart process in your presentations. This image slide may be used in business and marketing presentations. You may change color, size and orientation of any icon to your liking. Create professional presentations using this image slide.
-
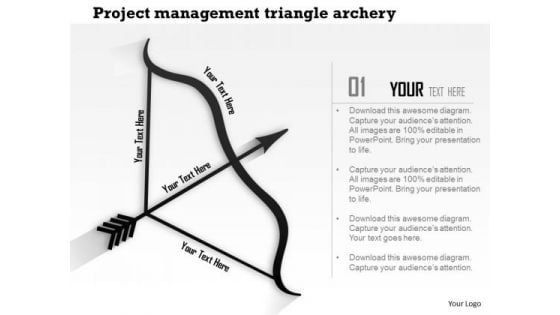
Business Framework Project Management Triangle Archery PowerPoint Presentation
This business diagram displays framework for project management triangle. It contains graphic of bow and arrow. This editable diagram can be used to exhibit project management. Use this business slide to build an exclusive presentations for your viewers.
-
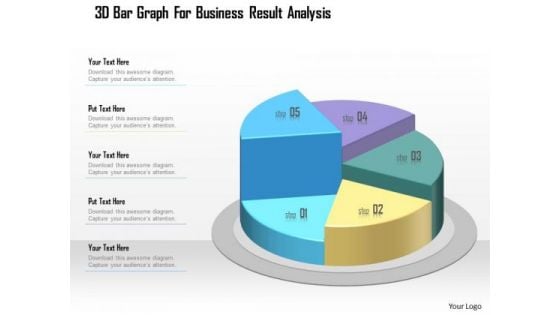
Business Diagram 3d Bar Graph For Business Result Analysis Presentation Template
This business slide displays five staged pie chart. This diagram is a data visualization tool that gives you a simple way to present statistical information. This slide helps your audience examine and interpret the data you present.
-
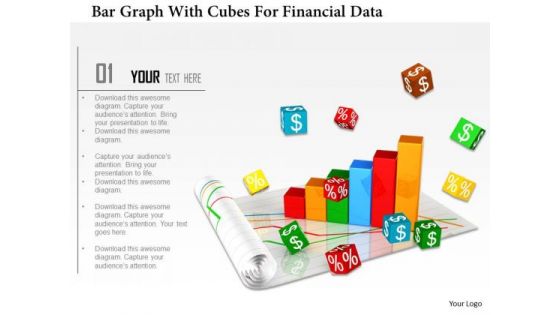
Stock Photo Bar Graph With Cubes For Financial Data PowerPoint Slide
Graphic of bar graph and cubes are used to decorate this image template. This PPT contains the concept of financial data analysis. Use this PPT for finance and business related presentations.
-
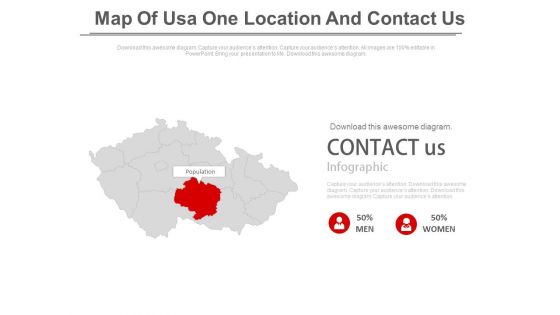
Map Of Usa With Contact Us Text Powerpoint Slides
This PowerPoint template has been designed with USA Map and contact us text. You may use this slide to display contact details and location. This diagram provides an effective way of displaying information you can edit text, color, shade and style as per you need.
-
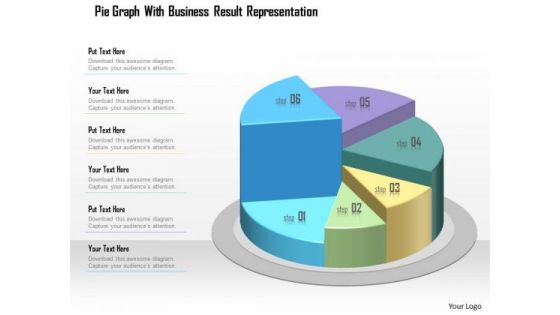
Business Diagram Pie Graph With Business Result Representation Presentation Template
This business diagram displays graphic of pie chart. This business slide contains the concept of business data representation. Use this diagram to build professional presentation for your viewers.
-
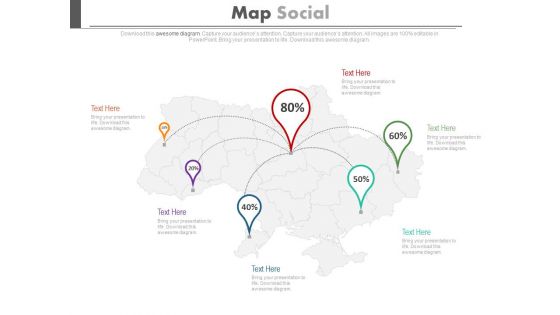
Map With Location Pointers And Percentage Ratios Powerpoint Slides
This PowerPoint map template has been carefully created by our professional team to display location and other geographic details. Each and every property of any region - color, size, shading etc can be modified to help you build an effective PowerPoint presentation. Use this map diagram to display sales territories, business and new office locations, travel planning etc.
-
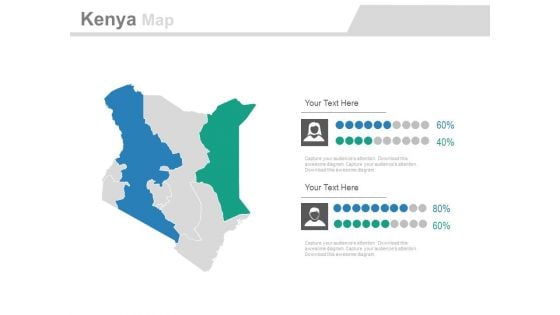
Map Of Kenya With Gender Population Analysis Powerpoint Slides
This PowerPoint map template has been designed with map of Kenya and male female icons. Use these maps to display gender population analysis in your presentations. Any text can be entered at any point in the PowerPoint map slide.
-
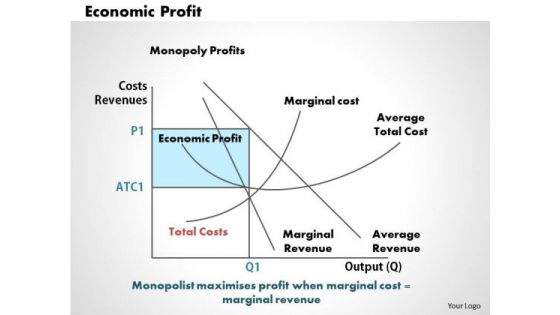
Business Framework Economic Profit PowerPoint Presentation
This image slide displays business framework for economic profit. This image slide may be used in your presentations to depict analysis in marketing profits and accounting business management. You may change color, size and orientation of any icon to your liking. Create wonderful presentations using this image slide.
-
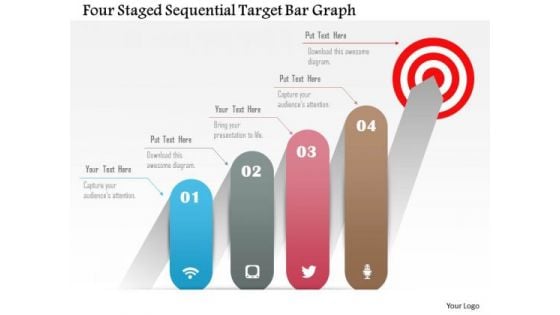
Business Diagram Four Staged Sequential Target Bar Graph Presentation Template
This business diagram has been designed with graphic of four steps towards target achievement. Use this diagram, in your presentations to express views on strategies, policies, success, achievements and opportunities. Create professional presentations using this diagram slide.
-
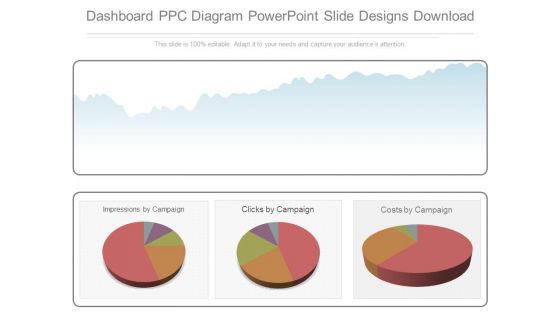
Dashboard Ppc Diagram Powerpoint Slide Designs Download
This is a dashboard ppc diagram powerpoint slide designs download. This is a three stage process. The stages in this process are impressions by campaign, clicks by campaign, costs by campaign.
-
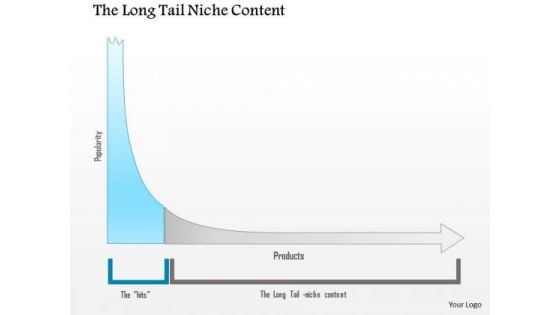
Business Framework Long Tail Niche Content PowerPoint Presentation
This business diagram displays framework for long tail niche content. This slide contains design of graph. This graph contains the long tail niche content. Use this PPT and build professional presentations for your viewers.
-
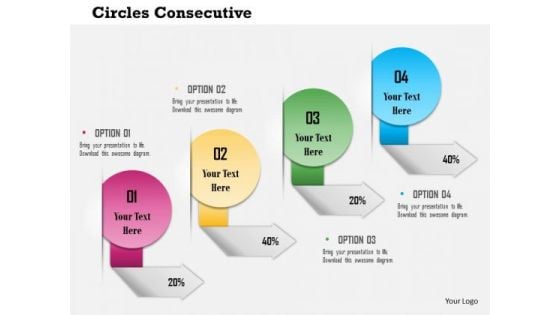
Business Diagram Circles With Ribbons For Linear Process Flow Presentation Template
This business diagram contains the graphic of circles and ribbons. Download this diagram to deepict process flow in any presentation. Present your views using this innovative slide and be assured of leaving a lasting impression.
-
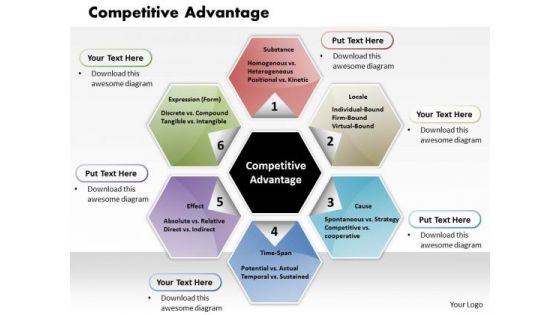
Business Framework Competitive Advantage PowerPoint Presentation
This image slide displays competitive advantage in business. This image slide has been crafted to depict different business strategies. Use this image slide, in your presentations to express views on strategic management models template. This image slide will enhance the quality of your presentations.
-
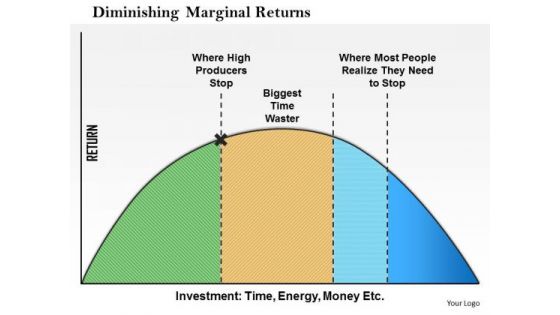
Business Framework Diminishing Marginal Returns PowerPoint Presentation
This image slide displays business framework for diminishing marginal returns. This image slide may be used in your presentations to depict business planning and market analysis. You may change color, size and orientation of any icon to your liking. Create wonderful presentations using this image slide.
-
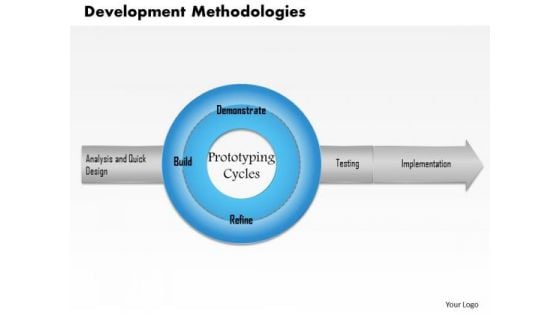
Business Framework Development Methodologies PowerPoint Presentation
This image slide displays business framework for development methodologies. This image slide may be used in your presentations to express views on business, marketing, research and analysis. You may change color, size and orientation of any icon to your liking. Create professional presentations using this image slide.
-
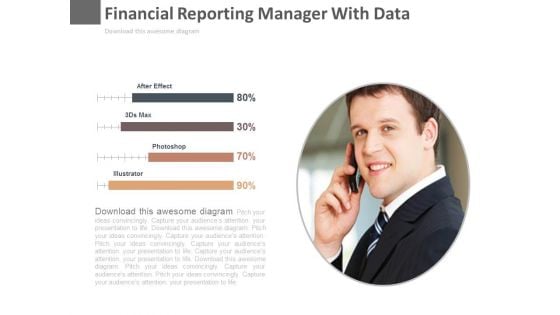
Financial Reporting Manager With Data Powerpoint Slides
This PowerPoint template has been designed with graphics of finance manager and percentage data. This diagram is useful to exhibit financial management. This diagram slide can be used to make impressive presentations.
-
Build Dashboard For Business Diagram Powerpoint Show
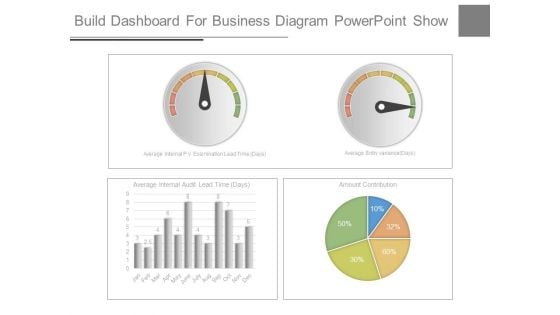
This is a build dashboard for business diagram powerpoint show. This is a four stage process. The stages in this process are average internal pv examination lead time, average entry variance, average internal audit lead time, amount contribution.
-
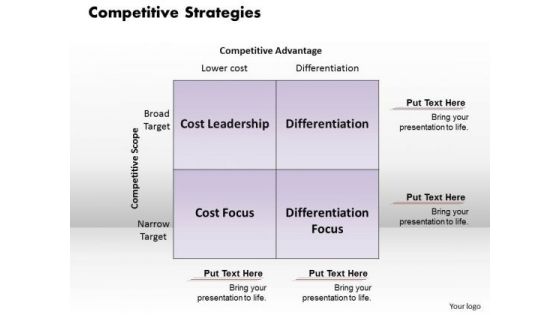
Business Framework Competitive Strategies PowerPoint Presentation
This image slide displays business framework template of competitive strategies. This image slide has been crafted to depict strategic plan management. Use this image slide, in your presentations to express views on business strategic planning process. This image slide will enhance the quality of your presentations.
-
Measure Investment Risk In Portfolio Powerpoint Slide
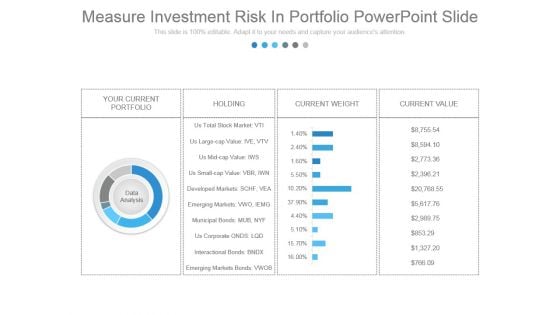
This is a measure investment risk in portfolio powerpoint slide. This is a four stage process. The stages in this process are your current portfolio, holding, current weight, current value, data analysis, us total stock market vti, us large cap value ive vtv, us mid cap value iws, us small cap value vbr iwn, developed markets schf, vea, emerging markets vwo, iemg, municipal bonds mub, nyf, us corporate onds lqd, interactional bonds bndx, emerging markets bonds vwob.
-
Business Framework Compound Interest PowerPoint Presentation
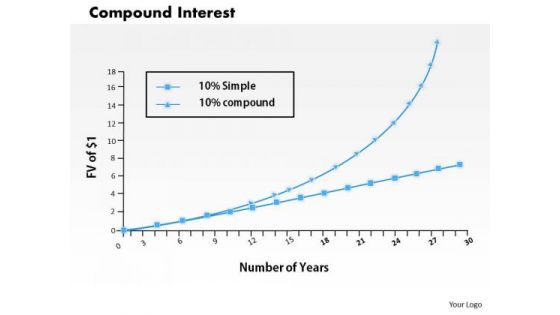
This business framework template displays compound interest graph. This image slide has been crafted to depict financial ratio analysis. Use this image slide, in your presentations to express views on business and marketing management. This image slide will enhance the quality of your presentations.
-
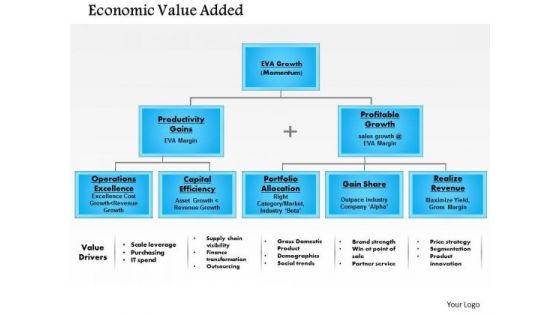
Business Framework Economic Value Add 2 PowerPoint Presentation
This image slide displays business framework for economic value added diagram. This image slide may be used in your presentations to depict firms economic profits and business financial reports. You may change color, size and orientation of any icon to your liking. Create professional presentations using this image slide.
-
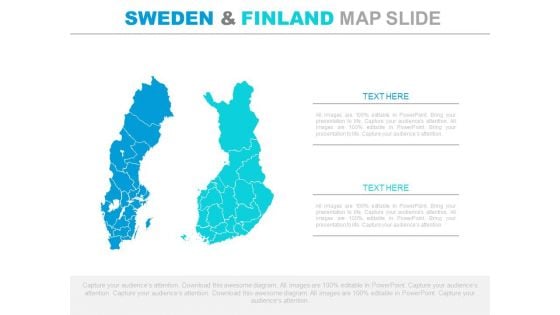
Sweden And Finland Map For Business Analysis Powerpoint Slides
This PowerPoint template has been designed with Sweden and Finland map. Each and every property of any region - color, size, shading etc can be modified to help you build an effective PowerPoint presentation. Use these maps to show sales territories, business and new office locations, travel planning etc in your presentations.
-
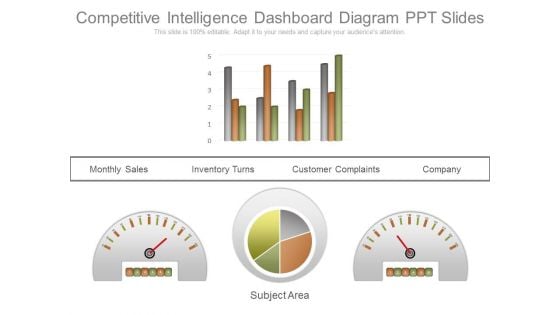
Competitive Intelligence Dashboard Diagram Ppt Slides
This is a competitive intelligence dashboard diagram ppt slides. This is a four stage process. The stages in this process are monthly sales, inventory turns, customer complaints, company, subject area.
-
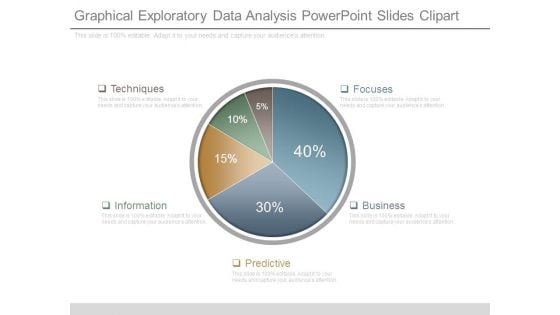
Graphical Exploratory Data Analysis Powerpoint Slides Clipart
This is a graphical exploratory data analysis powerpoint slides clipart. This is a five stage process. The stages in this process are techniques, information, predictive, focuses, business.
-
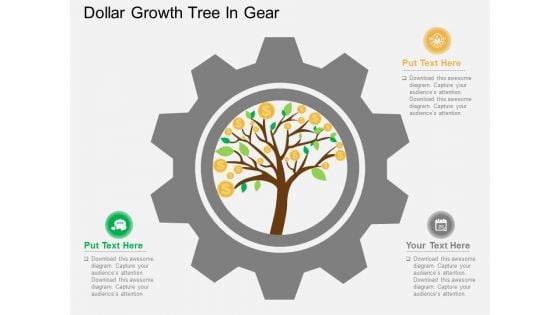
Dollar Growth Tree In Gear Powerpoint Templates
This PowerPoint slide has been designed with dollar growth tree. This diagram is designed to display financial growth planning. This professional slide helps in making an instant impact on viewers.
-
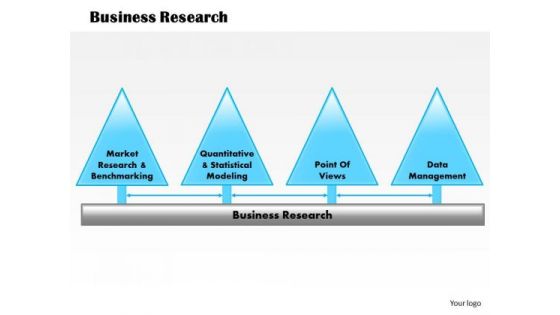
Business Framework Business Research PowerPoint Presentation
Define the concept of business research in any business presentation with this unique PPT slide. This business framework slide contains the graphic of four triangle research boxes on a single flow pipeline. This PPT slide is useful for business and strategic information systems planning related presentation.
-
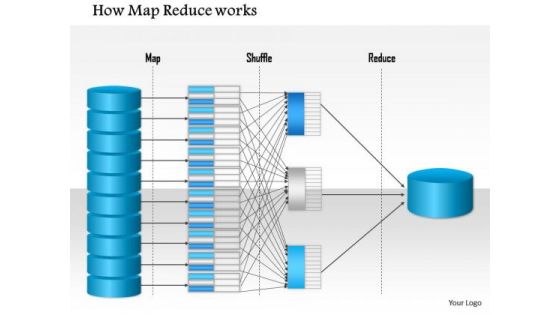
Business Framework How Map Reduce Works PowerPoint Presentation
This business diagram displays framework for how map reduce works. This contains the graphic of map build with flow chart. Use editable diagram for your business presentations to get good comments from your viewers.
-
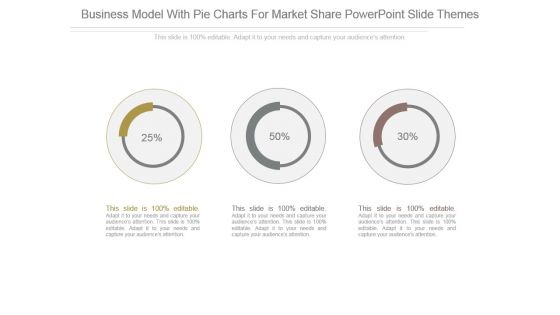
Business Model With Pie Charts For Market Share Powerpoint Slide Themes
This is a business model with pie charts for market share powerpoint slide themes. This is a three stage process. The stages in this process are management, marketing, pie chart, business, finance.
-
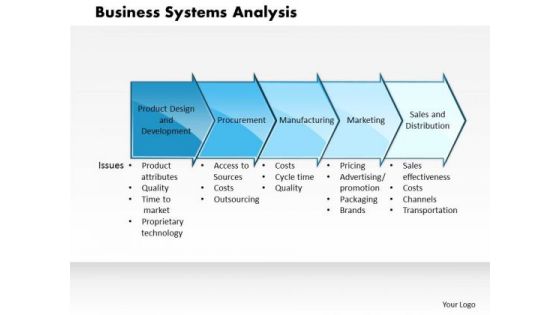
Business Framework Business Systems Analysis PowerPoint Presentation
This Power Point diagram slide has been crafted with unidirectional text box arrow diagram. This diagram slide is specially designed for business system analysis. Display analysis for any business process by using this innovative business PPT in your presentation.
-
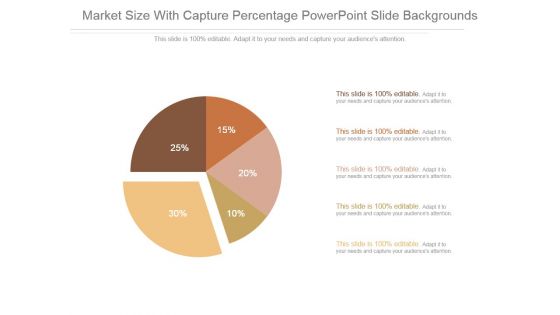
Market Size With Capture Percentage Powerpoint Slide Backgrounds
This is a market size with capture percentage powerpoint slide backgrounds. This is a five stage process. The stages in this process are finance, pie chart, business, marketing, management.
-
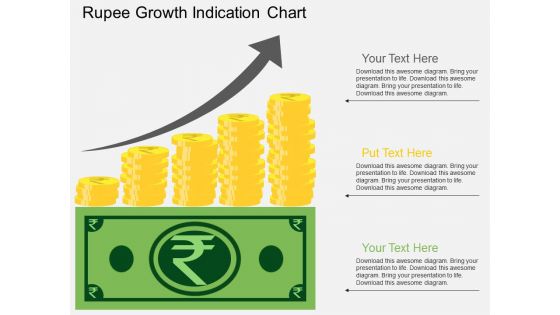
Rupee Growth Indication Chart Powerpoint Template
This business diagram displays rupee growth chart. This business diagram has been designed to implement strategic plan. Use this diagram to depict financial planning process in your presentations.
-
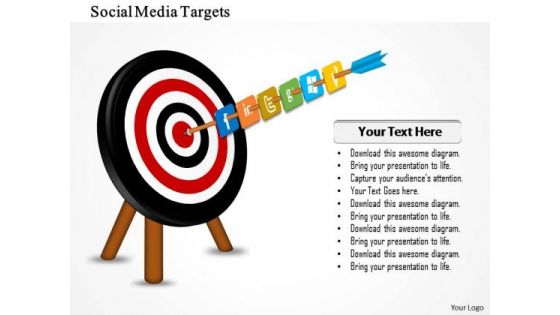
Business Framework Social Media Targets PowerPoint Presentation
This business diagram has been designed with graphic of target board and arrow with social media apps. Use this diagram to display your social media targets. Use this editable diagram for business and technology related presentations.
-
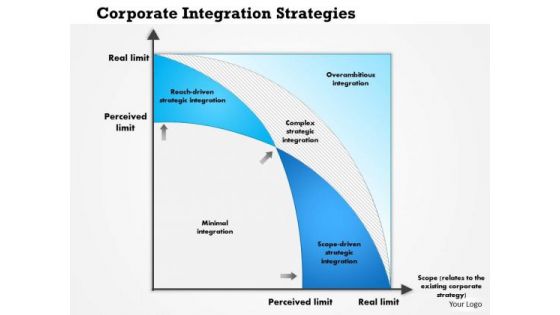
Business Framework Corporate Integration Strategies PowerPoint Presentation
This innovative image slide has been designed to display graph for corporate integration strategies. This business framework template may be used to display corporate strategy management in your presentations. This image slide will enhance the quality of your presentations.
-
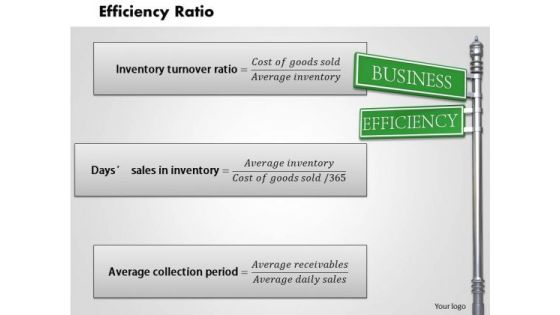
Business Framework Efficiency Ratio PowerPoint Presentation 1
This image slide has been designed to depict efficiency ratio. This image slide displays formulas to calculate average collection period, days sales in inventory, inventory turnover ratio. This image slide may be used to exhibit business marketing analysis in your presentations. This image slide will give edge to your presentations.
-
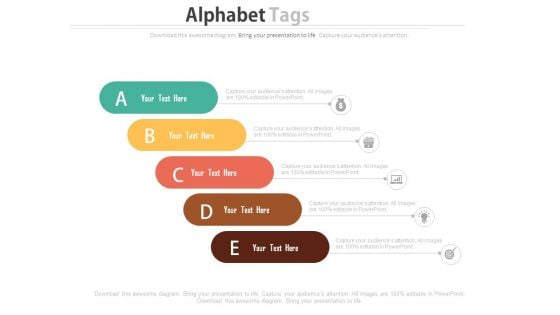
Alphabet Steps For Financial Strategy Analysis Powerpoint Slides
This PowerPoint template has been designed with alphabet steps with icons. This PPT slide may be used to display financial strategy analysis. Make outstanding business presentation with this template.
-
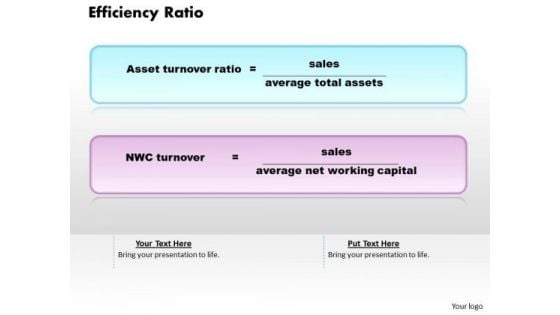
Business Framework Efficiency Ratio PowerPoint Presentation
This image slide has been designed to depict efficiency ratio. This image slide displays formulas to calculate asset turnover ratio and NWC ratio. This image slide may be used to exhibit business marketing analysis in your presentations. This image slide will give edge to your presentations.
-
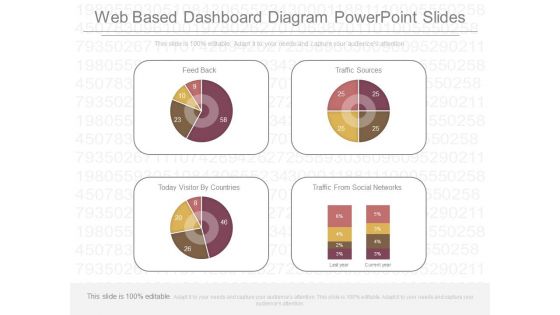
Web Based Dashboard Diagram Powerpoint Slides
This is a web based dashboard diagram powerpoint slides. This is a four stage process. The stages in this process are feed back, traffic sources, today visitor by countries, traffic from social networks.
-
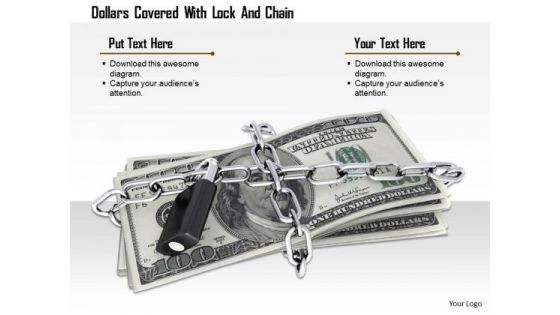
Stock Photo Dollars Covered With Lock And Chain PowerPoint Slide
This Power Point image template has been designed with graphic of dollar and chain. In this image dollar is covered with chain which shows the concept of safety. Use this image template financial security related presentations.
-
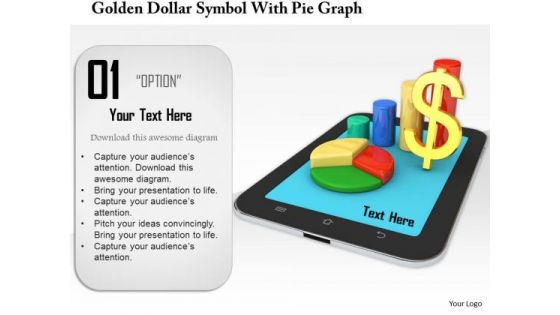
Stock Photo Golden Dollar Symbol With Pie Graph PowerPoint Slide
This Power Point template has been crafted with graphic of golden dollar symbol and pie chart on a tablet. Display the concept of financial data analysis with this image. Use this image to present financial reports in business presentations.
-
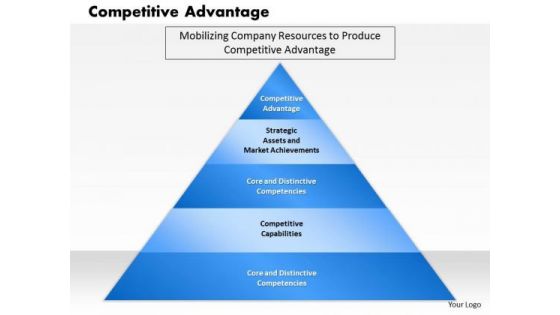
Business Framework Competitive Advantage PowerPoint Presentation 2
This image slide displays business framework for competitive advantage. Use this image slide to express views on company resources to produce competitive advantage. You may change color size and orientation of any icon to your liking. This image slide will enhance the quality of presentations.
-
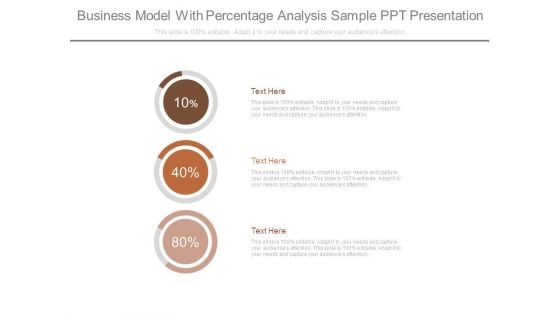
Business Model With Percentage Analysis Sample Ppt Presentation
This is a business model with percentage analysis sample ppt presentation. This is a three stage process. The stages in this process are business, success, strategy, finance, marketing.
-
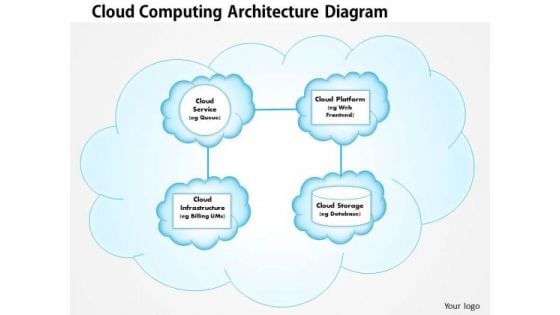
Business Framework Cloud Computing Architecture PowerPoint Presentation
Explain the details of cloud computing in any technical presentation by using this exclusive power point diagram slide. To display concept of cloud computing we have used graphic of cloud computing architecture. Make a good quality technical presentation for your viewers with this unique PPT slide.
-
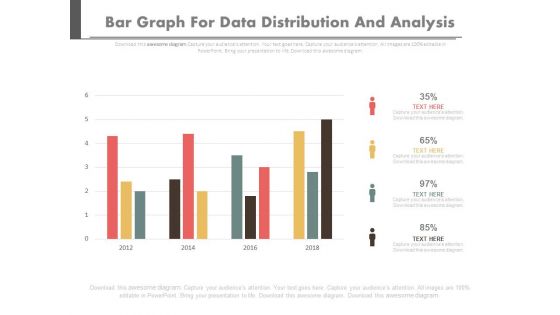
Bar Graph For Data Distribution And Analysis Powerpoint Slides
This PowerPoint template has been designed with bar graph. This PowerPoint diagram is useful for data distribution and analysis This diagram slide can be used to make impressive presentations.
-
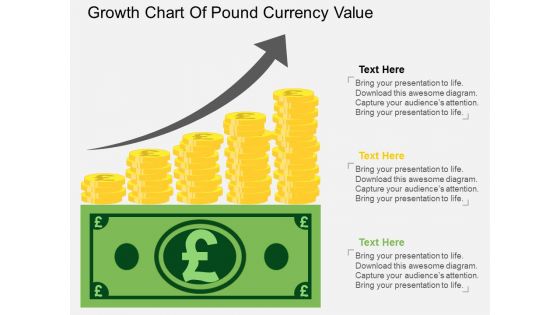
Growth Chart Of Pound Currency Value Powerpoint Template
The above PPT template displays growth chart of Pound currency. This diagram helps to exhibit Pound currency value growth. Adjust the above diagram in your business presentations to visually support your content.
-
Bar Chart For Strategic Planning Powerpoint Slides
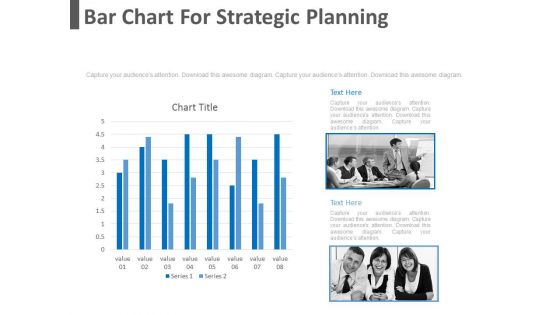
This PowerPoint template has been designed with bar graph with two teams. This diagram is useful to exhibit strategic planning. This diagram slide can be used to make impressive presentations.
-
Dashboard Design And Development For Travel Diagram Background
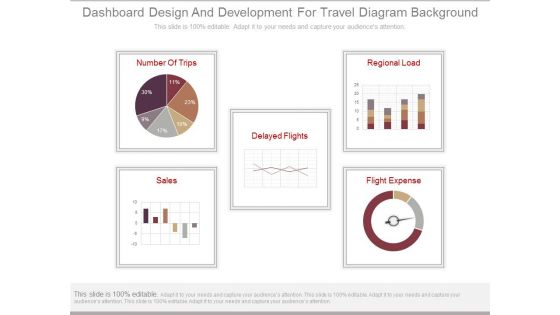
This is a dashboard design and development for travel diagram background. This is a five stage process. The stages in this process are number of trips, sales, delayed flights, regional load, flight expense.
-
Business Framework Economies Of Large Scale PowerPoint Presentation
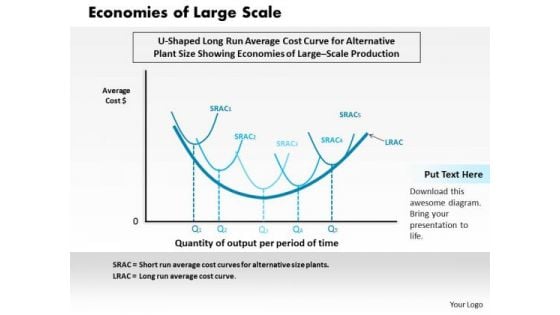
This image slide displays business framework for economies of large scale. This image slide may be used in your presentations to depict cost advantage for large scale firms and business financial reports. You may change color, size and orientation of any icon to your liking. Create professional presentations using this image slide.
-
Three Years Sales Data Bar Graph Powerpoint Slides
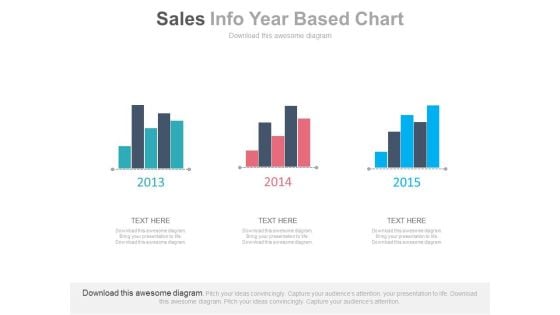
This PowerPoint template has been designed with bar charts. This business slide may be used to display three years sales data for comparison. Present your views and ideas with this impressive design.
-
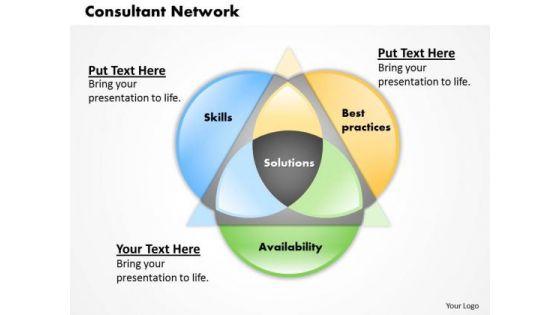
Business Framework Consultant Network PowerPoint Presentation
This business framework template displays consultant network. This image slide has been crafted to depict strategic planning. Use this image slide, in your presentations to express views on marketing, technology and business. This image slide will help you make outstanding presentations.
-
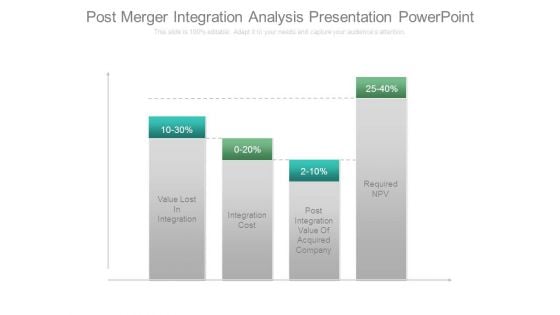
Post Merger Integration Analysis Presentation Powerpoint
This is a post merger integration analysis presentation powerpoint. This is a four stage process. The stages in this process are value lost in integration, integration cost, post integration value of acquired company, required npv.
-
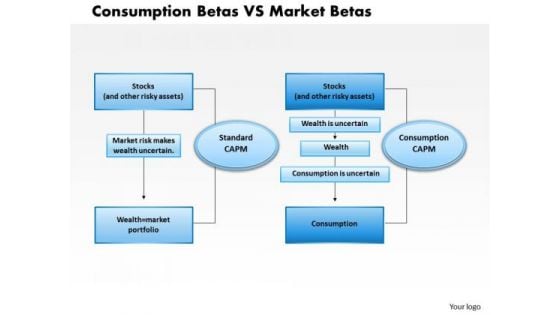
Business Framework Consumption Betas Vs Market Betas PowerPoint Presentation
This business framework displays consumption beta Vs. market beta. This image slide has been crafted to depict concept of risk and return in business. Use this image slide, in your presentations to express views on economics and statistics of business. This image slide will enhance the quality of your presentations.
-
Business Framework Battery Charge Loading Bar PowerPoint Presentation
This business diagram displays bar graph of five battery cells. This business slide contains the concept of business growth shown in multiple levels. Use this diagram to present and compare data in an impressive manner.
-
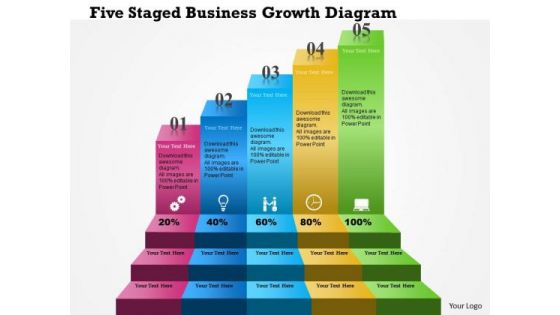
Business Diagram Five Staged Business Growth Diagram Presentation Template
Five staged linear info graphics has been used to design this business diagram. Download this diagram to depict business growth steps. Download this diagram slide to make professional presentations.
-
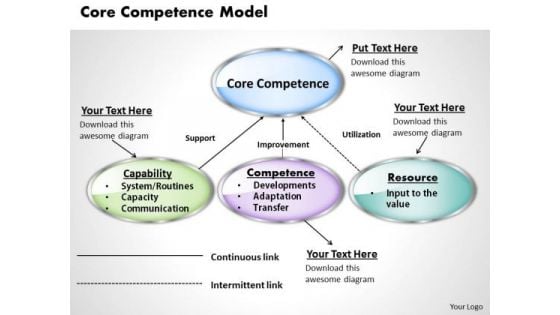
Business Framework Core Competence Model PowerPoint Presentation
This innovative image slide has been designed to display core competence model. This image slide may be used to express views on business and marketing management in your presentations. Give edge to your presentations using this image slide.
-
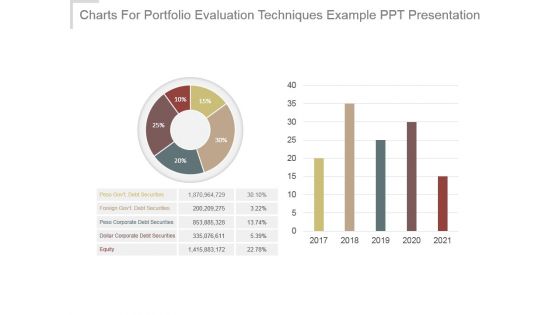
Charts For Portfolio Evaluation Techniques Example Ppt Presentation
This is a charts for portfolio evaluation techniques example ppt presentation. This is a five stage process. The stages in this process are peso govt debt securities, foreign govt debt securities, peso corporate debt securities, dollar corporate debt securities, equity.

 Home
Home 


