Finance PowerPoint Themes
-

Team Efforts Business PowerPoint Templates And PowerPoint Backgrounds 0811
Microsoft PowerPoint Template and Background with people pushing four jigsaw puzzle pieces
-
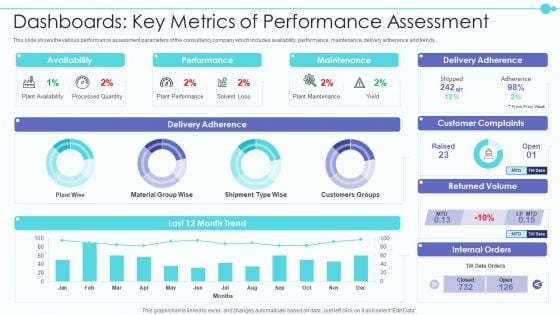
Business Model Of New Consultancy Firm Dashboards Key Metrics Of Performance Assessment Designs PDF
This slide shows the various performance assessment parameters of the consultancy company which includes availability, performance, maintenance, delivery adherence and trends. Deliver an awe inspiring pitch with this creative business model of new consultancy firm dashboards key metrics of performance assessment designs pdf bundle. Topics like availability, performance, maintenance, delivery adherence can be discussed with this completely editable template. It is available for immediate download depending on the needs and requirements of the user.
-

Questionnaire PowerPoint Template
Question mark
-

Marketing Flow Chart PowerPoint Template
Chasing The Markets
-
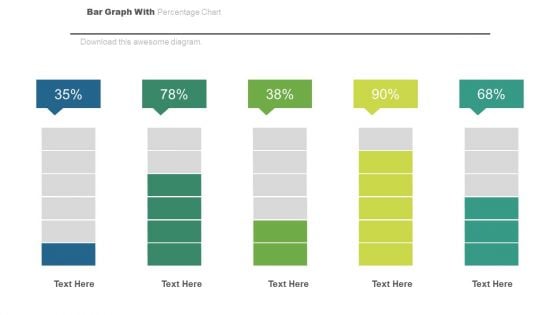
Bar Graph For Statistical Analysis Powerpoint Slides
This PowerPoint template has been designed with bar chart and percentage values. You may download this PPT slide to depict statistical analysis. Add this slide to your presentation and impress your superiors.
-
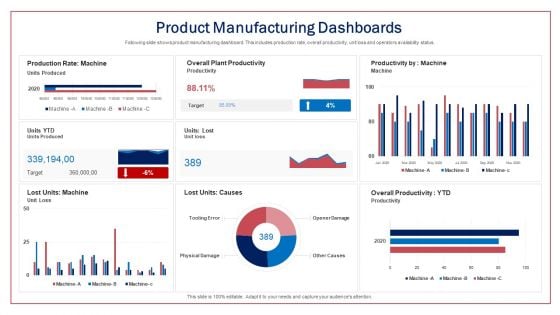
Product Manufacturing Dashboards Ppt Icon Inspiration PDF
Following slide shows product manufacturing dashboard. This includes production rate, overall productivity, unit loss and operators availability status.Deliver and pitch your topic in the best possible manner with this product manufacturing dashboards ppt icon inspiration pdf. Use them to share invaluable insights on overall plant productivity, overall productivity, productivity and impress your audience. This template can be altered and modified as per your expectations. So, grab it now.
-
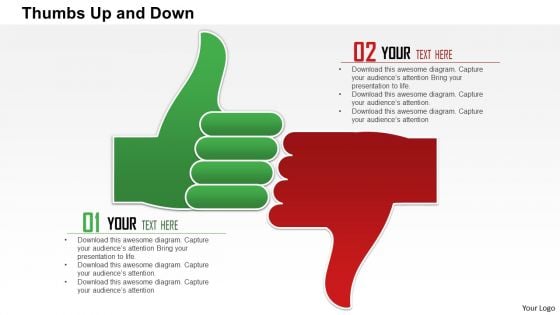
Business Framework Thumbs Up And Down PowerPoint Presentation
Graphic of two thumbs are used to decorate this Power Point template slide. This PPT slide contains the concept of like and dislike. Use this PPT slide for business and social topics related presentations.
-
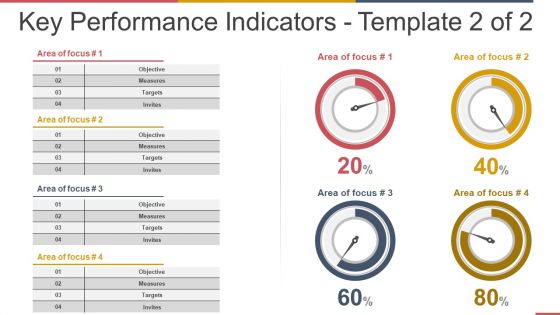
Key Performance Indicators Template 2 Ppt PowerPoint Presentation Ideas Background Images
This is a key performance indicators template 2 ppt powerpoint presentation ideas background images. This is a four stage process. The stages in this process are objective, measures, targets, invites.
-
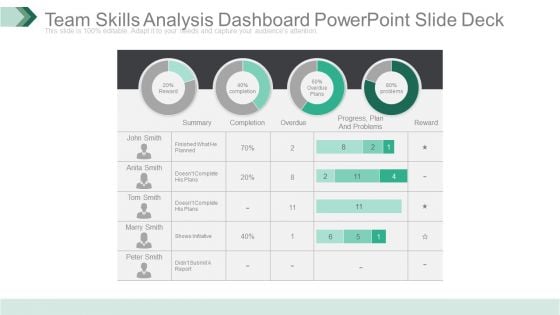
Team Skills Analysis Dashboard Powerpoint Slide Deck
This is a team skills analysis dashboard powerpoint slide deck. This is a four stage process. The stages in this process are reward, summary, completion, overdue, progress plan and problems, problems, reward.
-
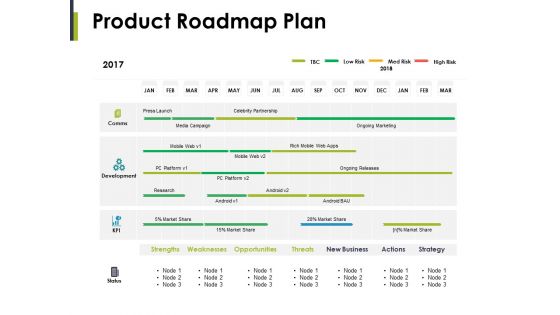
Product Roadmap Plan Ppt PowerPoint Presentation Gallery Images
This is a radar chart ppt powerpoint presentation ideas mockup. This is a two stage process. The stages in this process are business, marketing, planning, finance, strategy.
-
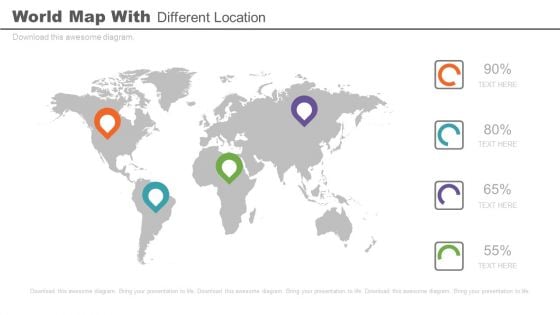
World Map For Global Market Strategy PowerPoint Slides
Business is about to reach at a whole new level? It is going to be global? How about ?Show me, don?t tell me.? You want to share this with your colleagues where all you are about to set up your business. Do it visually. Use this above PowerPoint template and graphically put your points forward which are bound to leave more impact than regular text. The above template can also be used as to depict comparison between the products or their sales figures across different countries. This PowerPoint template is an ideal background to display tourism business as well. This template is easily editable. You can use the icons the way you want. Color, icon and text are easy to modify like all our slides.
-
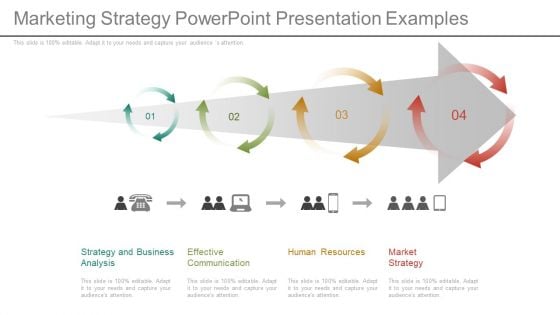
Marketing Strategy Powerpoint Presentation Examples
This is a marketing strategy powerpoint presentation examples. This is a four stage process. The stages in this process are strategy and business analysis, effective communication, human resources, market strategy.
-
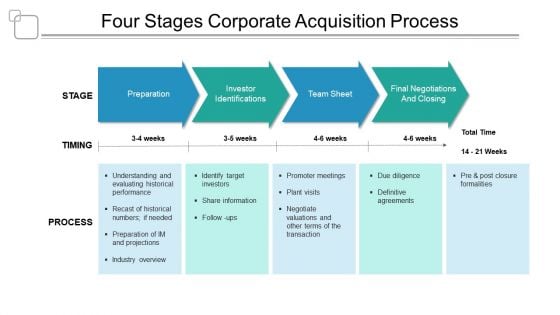
Four Stages Corporate Acquisition Process Ppt PowerPoint Presentation Outline Guide
This is a four stages corporate acquisition process ppt powerpoint presentation outline guide. This is a four stage process. The stages in this process are investment, funding, private equity, venture capital.
-
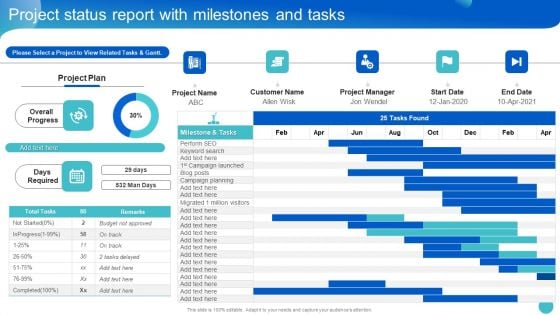
Project Status Report With Milestones And Tasks Information PDF
Deliver an awe inspiring pitch with this creative Project Status Report With Milestones And Tasks Information PDF bundle. Topics like Project Plan, Budget, planning can be discussed with this completely editable template. It is available for immediate download depending on the needs and requirements of the user.
-
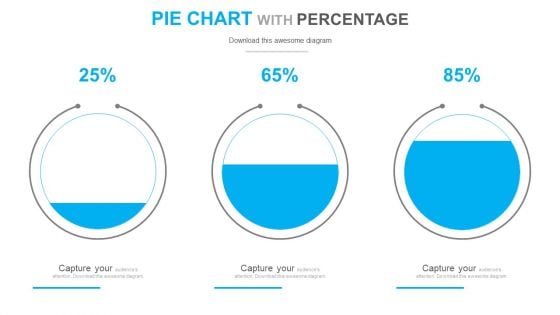
Circle Chart With Increasing Percentage Values PowerPoint Slides
Circle Chart with Increasing Percentage Values power point Slides: - Show your achievements and targets with the ideal background. Above is the diagram to display how your business has been growing or your achievements. The slide is of the three circles having water at different levels in them. Therefore it becomes easy to show that in the first circle, the growth is at this much percent, then the second one and in the last circle, completed 85% of the targets. This PowerPoint template is easy to use to show the progress, and comparisons. All icons are editable. Choose them as per your need.
-

People PowerPoint Template
Colleagues-
-
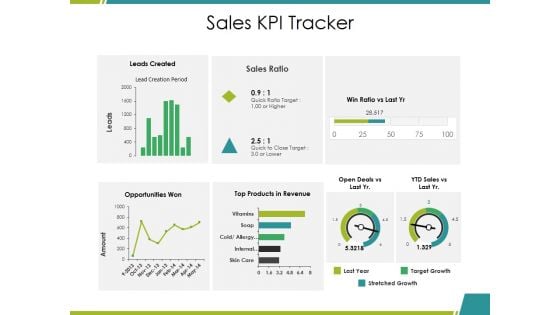
Sales Kpi Tracker Ppt PowerPoint Presentation Layout
This is a sales kpi tracker ppt powerpoint presentation layout. This is a six stage process. The stages in this process are leads created, sales ratio, opportunities won, top products in revenue, actual.
-
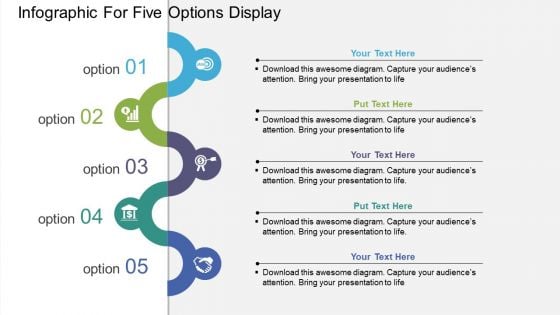
Infographic For Five Options Display Powerpoint Template
Our above business diagram has been designed with infographic of five options. This slide is suitable to present business ideas. Use this business diagram to present your work in a more smart and precise manner.
-
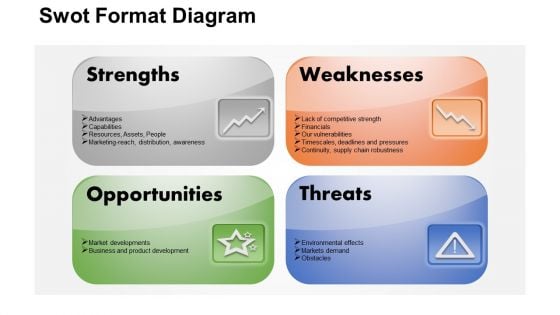
Business Diagram Swot Format PowerPoint Ppt Presentation
Put In A Dollop Of Our Business Diagram Swot Format PowerPoint PPT Presentation Powerpoint Templates. Give Your Thoughts A Distinctive Flavor. Create Your Domain With Our Business Powerpoint Templates. Rule Minds With Your Thoughts.
-
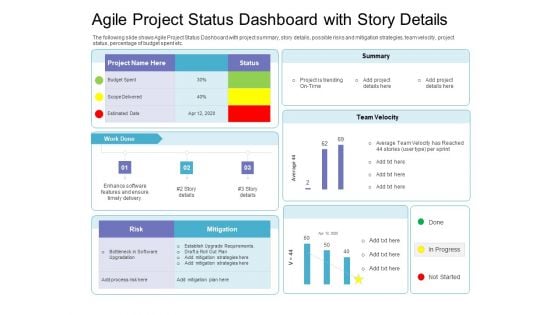
Agile Project Status Dashboard With Story Details Portrait PDF
The following slide shows Agile Project Status Dashboard with project summary, story details, possible risks and mitigation strategies, team velocity, project status, percentage of budget spent etc. Deliver and pitch your topic in the best possible manner with this agile project status dashboard with story details portrait pdf. Use them to share invaluable insights on risk, mitigation, team velocity and impress your audience. This template can be altered and modified as per your expectations. So, grab it now.
-
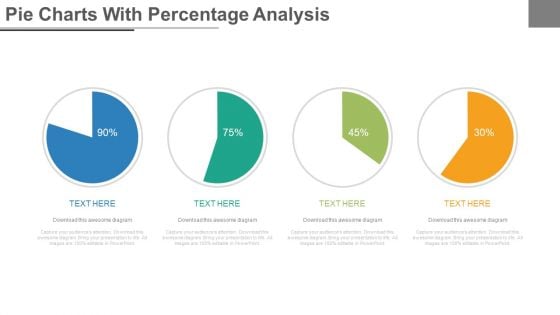
Four Steps Pie Charts For Financial Analysis Powerpoint Slides
Four pie charts have been displayed in this business slide. This PowerPoint template helps to exhibit financial ratio analysis. Use this diagram slide to build an exclusive presentation.
-

Executive Summary Ppt PowerPoint Presentation Show Topics
This is a executive summary ppt powerpoint presentation show topics. This is a five stage process. The stages in this process are background, capabilities, accreditation, company s vision, company s mission.
-
Business Teamwork PowerPoint Template
hand in hand
-
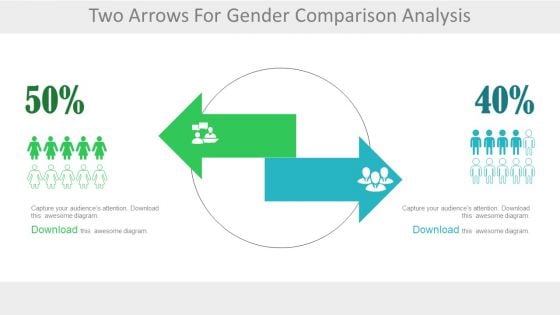
Two Arrows For Male Female Ratio Analysis Powerpoint Slides
Use this professionally created PowerPoint template to create the perfect slide to educate your audience about comparisons between choices and opinions of different genders. The slide can be used to denote the sex ratio or the changes occurring in the same. The 2 colored arrows can be used to refer to the 2 genders or even 2 teams or groups. This slide can be effectively used in corporate or business presentations to demonstrate the conversion of probable customers to sale. Other concepts like brain drain or brand preference or people making different choices can also be demonstrated using this template. A human resource manager can use this slide to demonstrate the transfer of employees to other locations or companies.
-
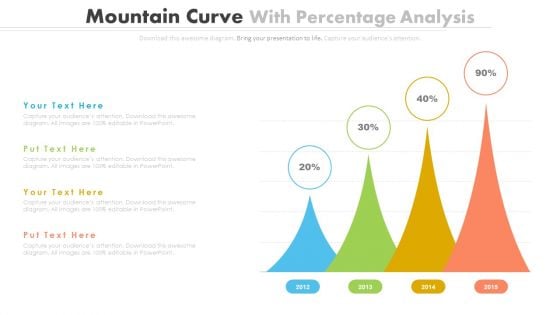
Percentage Data Growth Chart Powerpoint Slides
This PowerPoint template has been designed with percentage data growth chart. Download this PPT chart to depict financial ratio analysis. This PowerPoint slide is of great help in the business sector to make realistic presentations and provides effective way of presenting your newer thoughts.
-
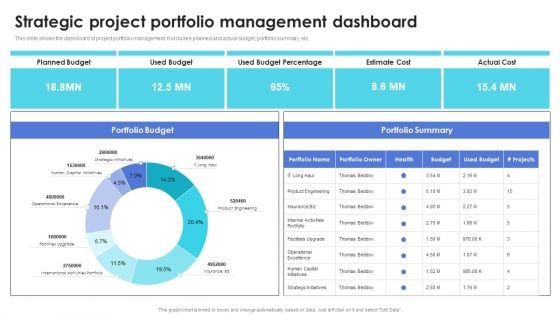
Strategic Project Portfolio Management Dashboard Download PDF
This slide shows the dashboard of project portfolio management. It includes planned and actual budget, portfolio summary, etc. Pitch your topic with ease and precision using this Strategic Project Portfolio Management Dashboard Download PDF. This layout presents information on Portfolio Budget, Portfolio Summary, Planned Budget. It is also available for immediate download and adjustment. So, changes can be made in the color, design, graphics or any other component to create a unique layout.
-
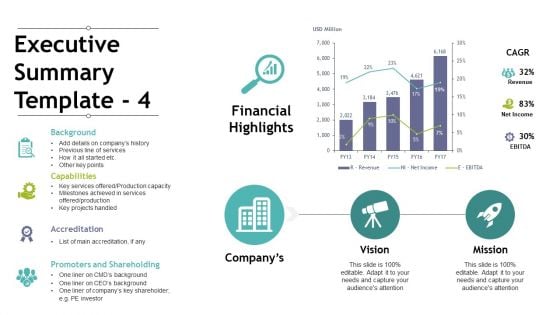
Executive Summary Template 4 Ppt PowerPoint Presentation Outline Visuals
This is a executive summary template 4 ppt powerpoint presentation outline visuals. This is a three stage process. The stages in this process are financial highlights, companys, vision, mission.
-

Key Metrics Ppt PowerPoint Presentation Professional Slideshow
This is a key metrics ppt powerpoint presentation professional slideshow. This is a five stage process. The stages in this process are new customers per month, on time delivery, customer satisfaction, lead conversion rate, customer retention rate.
-
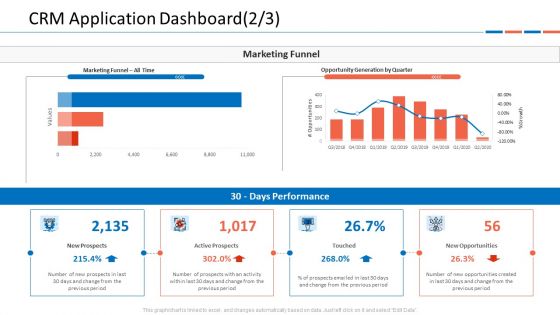
Customer Relationship Management Dashboard CRM Application Dashboard Quarter Icons PDF
This graph or chart is linked to excel, and changes automatically based on data. Just left click on it and select Edit Data.Deliver and pitch your topic in the best possible manner with this customer relationship management dashboard crm application dashboard quarter icons pdf. Use them to share invaluable insights on marketing funnel all time, opportunity generation by quarter, active prospects, new prospects, new opportunities and impress your audience. This template can be altered and modified as per your expectations. So, grab it now.
-
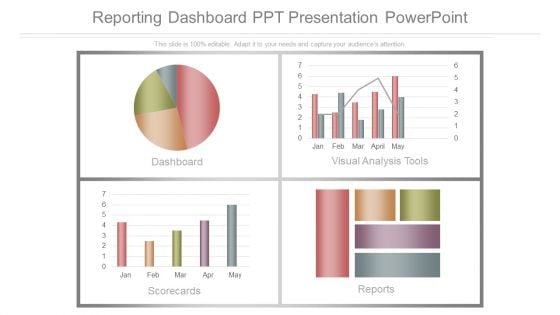
Reporting Dashboard Ppt Presentation Powerpoint
This is a reporting dashboard ppt presentation powerpoint. This is a four stage process. The stages in this process are dashboard, visual analysis tools, scorecards, reports.
-

Graphical Data Analysis PowerPoint Template
3d decay graph bar
-
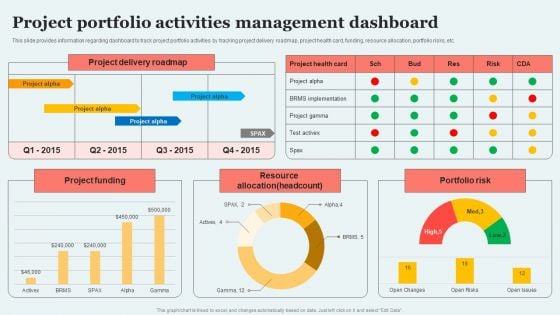
Project Portfolio Activities Management Dashboard Introduction PDF
This slide provides information regarding dashboard to track project portfolio activities by tracking project delivery roadmap, project health card, funding, resource allocation, portfolio risks, etc. This Project Portfolio Activities Management Dashboard Introduction PDF from Slidegeeks makes it easy to present information on your topic with precision. It provides customization options, so you can make changes to the colors, design, graphics, or any other component to create a unique layout. It is also available for immediate download, so you can begin using it right away. Slidegeeks has done good research to ensure that you have everything you need to make your presentation stand out. Make a name out there for a brilliant performance.
-
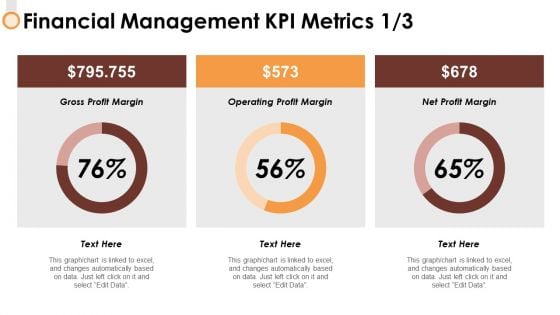
Financial Management Kpi Metrics 1 3 Ppt PowerPoint Presentation Ideas Mockup
This is a financial management kpi metrics 1 3 ppt powerpoint presentation ideas mockup. This is a three stage process. The stages in this process are finance, strategy, marketing, compare, business.
-

Communication KPI Dashboard With KPI Comparison Ideas PDF
Pitch your topic with ease and precision using this Communication KPI Dashboard With KPI Comparison Ideas PDF This layout presents information on Increase In Brand, Employees Knowledge, Vision Statement It is also available for immediate download and adjustment. So, changes can be made in the color, design, graphics or any other component to create a unique layout.
-
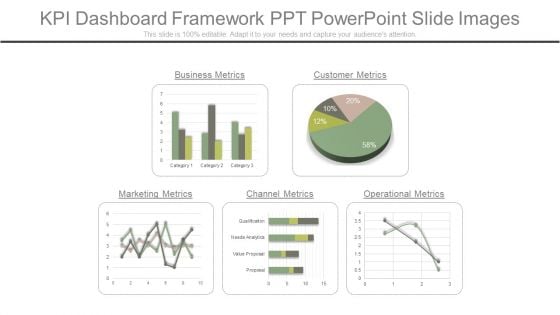
Kpi Dashboard Framework Ppt Powerpoint Slide Images
This is a kpi dashboard framework ppt powerpoint slide images. This is a five stage process. The stages in this process are business metrics, customer metrics, operational metrics, channel metrics, marketing metrics.
-

Illustration Of Value Stream Mapping Tools Powerpoint Slides
This PowerPoint template contains five steps infographic diagram. You may download this slide to illustrate value stream mapping tools. You can easily customize this template to make it more unique as per your need.
-
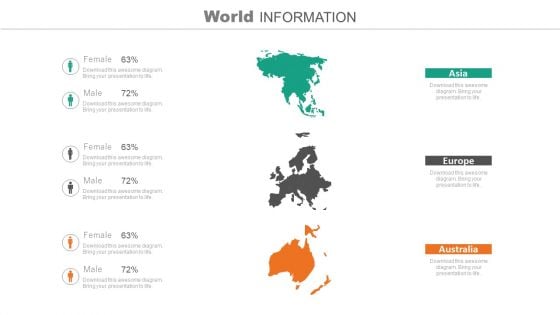
Population Of Asia Europe And Australia PowerPoint Slides
Above is the Power Point template which has the graphical maps of Asia, Europe and Australia. This creatively designed visual is the perfect slide to demonstrate the comparison between male and female about their patterns. You can also use this PPT template to show the prevalent sex ratio in these countries. This slide can also be used to depict the number of customers which are using your company?s brand according to the genders. The icon, color and text are easy to modify. You can change them as per your requirement. It would be easy for the audience to understand these points visually rather than verbally or in the conventional text form. You must include this template in your presentation if you want them to grasp the idea the way you intend them to. Your presentation won?t only look amazing, it is bound to leave an everlasting impression as well.
-
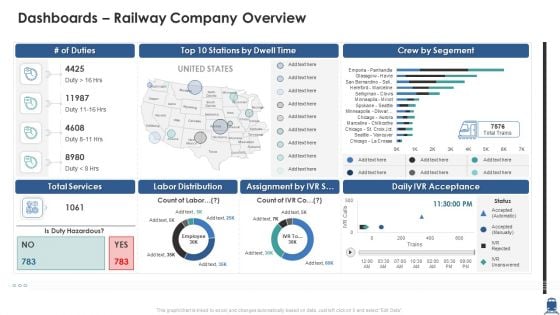
Dashboards Railway Company Overview Elements PDF
Deliver an awe inspiring pitch with this creative dashboards railway company overview elements pdf bundle. Topics like dashboards railway company overview can be discussed with this completely editable template. It is available for immediate download depending on the needs and requirements of the user.
-
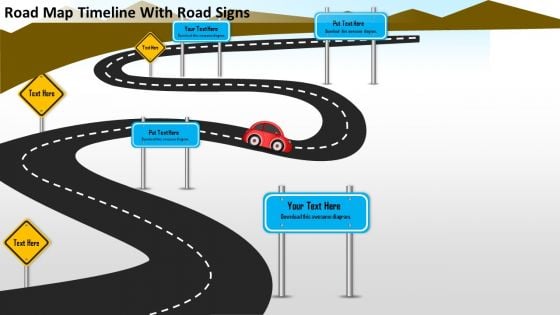
Business Framework Road Map Timeline With Road Signs PowerPoint Presentation
This business diagram displays framework for road map timeline. It contains graphic of black road and boards. This diagram displays concept of roadmap and timeline. Use this diagram for your business timeline related topics.
-
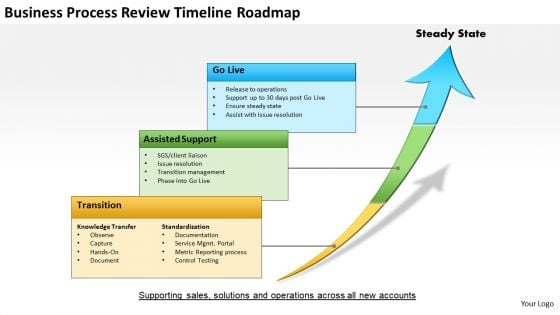
Business Framework Business Process Review Timeline Roadmap PowerPoint Presentation
This business framework PPT slide has been crafted with graphic of roadmap diagram with timeline. This graphic slide can be used for business growth display. Use this slide in your business presentation and explain growth phenomenon.
-
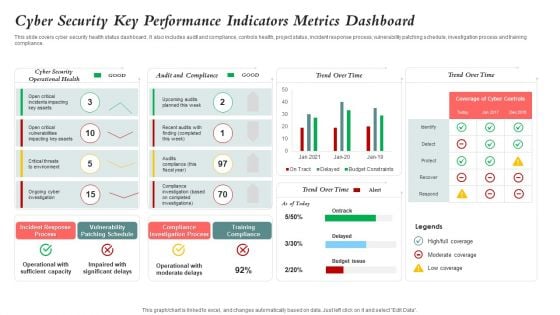
Cyber Security Key Performance Indicators Metrics Dashboard Mockup PDF
This slide covers cyber security health status dashboard . It also includes audit and compliance, controls health, project status, incident response process, vulnerability patching schedule, investigation process and training compliance. Pitch your topic with ease and precision using this Cyber Security Key Performance Indicators Metrics Dashboard Mockup PDF. This layout presents information on Cyber Security, Vulnerability Patching Schedule, Compliance Investigation Process. It is also available for immediate download and adjustment. So, changes can be made in the color, design, graphics or any other component to create a unique layout.
-
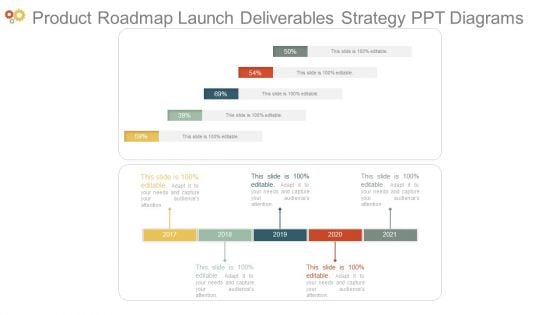
Product Roadmap Launch Deliverables Strategy Ppt Diagrams
This is a product roadmap launch deliverables strategy ppt diagrams. This is a five stage process. The stages in this process are years, business, marketing, percentage, timeline.
-

Business Chain PowerPoint Template
Business
-
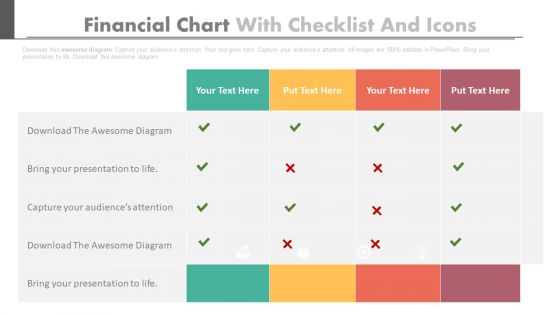
Checklist With Financial Planning Icons Powerpoint Slides
This PowerPoint template contains business checklist with icons. Download this diagram slide to display financial planning and analysis. Etch your views in the brains of your audience with this diagram slide.
-
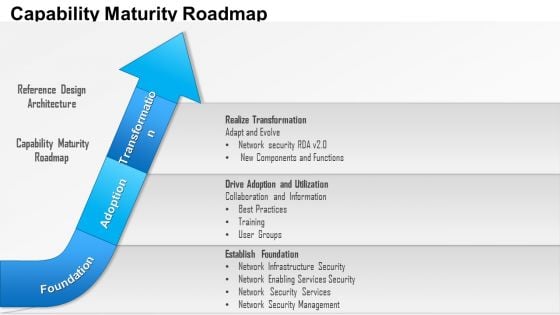
Business Framework Capability Maturity Roadmap PowerPoint Presentation
This business framework displays a blue colored growing arrow for capability maturity roadmap. This diagram can be used for various concepts like business strategy success and growth. Use this editable slide for your business strategy related presentations.
-

Dashboard Report Ppt Powerpoint Ideas
This is a dashboard report ppt powerpoint ideas. This is a six stage process. The stages in this process are sales vs quotes, target for week, the sales, inventory, revenue.
-
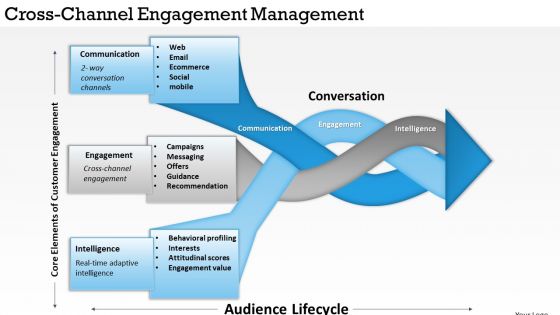
Business Framework Cross Channel Engagement Management PowerPoint Presentation 2
This innovative image slide has been designed to display cross channel customer engagement diagram. This business framework template may be used in your presentations to depict business marketing plan. This image slide will help you make professional presentations.
-
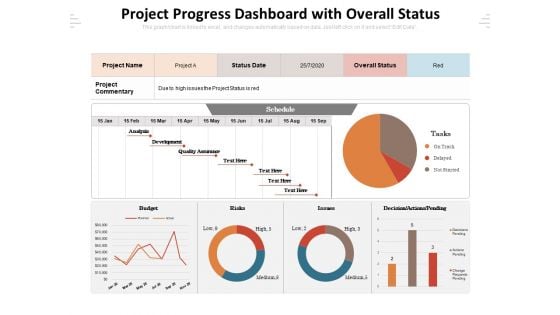
Project Progress Dashboard With Overall Status Ppt PowerPoint Presentation Gallery Graphics Template PDF
Presenting this set of slides with name project progress dashboard with overall status ppt powerpoint presentation gallery graphics template pdf. The topics discussed in these slides are budget, risks, issues. This is a completely editable PowerPoint presentation and is available for immediate download. Download now and impress your audience.
-

Venture Capital Pitch Deck Powerpoint Slide Images
This is a venture capital pitch deck powerpoint slide images. This is a one stage process. The stages in this process are business plan, sales pitch, elevator pitch, pitch book, straw man proposal, marketing plan, selling technique.
-
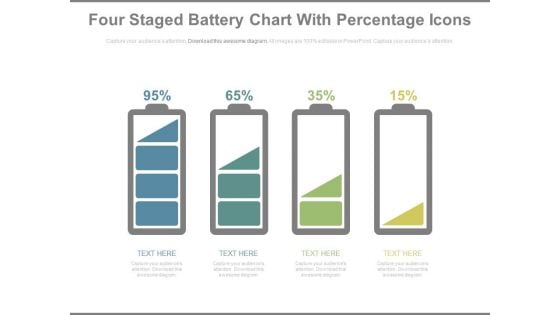
Battery Chart With Percentage Values For Comparison PowerPoint Slides
This year?s sales has matched up with your expectations. Now match this slide with your presentation to show the same. Show your company?s performance or business growth with this four staged battery chart PowerPoint template. With this slide, you can easily convince your colleagues how your company gave a tremendous growth over the years or months. Perfect illustration to show that the targets are achieved. This PPT template is easy to edit. You can choose the color of your choice. Your colleagues are already impressed with the sales growth. Now impress others and choose this PPT innovative designed template.
-

Enhancing Client Experience By Evaluating Kpis Ppt PowerPoint Presentation Complete Deck With Slides
Take advantage of this well-researched and professionally-designed Enhancing Client Experience By Evaluating Kpis Ppt PowerPoint Presentation Complete Deck With Slides to ace your next business meeting. Use this PPT complete deck to impress the management with your ideas for business growth and revenue increase. Use the fifty five slide Template Bundle to leave no stone unturned as you present each step of your process. Employ the visual tools within the slides such as graphs, charts, and tables to ensure that the audience can never look away from the presentation. With attractive visuals, easy to understand structure, and your knowledge, your presentation will have the attention it deserves. Download this PPT Template from the link below.
-
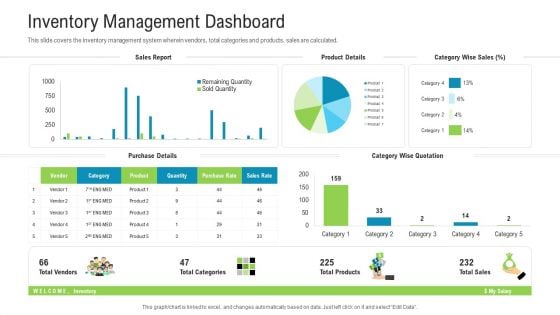
Inventory Management Dashboard Brochure PDF
Deliver and pitch your topic in the best possible manner with this inventory management dashboard brochure pdf. Use them to share invaluable insights on purchase details, category wise quotation, product details and impress your audience. This template can be altered and modified as per your expectations. So, grab it now.
-
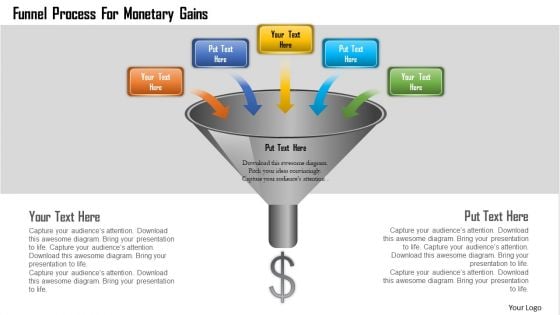
Business Diagram Funnel Process For Monetary Gains Presentation Template
Graphics of funnel diagram has been used to design this power point template. This diagram contains funnel graphics to display concept of monetary gains. Present your views and ideas with this impressive image.
-
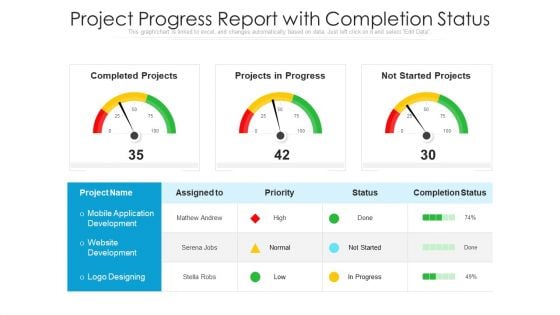
Project Progress Report With Completion Status Ppt Icon Professional PDF
Presenting project progress report with completion status ppt icon professional pdf to dispense important information. This template comprises three stages. It also presents valuable insights into the topics including completed projects, projects in progress, not started projects. This is a completely customizable PowerPoint theme that can be put to use immediately. So, download it and address the topic impactfully.
-
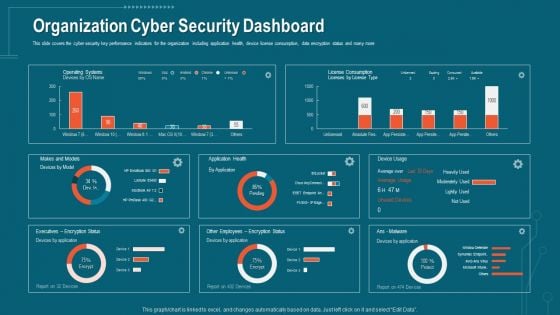
Companys Data Safety Recognition Organization Cyber Security Dashboard Pictures PDF
This slide covers the cyber security key performance indicators for the organization including application health, device license consumption, data encryption status and many more. Deliver an awe-inspiring pitch with this creative companys data safety recognition organization cyber security dashboard pictures pdf bundle. Topics like application health, operating systems, encryption status can be discussed with this completely editable template. It is available for immediate download depending on the needs and requirements of the user.
-
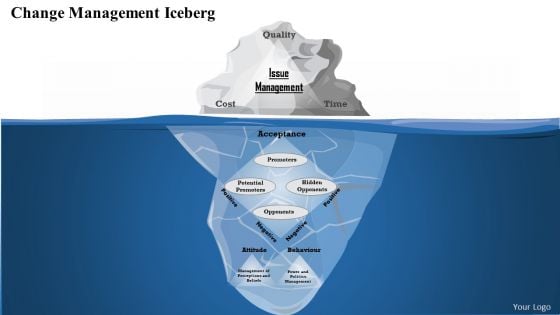
Business Framework Change Management Iceberg
This business framework PPT has been crafted with diagram of change management. We have designed this PPT with suitable graphics to explain change management. Use this PPT and build quality presentation for your viewers.
-
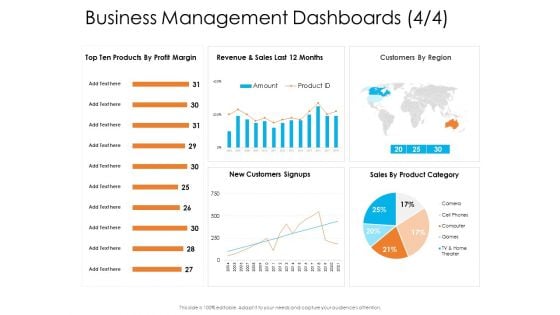
Enterprise Governance Business Management Dashboards Slides PDF
Deliver and pitch your topic in the best possible manner with this enterprise governance business management dashboards slides pdf. Use them to share invaluable insights on revenue, customers by region, sales by product category and impress your audience. This template can be altered and modified as per your expectations. So, grab it now.
-
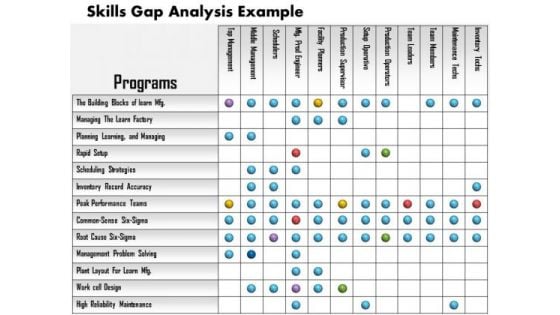
Business Framework Skills Gap Analysis Example PowerPoint Presentation
Define the concept of skill gap analysis with this unique business framework power point template. This PPT contains the graphic of analysis chart. Use this diagram PPT for skill gap analysis program and management related topics.
-
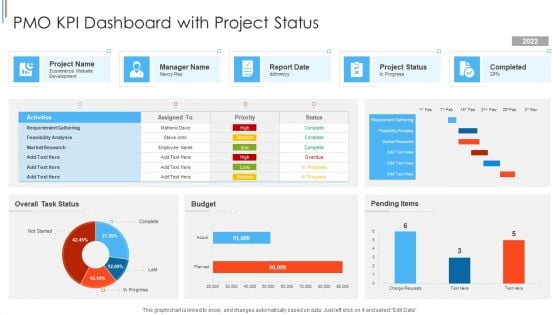
PMO KPI Dashboard With Project Status Template PDF
Pitch your topic with ease and precision using this PMO KPI Dashboard With Project Status Template PDF This layout presents information on Requirement Gathering, Feasibility Analysis, Market Research It is also available for immediate download and adjustment. So, changes can be made in the color, design, graphics or any other component to create a unique layout.

 Home
Home 


