Financial analysis PowerPoint Templates
-
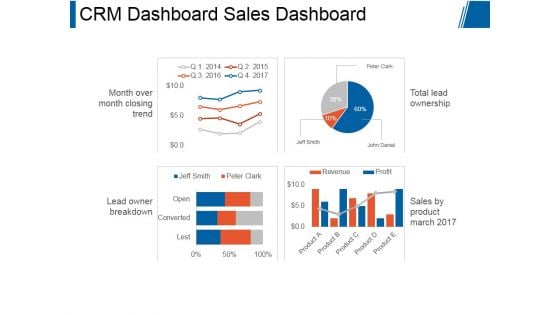
Crm Dashboard Sales Dashboard Ppt PowerPoint Presentation Themes
This is a crm dashboard sales dashboard ppt powerpoint presentation themes. This is a four stage process. The stages in this process are month over month closing trend, lead owner breakdown, total lead ownership, sales by product march 2017.
-
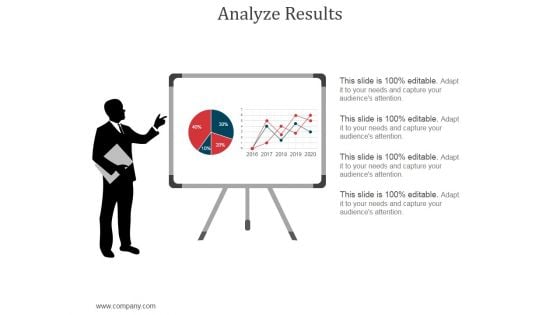
Analyze Results Ppt PowerPoint Presentation Slide
This is a analyze results ppt powerpoint presentation slide. This is a two stage process. The stages in this process are analysis, business, marketing, finance, pie chart.
-
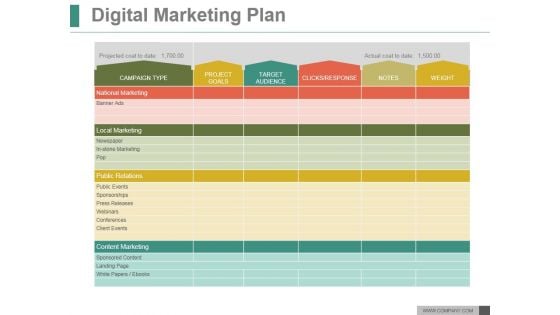
Digital Marketing Plan Ppt PowerPoint Presentation Example
This is a digital marketing plan ppt powerpoint presentation example. This is a five stage process. The stages in this process are national marketing, local marketing, public relations, content marketing.
-

Investment Strategies For Stock Portfolio Management Ppt PowerPoint Presentation Complete Deck With Slides
This is a investment strategies for stock portfolio management ppt powerpoint presentation complete deck with slides. This is a one stage process. The stages in this process are portfolio, management, business, growth, strategy.
-
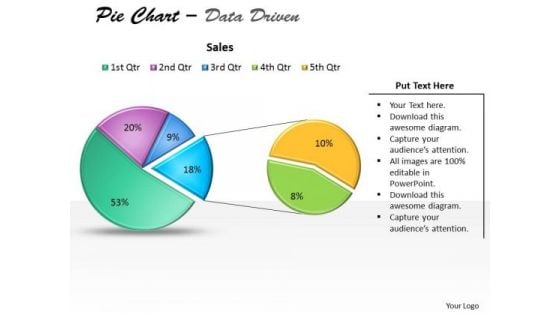
Data Analysis Excel Driven Pie Chart For Business Stratregy PowerPoint Slides Templates
Open Up Doors That Lead To Success. Our data analysis excel driven pie chart for business stratregy powerpoint slides Templates Provide The Handles.
-

Crowd Funding For Business Startups Ppt PowerPoint Presentation Complete Deck With Slides
This is a crowd funding for business startups ppt powerpoint presentation complete deck with slides. This is a one stage process. The stages in this process are business, strategy, finance, planning, management.
-
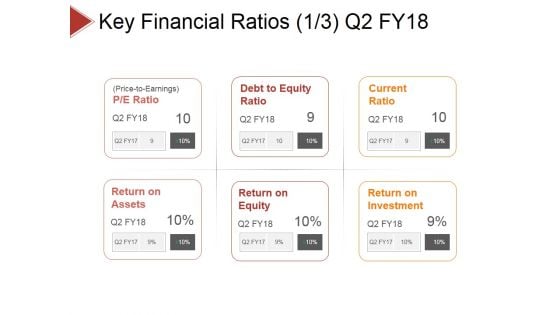
Key Financial Ratios Template 1 Ppt PowerPoint Presentation Layouts Guidelines
This is a key financial ratios template 1 ppt powerpoint presentation layouts guidelines. This is a six stage process. The stages in this process are price to earnings, debt to equity ratio, current ratio, return on, equity, return on , assets, return on investment.
-
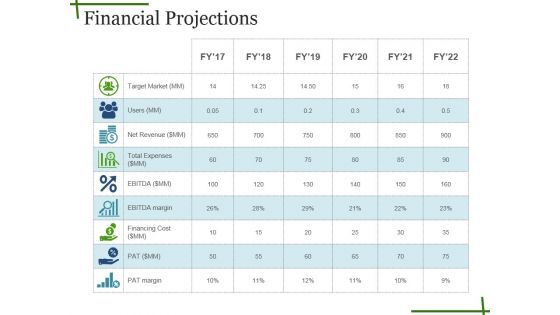
Financial Projections Ppt PowerPoint Presentation Show Format
This is a financial projections ppt powerpoint presentation show format. This is a six stage process. The stages in this process are total assets, total tax paid, loan, revenue, deposits.
-
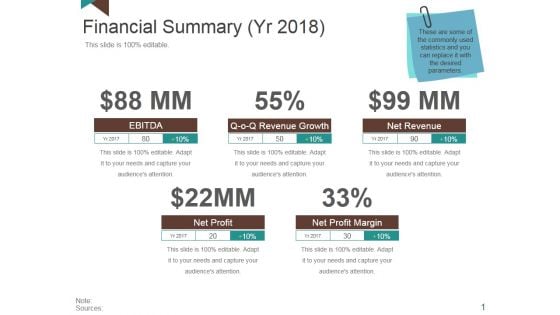
Financial Summary Ppt PowerPoint Presentation Layouts Portrait
This is a financial summary ppt powerpoint presentation layouts portrait. This is a four stage process. The stages in this process are ebitda, revenue growth, net revenue, net profit margin, net profit.
-
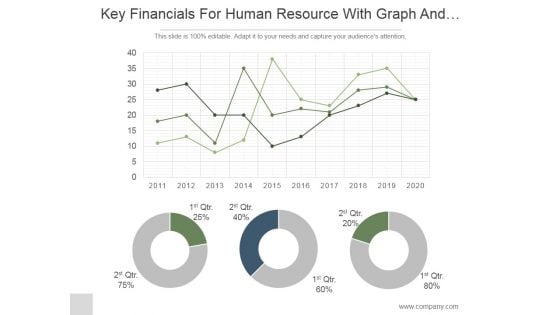
Key Financials For Human Resource With Graph And Pie Chart Ppt PowerPoint Presentation Ideas
This is a key financials for human resource with graph and pie chart ppt powerpoint presentation ideas. This is a three stage process. The stages in this process are business, strategy, marketing, analysis, donut, growth.
-

Product Pricing Template 2 Ppt PowerPoint Presentation Themes
This is a product pricing template 2 ppt powerpoint presentation themes. This is a four stage process. The stages in this process are regular, advanced, ultimate, thrifty.
-
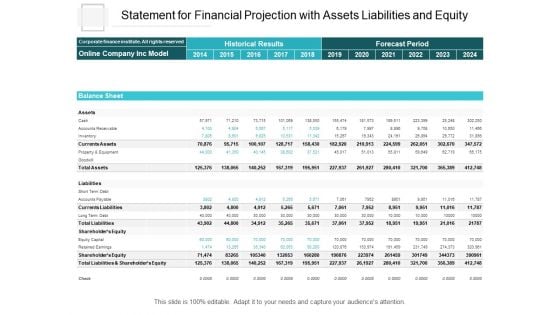
Statement For Financial Projection With Assets Liabilities And Equity Ppt PowerPoint Presentation Styles Designs
Presenting this set of slides with name statement for financial projection with assets liabilities and equity ppt powerpoint presentation styles designs. The topics discussed in these slides are financial analysis, balance sheet, income statement. This is a completely editable PowerPoint presentation and is available for immediate download. Download now and impress your audience.
-

Business Data Analysis Chart For Case Studies PowerPoint Templates
Get Out Of The Dock With Our business data analysis chart for case studies Powerpoint Templates. Your Mind Will Be Set Free.
-

Data Analysis Excel 3d Pie Chart For Marketing Process PowerPoint Templates
Our data analysis excel 3d pie chart for marketing process Powerpoint Templates Team Are A Dogged Lot. They Keep At It Till They Get It Right.
-

Financial Plan Ppt PowerPoint Presentation Complete Deck With Slides
This is a financial plan ppt powerpoint presentation complete deck with slides. This is a one stage process. The stages in this process are business, marketing, finance, planning, analysis.
-
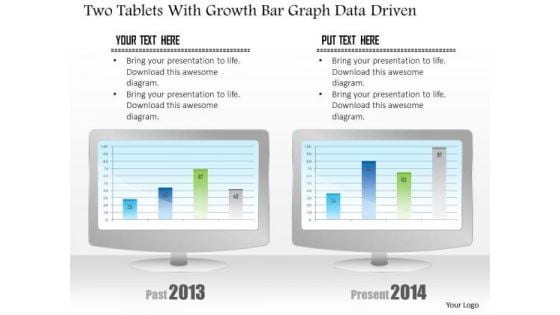
Business Diagram Two Tablets With Growth Bar Graph Data Driven PowerPoint Slide
This business diagram has been designed with comparative charts on tablets. This slide suitable for data representation. You can also use this slide to present business reports and information. Use this diagram to present your views in a wonderful manner.
-

Business Diagram Four Pie Chart For Data Driven Result Analysis Of Business PowerPoint Slide
This business diagram displays graphic of pie charts in shape of flasks. This business slide is suitable to present and compare business data. Use this diagram to build professional presentations for your viewers.
-
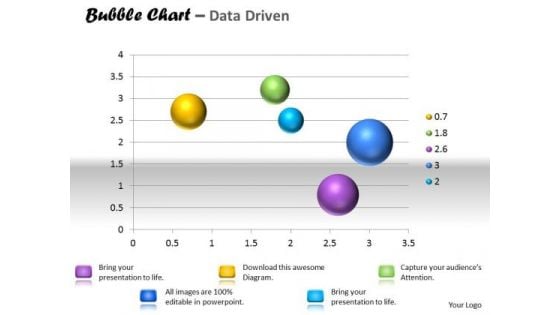
Data Analysis Template Interactive Bubble Chart PowerPoint Templates
Our data analysis template interactive bubble chart Powerpoint Templates Are A Wonder Drug. They Help Cure Almost Any Malaise.
-
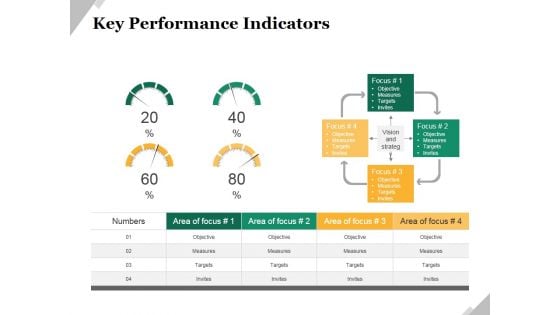
Key Performance Indicators Template 2 Ppt PowerPoint Presentation Model Example
This is a key performance indicators template 2 ppt powerpoint presentation model example. This is a four stage process. The stages in this process are objective, measures, targets, invites, indicators.
-
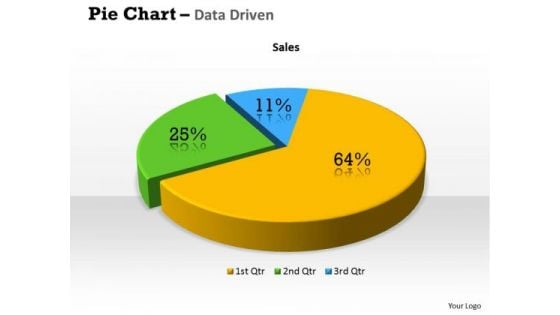
Quantitative Data Analysis 3d Percentage Ratio Pie Chart PowerPoint Templates
Plan Your Storyboard With Our quantitative data analysis 3d percentage ratio pie chart Powerpoint Templates . Give An Outline To The Solutions You Have.
-
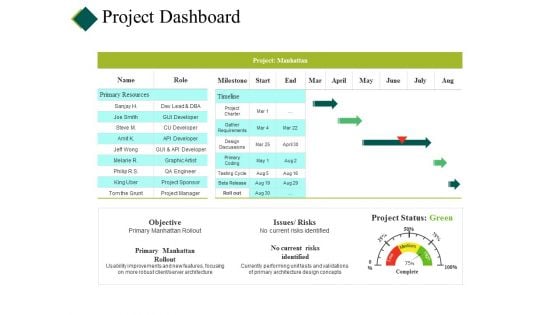
Project Dashboard Ppt PowerPoint Presentation Pictures Backgrounds
This is a project dashboard ppt powerpoint presentation pictures backgrounds. This is a four stage process. The stages in this process are cost, planning, table, project report, data management.
-
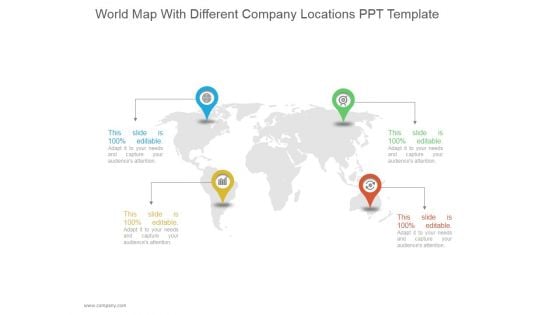
World Map With Different Company Locations Ppt PowerPoint Presentation Templates
This is a world map with different company locations ppt powerpoint presentation templates. This is a four stage process. The stages in this process are business, strategy, location, map, geography, icons, analysis.
-

Decision Making Process In Managerial Economics PPT PowerPoint Presentation Complete Deck With Slides
This is a decision making process in managerial economics ppt powerpoint presentation complete deck with slides. This is a one stage process. The stages in this process are financial, financial analysis, economics, decision, process making.
-

Data Analysis Techniques 3d Effective Display Chart PowerPoint Templates
Dribble Away With Our data analysis techniques 3d effective display chart Powerpoint Templates . Score A Goal With Your Ideas.
-
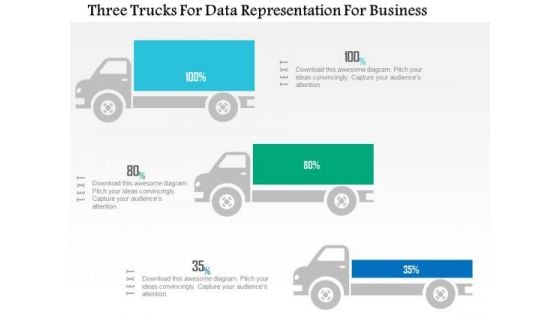
Business Diagram Three Trucks For Data Representation For Business PowerPoint Slide
This business diagram displays three trucks graphic. This diagram contains trucks for percentage value growth. Use this diagram to display business growth over a period of time.
-
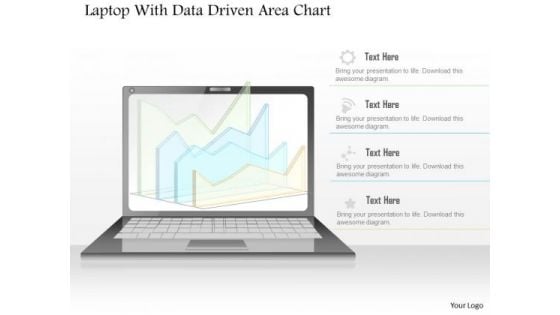
Business Diagram Laptop With Data Driven Area Chart PowerPoint Slide
This diagram has been designed with laptop and data driven area chart. Download this diagram to give your presentations more effective look. It helps in clearly conveying your message to clients and audience.
-
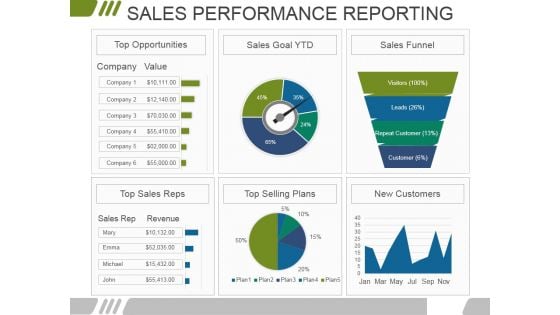
Sales Performance Reporting Ppt PowerPoint Presentation Ideas Pictures
This is a sales performance reporting ppt powerpoint presentation ideas pictures. This is a six stage process. The stages in this process are top opportunities, sales goal, sales funnel, new customers, top selling plans, top sales reps.
-
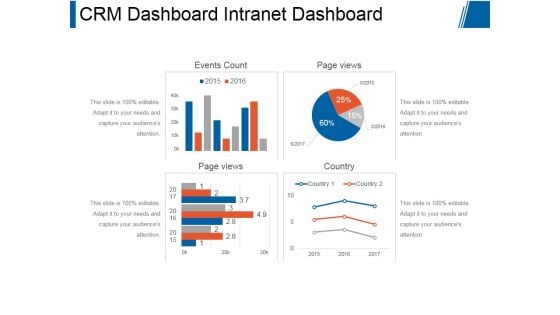
Crm Dashboard Intranet Dashboard Ppt PowerPoint Presentation Model
This is a crm dashboard intranet dashboard ppt powerpoint presentation model. This is a four stage process. The stages in this process are events count, page views, page views, country.
-
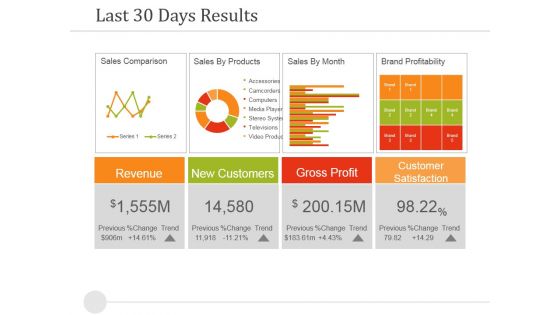
Last 30 Days Results Ppt PowerPoint Presentation Summary Brochure
This is a last 30 days results ppt powerpoint presentation summary brochure. This is a four stage process. The stages in this process are revenue, new customers, gross profit, customer satisfaction.
-
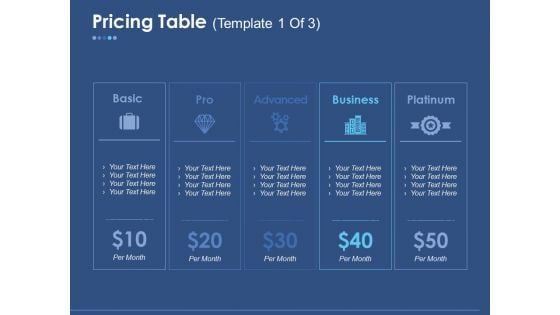
Pricing Table Ppt PowerPoint Presentation Slides Graphics
This is a pricing table ppt powerpoint presentation slides graphics. This is a three stage process. The stages in this process are basic, pro, advanced, business, platinum.
-
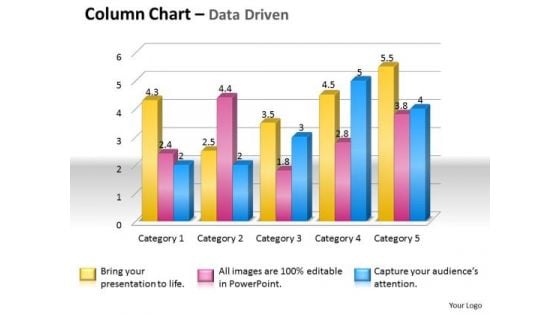
Data Analysis Techniques 3d Grouped Bar Chart PowerPoint Templates
Place The Orders With Your Thoughts. Our data analysis techniques 3d grouped bar chart Powerpoint Templates Know The Drill.
-
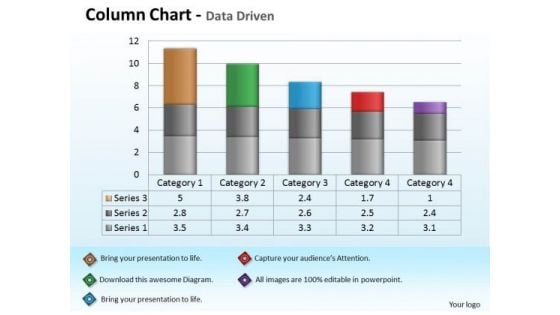
Quantitative Data Analysis Driven Economic With Column Chart PowerPoint Slides Templates
Add Some Dramatization To Your Thoughts. Our quantitative data analysis driven economic with column chart powerpoint slides Templates Make Useful Props.
-
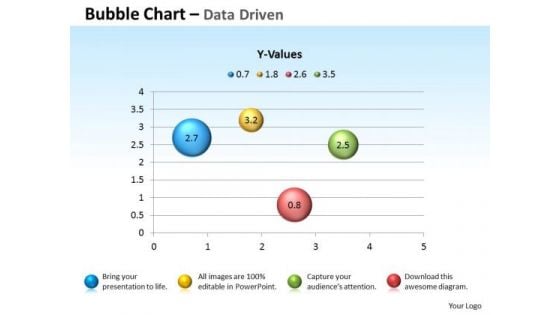
Excel Data Analysis Data Tools Data Methods Statistical Chart For Process PowerPoint Templates
Blend Your Views With Our excel data analysis data tools data methods statistical chart for process Powerpoint Templates . They Are Made For Each Other.
-
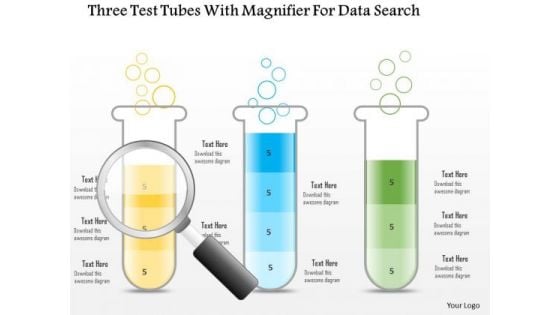
Business Diagram Three Test Tubes With Magnifier For Data Search PowerPoint Slide
This business diagram displays three test tubes with magnifying glass. This diagram is suitable to depict flow of business activities or steps. Download this professional slide to present information in an attractive manner.
-

Business Diagram Six Staged Pie Charts For Text Representation PowerPoint Slide
This slide displays graphic six staged pie charts. Download this diagram to present and compare business data. Use this diagram to display business process workflows in any presentation.
-

Financial Analysis Asset Allocation Report Ppt PowerPoint Presentation Slides Objects
Presenting this set of slides with name financial analysis asset allocation report ppt powerpoint presentation slides objects. The topics discussed in these slides are financial analysis, balance sheet, income statement. This is a completely editable PowerPoint presentation and is available for immediate download. Download now and impress your audience.
-
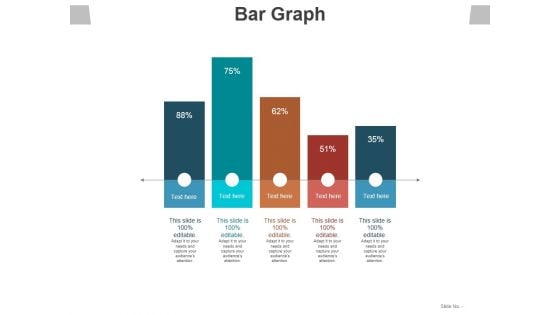
Bar Graph Ppt PowerPoint Presentation Slides Designs
This is a bar graph ppt powerpoint presentation slides designs. This is a five stage process. The stages in this process are bar graph, business, marketing, plan, financial.
-
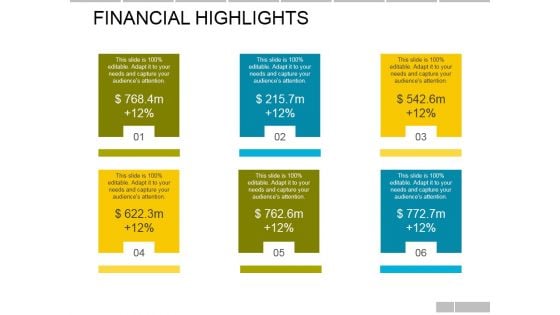
Financial Highlights Ppt PowerPoint Presentation Portfolio Show
This is a financial highlights ppt powerpoint presentation portfolio show. This is a three stage process. The stages in this process are business, marketing, finance, analysis, planning.
-
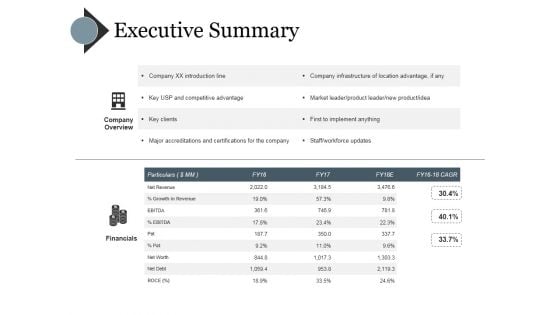
Executive Summary Ppt PowerPoint Presentation Outline Elements
This is a executive summary ppt powerpoint presentation outline elements. This is a two stage process. The stages in this process are company xx introduction line, key usp and competitive advantage, key clients, major accreditations and certifications for the company, company infrastructure of location advantage, if any.
-
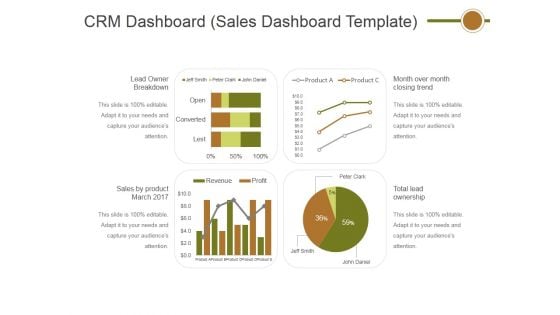
Crm Dashboard Sales Dashboard Template Ppt PowerPoint Presentation Professional Layout
This is a crm dashboard sales dashboard template ppt powerpoint presentation professional layout. This is a four stage process. The stages in this process are lead owner breakdown, sales by product march 2017, total lead ownership, month over month closing trend.
-
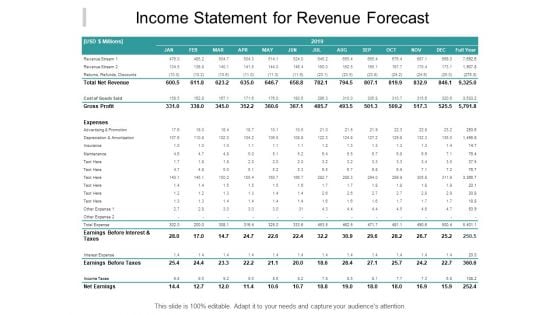
Income Statement For Revenue Forecast Ppt PowerPoint Presentation Show Display
Presenting this set of slides with name income statement for revenue forecast ppt powerpoint presentation show display. The topics discussed in these slides are financial analysis, balance sheet, income statement. This is a completely editable PowerPoint presentation and is available for immediate download. Download now and impress your audience.
-
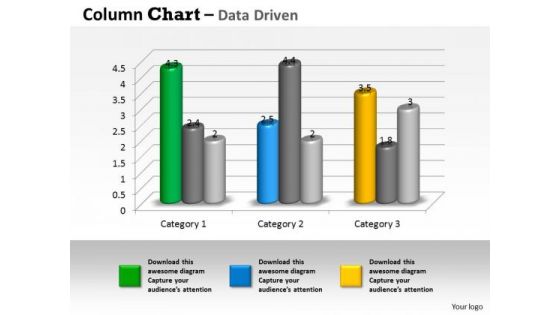
Examples Of Data Analysis Market 3d Business Trend Series Chart PowerPoint Templates
Duct It Through With Our examples of data analysis market 3d business trend series chart Powerpoint Templates . Your Ideas Will Reach Into Their Minds Intact.
-
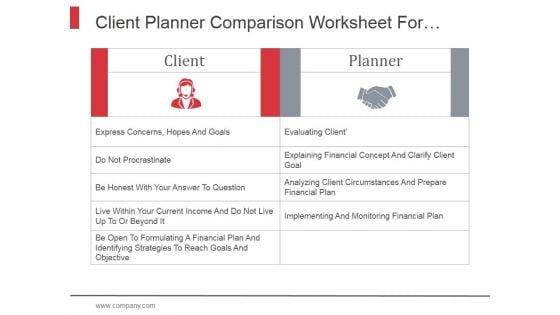
Client Planner Comparison Worksheet For Establishing Financial Direction Ppt PowerPoint Presentation Deck
This is a client planner comparison worksheet for establishing financial direction ppt powerpoint presentation deck. This is a two stage process. The stages in this process are worksheet, financial direction, communication, financial analysis.
-
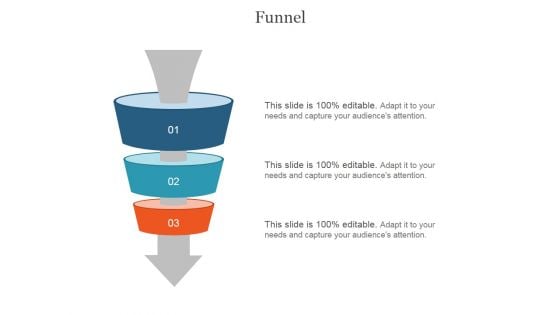
Funnel Ppt PowerPoint Presentation Slides
This is a funnel ppt powerpoint presentation slides. This is a three stage process. The stages in this process are business, marketing, management, funnel, process.
-
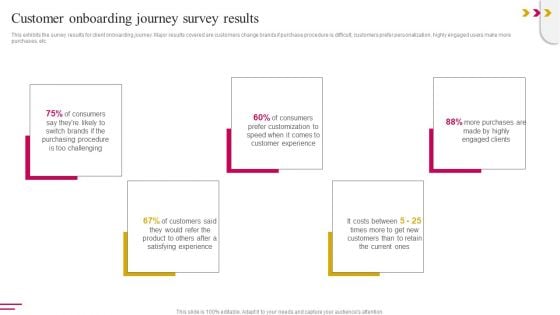
Customer Onboarding Journey Survey Results Clipart PDF
This exhibits the survey results for client onboarding journey. Major results covered are customers change brands if purchase procedure is difficult, customers prefer personalization, highly engaged users make more purchases, etc. Crafting an eye-catching presentation has never been more straightforward. Let your presentation shine with this tasteful yet straightforward Customer Onboarding Journey Survey Results Clipart PDF template. It offers a minimalistic and classy look that is great for making a statement. The colors have been employed intelligently to add a bit of playfulness while still remaining professional. Construct the ideal Customer Onboarding Journey Survey Results Clipart PDF that effortlessly grabs the attention of your audience Begin now and be certain to wow your customers
-
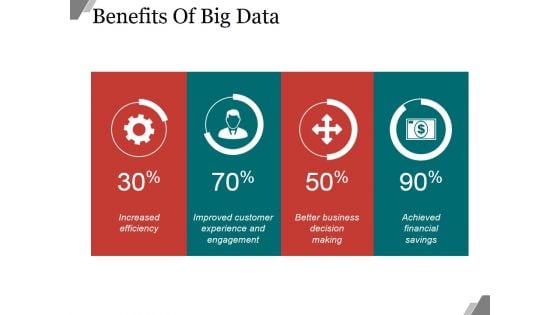
Benefits Of Big Data Ppt PowerPoint Presentation Example 2015
This is a benefits of big data ppt powerpoint presentation example 2015. This is a four stage process. The stages in this process are business, marketing, success, finance, analysis.
-
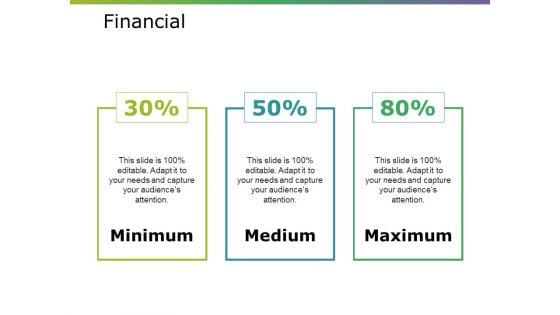
Financial Ppt PowerPoint Presentation Summary Background Designs
This is a financial ppt powerpoint presentation summary background designs. This is a three stage process. The stages in this process are minimum, medium, maximum.
-
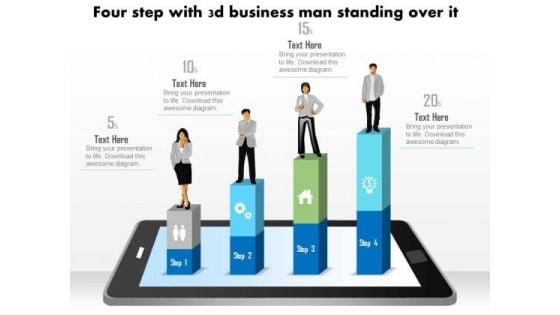
Business Diagram Four Steps With 3d Business Person Standing Over It PowerPoint Slide
This business diagram displays bar graph with business person standing on it. This Power Point template has been designed to display personal growth. You may use this diagram to impart professional appearance to your presentations.
-
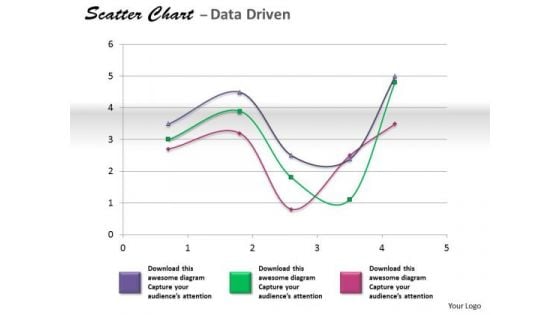
Financial Data Analysis Coordinate With Scatter Chart PowerPoint Templates
Get The Doers Into Action. Activate Them With Our financial data analysis coordinate with scatter chart Powerpoint Templates .
-

Quantitative Methods In Investment Management Ppt PowerPoint Presentation Complete Deck With Slides
This is a quantitative methods in investment management ppt powerpoint presentation complete deck with slides. This is a one stage process. The stages in this process are methods, investment, management, currency, finance.
-
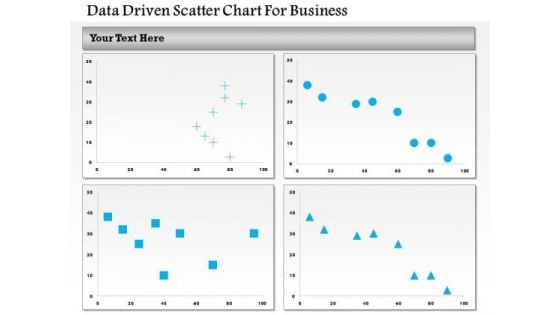
Business Diagram Data Driven Scatter Chart For Business PowerPoint Slide
This business diagram has been designed with four comparative charts. This slide suitable for data representation. You can also use this slide to present business analysis and reports. Use this diagram to present your views in a wonderful manner.
-
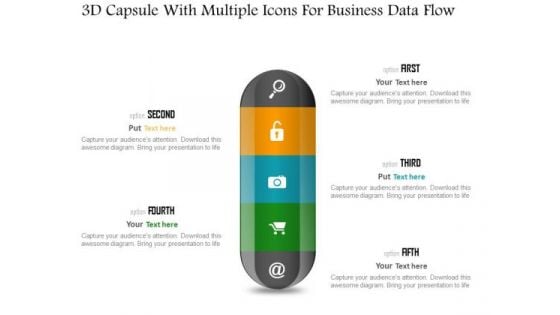
Business Diagram 3d Capsule With Multiple Icons For Business Data Flow PowerPoint Slide
This diagram has been designed with 3d graphic of capsule with multiple icons. This data driven PowerPoint slide can be used to give your presentations more effective look. It helps in clearly conveying your message to clients and audience.
-
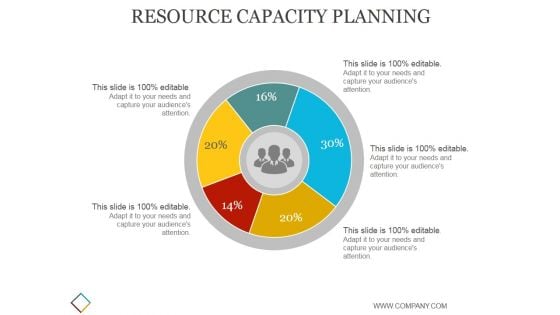
Resource Capacity Planning Ppt PowerPoint Presentation Diagrams
This is a resource capacity planning ppt powerpoint presentation diagrams. This is a five stage process. The stages in this process are business, strategy, marketing, analysis, finance.
-
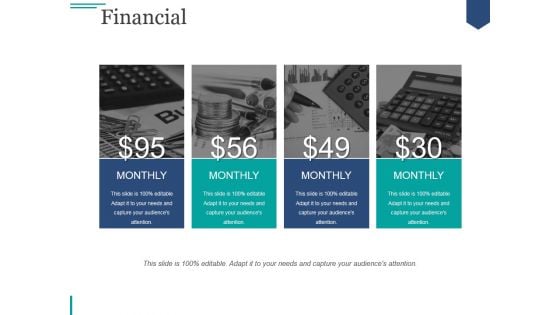
Financial Ppt PowerPoint Presentation Introduction
This is a financial ppt powerpoint presentation introduction. This is a four stage process. The stages in this process are business, marketing, finance, management, monthly.
-
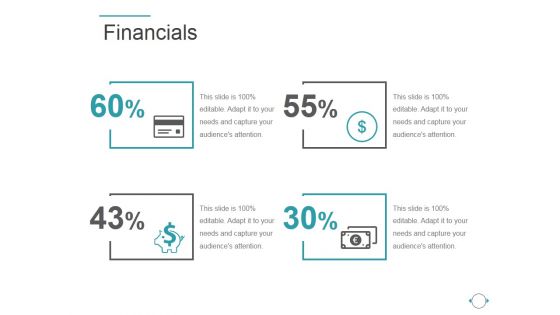
Financials Ppt PowerPoint Presentation Clipart
This is a financials ppt powerpoint presentation clipart. This is a four stage process. The stages in this process are icons, percentage, finance, success, strategy.
-
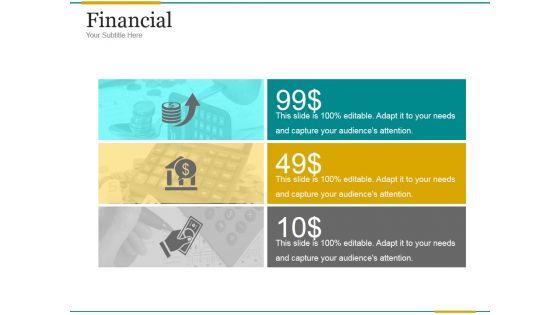
Financial Ppt PowerPoint Presentation Designs Download
This is a financial ppt powerpoint presentation designs download. This is a three stage process. The stages in this process are business, finances, success, strategy, management.
-
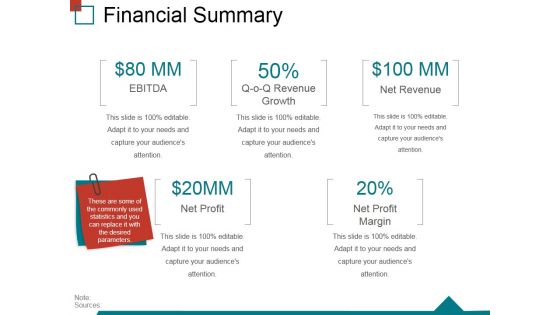
Financial Summary Ppt PowerPoint Presentation Ideas Slide Portrait
This is a financial summary ppt powerpoint presentation ideas slide portrait. This is a five stage process. The stages in this process are ebitda, revenue growth, net revenue, net profit, net profit, margin.
-
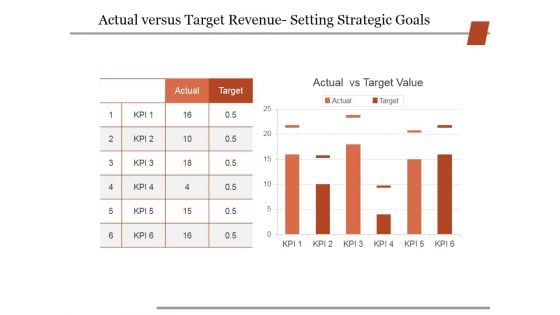
Actual Versus Target Revenue Setting Strategic Goals Ppt PowerPoint Presentation Outline Show
This is a actual versus target revenue setting strategic goals ppt powerpoint presentation outline show. This is a two stage process. The stages in this process are business, strategy, marketing, finance, analysis.
-
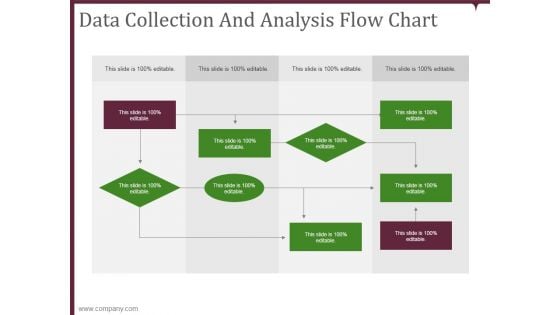
data collection and analysis flow chart ppt powerpoint presentation microsoft
This is a data collection and analysis flow chart ppt powerpoint presentation microsoft. This is a nine stage process. The stages in this process are business, planning, marketing, strategy, management.
-
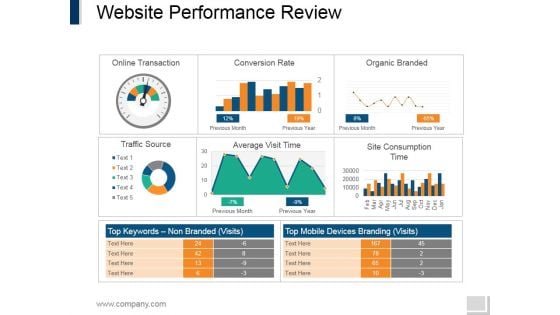
Website Performance Review Template 1 Ppt PowerPoint Presentation Model Guidelines
This is a website performance review template 1 ppt powerpoint presentation model guidelines. This is a six stage process. The stages in this process are online transaction, conversion rate, traffic source, site consumption time, top mobile devices branding.

 Home
Home 

