Approach

Idea Success PowerPoint Templates And PowerPoint Backgrounds 0511
Microsoft PowerPoint Template and Background with concept box in plastic style with idea analysis success text Earn accolades with our Idea Success PowerPoint Templates And PowerPoint Backgrounds 0511. Download without worries with our money back guaranteee.

Investor Report Finance PowerPoint Templates And PowerPoint Backgrounds 0711
Microsoft PowerPoint Template and Background with stock market charts for investor analysis Our Investor Report Finance PowerPoint Templates And PowerPoint Backgrounds 0711 can be aesthetically appealing. Expose your audience to the art of beauty.
Database System PowerPoint Icon Cc
Microsoft PowerPoint Template and Background with database system for reports and data analysis Underline your erudition with our Database System PowerPoint Icon Cc. They will project your considerable expertise.
Database System PowerPoint Icon F
Microsoft PowerPoint Template and Background with database system for reports and data analysis Give them a big deal with our Database System PowerPoint Icon F. The audience will be unabashedly appreciative.
Database System PowerPoint Icon R
Microsoft PowerPoint Template and Background with database system for reports and data analysis Our Database System PowerPoint Icon R are self explanatory. What you get is what you see.
Database System PowerPoint Icon C
Microsoft PowerPoint Template and Background with database system for reports and data analysis Our Database System PowerPoint Icon C have fantastic ability. They will have an astounding effect on the audience.
Database System PowerPoint Icon S
Microsoft PowerPoint Template and Background with database system for reports and data analysis Never fail to impress with our Database System PowerPoint Icon S. You will be at the top of your game.
Yellow Daises PowerPoint Icon R
Microsoft PowerPoint Template and Background with yellow gerber isolated against a blue sky Delve on the cold facts in detail. Explain the factual analysis on our Yellow Daises PowerPoint Icon R.

Social Network Communication PowerPoint Templates And PowerPoint Backgrounds 0711
Microsoft PowerPoint Template and Background with a door opens to social networking surrounded by communication links and connections Delve on the cold facts in detail. Explain the factual analysis on our Social Network Communication PowerPoint Templates And PowerPoint Backgrounds 0711.

Target Concept Success PowerPoint Templates And PowerPoint Backgrounds 0811
Microsoft PowerPoint Template and Background with target concept red thumbtack placed in the center Delve on the cold facts in detail. Explain the factual analysis on our Target Concept Success PowerPoint Templates And PowerPoint Backgrounds 0811.

Blue Tit Fledgling Nature PowerPoint Themes And PowerPoint Slides 0211
Microsoft PowerPoint Theme and Slide with blue tit fledgling bird Delve on the cold facts in detail. Explain the factual analysis on our Blue Tit Fledgling Nature PowerPoint Themes And PowerPoint Slides 0211.

Idea Success PowerPoint Themes And PowerPoint Slides 0511
Microsoft PowerPoint Theme and Slide with concept box in plastic style with idea analysis success text Get enthusiastic with our Idea Success PowerPoint Themes And PowerPoint Slides 0511. Encourage your team to better performances.

Bar Graph For Business Growth Powerpoint Templates
This PowerPoint slide contains graphics bar chart. This slide helps to exhibit business growth analysis. Sparkling thoughts are swirling around in your head. Filter them through with this diagram slide.
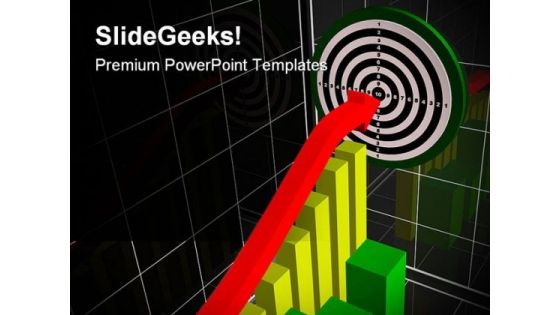
Performance Chart Business PowerPoint Themes And PowerPoint Slides 0311
Microsoft PowerPoint Theme and Slide with business picture about analysis graph arrow and target Your ideas will flower with our Performance Chart Business PowerPoint Themes And PowerPoint Slides 0311. Your brilliance will begin to bloom.
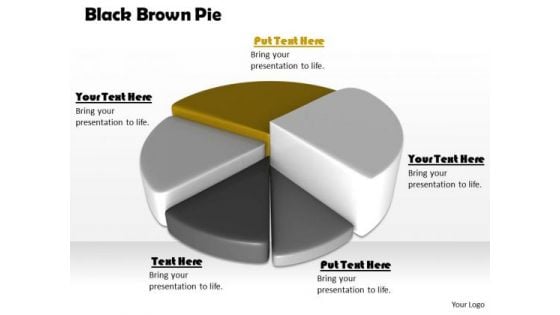
Stock Photo Black Brown Pie Chart For Business Result PowerPoint Slide
This high quality image is designed with pie chart. Use this image to make business reports. Use this outstanding image in presentations relating to data analysis and reports. Go ahead and add charm to your presentations.
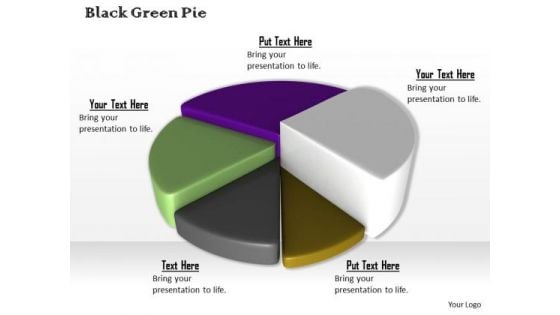
Stock Photo Colorful 3d Pie Chart For Business Result PowerPoint Slide
This high quality image is designed with pie chart. Use this image to make business reports. Use this outstanding image in presentations relating to data analysis and reports. Go ahead and add charm to your presentations.
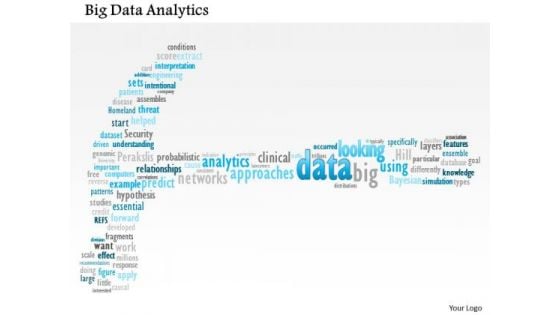
Business Framework Big Data Analytics PowerPoint Presentation
This unique power point diagram slide has been crafted with big data analytics. This data analytics is used to improve predictions and support decision making. Use this image slide for big data analysis related presentations.
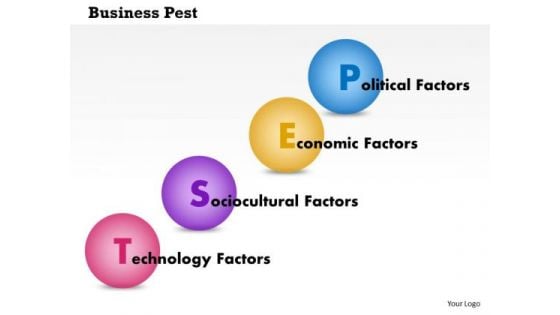
Business Framework Business Pest PowerPoint Presentation
Display social ,economic, social and technological status of any company with our PEST business framework Power Point slide. This PPTslide has been crafted with sequential order of PEST analysis. Use this PPT slide and get good comments on your efforts.
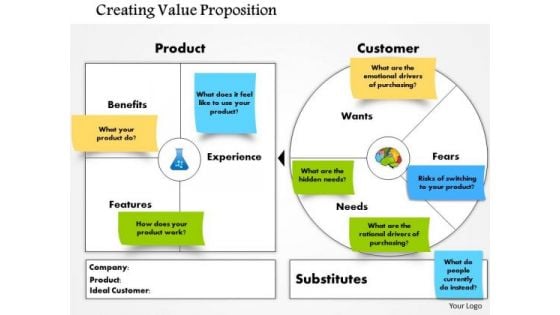
Business Framework Creating Value Proposition PowerPoint Presentation
This innovative image slide has been designed to display product value propositions. This business framework template may be used in your presentations to display research and analysis in marketing. This image slide will enhance the quality of your presentations.

Business Framework Customer Growth Matrix PowerPoint Presentation
This innovative image slide has been designed to display marketing growth matrix. This business framework template may be used in your presentations to depict business marketing research analysis. This image slide will enhance the quality of your presentations.
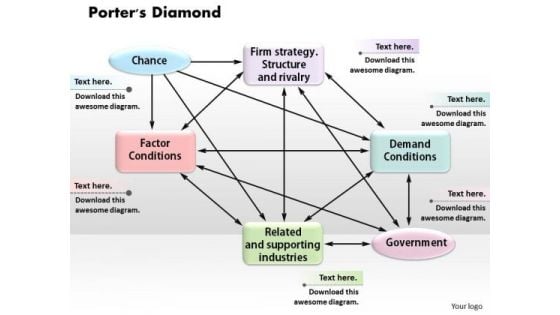
Business Framework Porters Diamond PowerPoint Presentation
This business framework image slide displays Porter's analysis diamond model template. Use this image slide, in your presentations to depicts theory of why particular industries become competitive in particular locations. This image slide will enhance the quality of your presentations.
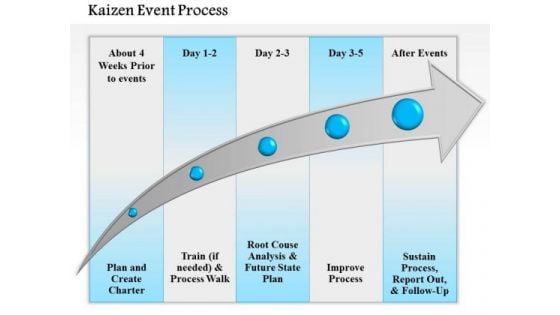
Business Diagram Kaizen Event Process PowerPoint Ppt Presentation
This business slide displays framework of kaizen event process. It contains graphics of arrow with five points depicting plan process, train process walk, root cause analysis, improve process and sustain process. Download this diagram as a tool for business presentations.
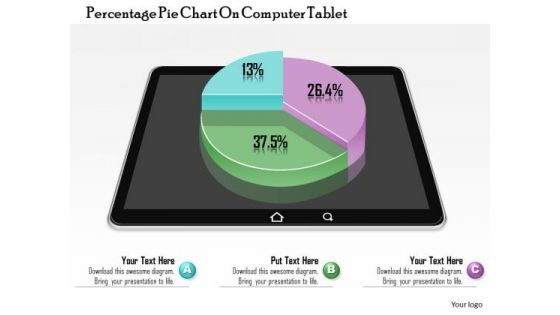
Business Diagram Percentage Pie Chart On Computer Tablet Presentation Slide Template
This business diagram power point template has been designed with graphic of pie chart. This pie chart contains the various percentage values for business result analysis. Use this pie chart for your business result display related presentations.
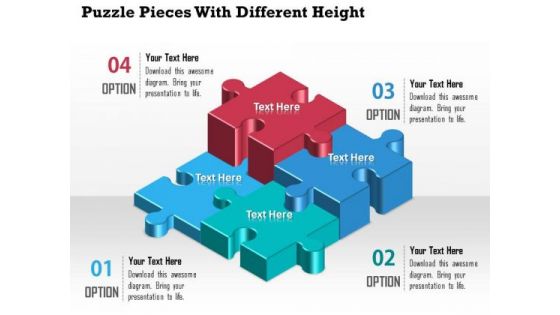
Business Diagram Puzzle Pieces With Different Height Presentation Template
A professional bar graph has been crafted with graphic of puzzles. All these puzzles are in different heights which shows the various levels of any data result representations. Use this diagram for your business result and data analysis related topics.
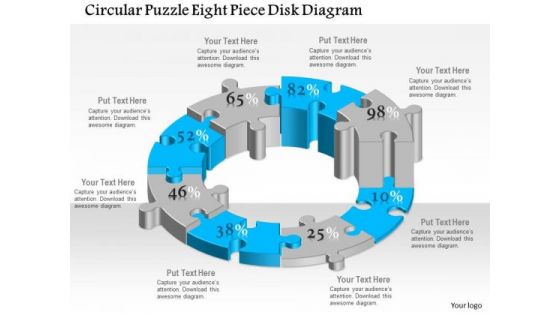
Business Diagram Circular Puzzle Eight Piece Disk Diagram Presentation Template
This business plan power point template has been designed with six staged circular puzzle diagram. This diagram template contains the concept of business process flow and result analysis representation. Use this diagram in your presentation and show these concepts.
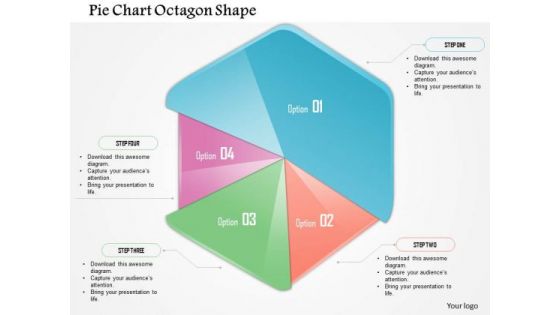
Business Diagram Pie Chart Octagon Shape Presentation Template
This business plan power point template has been designed with pie chart in octagon shape. This PPT contains the concept of result analysis for any business process. Use this PPT for business and sales related presentations.
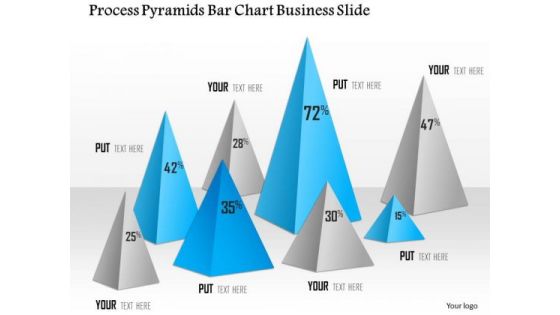
Business Diagram Process Pyramids Bar Chart Business Slide Presentation Template
Graphic of pyramid and bar chart has been used to design this power point template diagram. This PPT diagram contains the concept of business result analysis and process flow. Use this template slide and display result in your presentations.

Business Framework Business Brand Anchor PowerPoint Presentation
Explain the concept of new idea generation with this exclusive PPT slide. This PPT contain the graphic of two bulbs making a Venn diagram. This PPT can be used for any business presentation to representation result analysis.
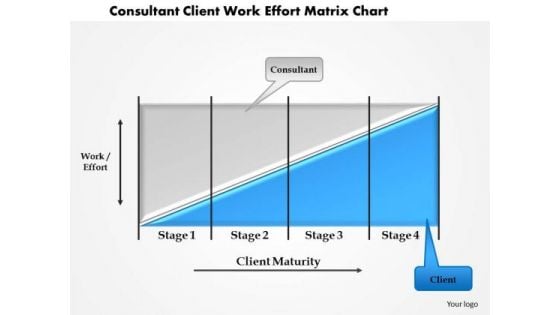
Business Framework Consultant Client Work Effort Matrix Chart PowerPoint Presentation
This business power point template slide has been crafted with graphic of bar graph. This bar graph is called as coase theorem. Use this professional diagram for your result analysis related presentation.
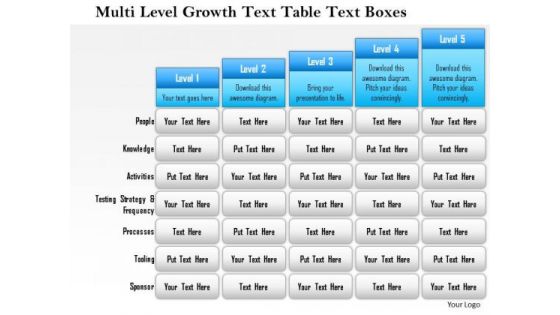
Business Framework Multi Level Growth Text Table Text Boxes 2 PowerPoint Presentation
Five staged text box style chart in bar graph design has been used to decorate this power point template slide. This diagram slide contains the multilevel growth concept. Use this PPT slide for financial growth and result analysis related topics.
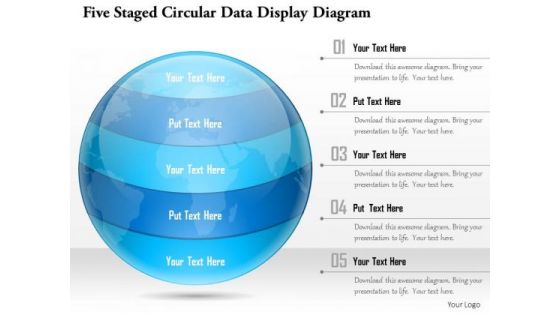
Business Diagram Five Staged Circular Data Display Diagram Presentation Template
This Power Point template slide has been crafted with graphic of five staged circular diagram. This PPT slide contains the concept of data analysis and representation. This PPT slide can be used for business data presentations.
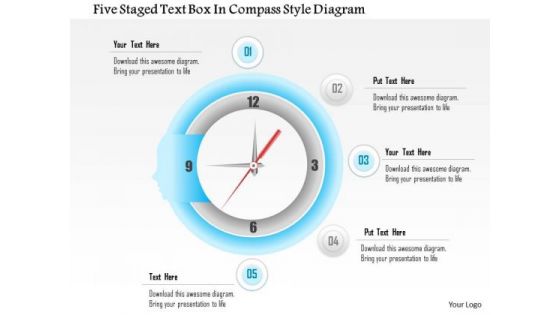
Business Diagram Five Staged Text Box In Compass Style Diagram Presentation Template
This Power Point template slide has been designed with graphic of five staged text boxes. This PPT slide contains the compass style diagram. This PPT slide can display data analysis. Use this PPT slide for your business presentations.
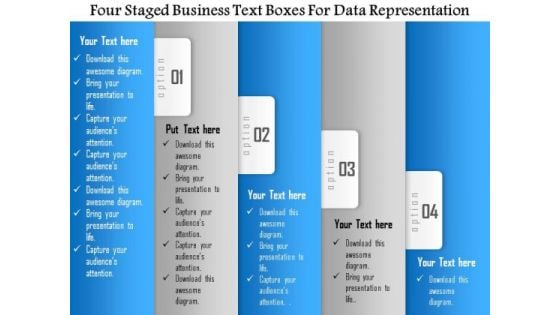
Business Diagram Four Staged Business Text Boxes For Data Representation Presentation Template
Four staged business text boxes are used to design this Power Point template slide. This PPT slide contains the concept of data representation. Use this PPT slide for your business and sales data analysis related topics in any presentation.
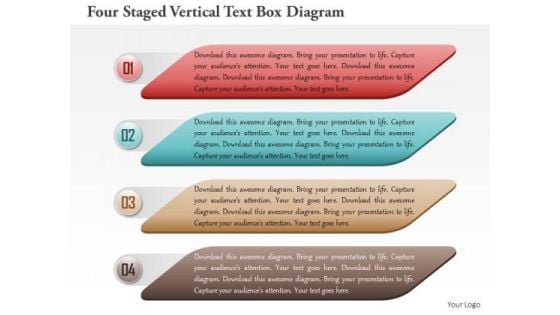
Business Diagram Four Staged Vertical Text Box Diagram Presentation Template
This PPT slide contains the concept of business data analysis. This Power Point template slide has been designed with graphic of four staged vertical text boxes diagram. Use this PPT slide and build an innovative presentation for your viewers.

Business Diagram Seven Staged Circular Ribbon Text Box Diagram Presentation Template
This Power Point template slide has been used to display the concept of business data analysis. This PPT slide contains the graphic of seven staged circular ribbon style text boxes. Use this PPT slide for your business presentations.
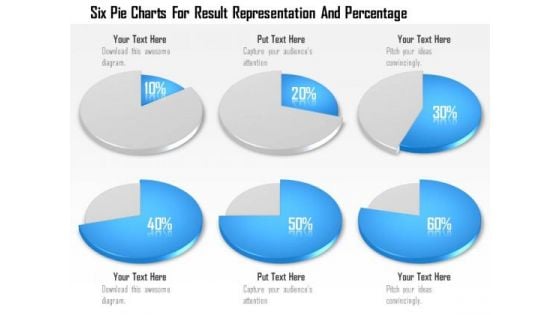
Business Diagram Six Pie Charts For Result Representation And Percentage Presentation Template
Display the concept of result analysis in your business presentation. This PPT slide contains the graphic of six pie charts. Use this PPT slide for your business and marketing data related presentations.
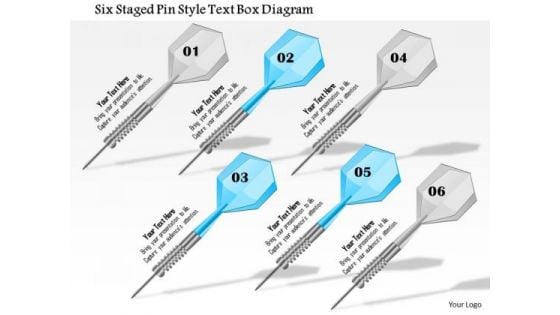
Business Diagram Six Staged Pin Style Text Box Diagram Presentation Template
This Power Point template slide has been crafted with graphic of six staged pin style text boxes. This PPT slide contain the concept of sales data analysis. Use this PPT slide for your business and sales related presentations.
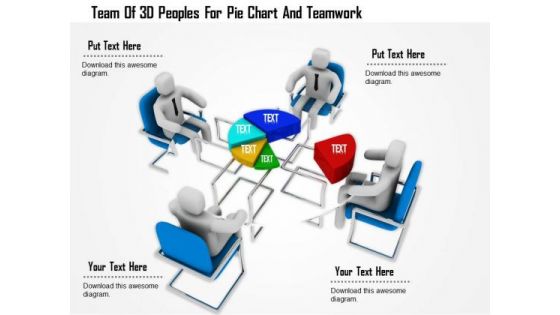
Team Of 3d Peoples For Pie Chart And Teamwork
This Power Point template has been designed with graphic of 3d team forming a pie chart. In this slide team is displaying data analysis. Use this editable slide to build innovative presentation for your viewers.
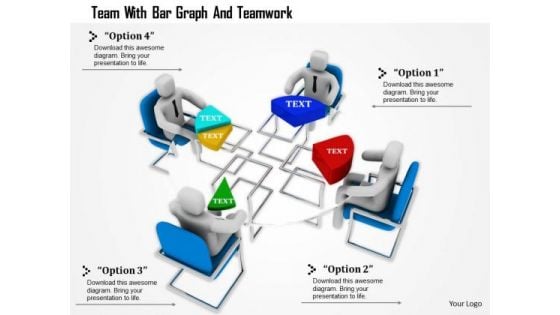
Team With Bar Graph And Teamwork
This Power Point template has been designed with graphic of 3d team forming a pie chart. In this slide team is displaying data analysis and comparison. Use this editable slide to build innovative presentation for your viewers.

Stock Photo Golden Dollar Symbol With Pie Graph PowerPoint Slide
This Power Point template has been crafted with graphic of golden dollar symbol and pie chart on a tablet. Display the concept of financial data analysis with this image. Use this image to present financial reports in business presentations.
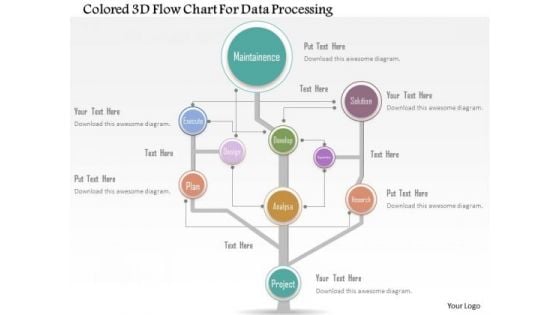
Business Diagram Colored 3d Flow Chart For Data Processing Presentation Template
Colored 3d flow chart has been used to design this power point template. This PPT contains the concept of data processing. Use this PPT for your data communication and analysis related presentations.
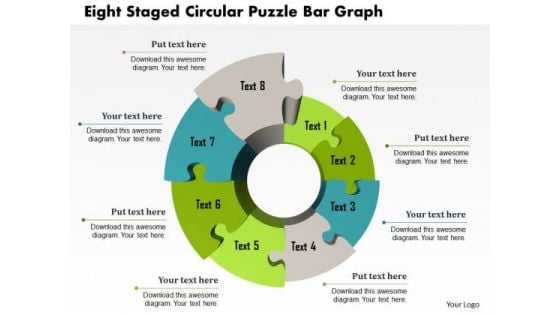
Business Diagram Eight Staged Circular Puzzle Bar Graph Presentation Template
This Power Point template has been crafted with graphic of eight staged circular puzzle and bar graph. This PPT contains the financial result analysis related concept. Use this PPT for your business and success related presentations.
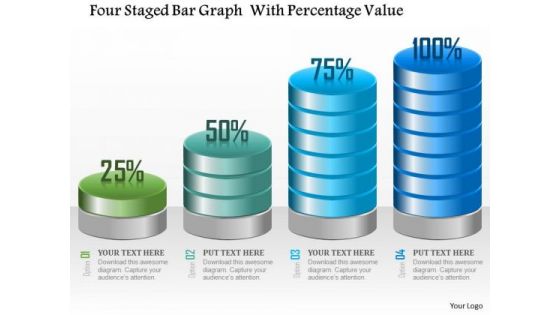
Business Diagram Four Staged Bar Graph With Percentage Value Presentation Template
Four staged bar graph with percentage value has been used to craft this power point template. This PPT contains the concept of making financial timeline and result analysis. This PPT can be used for business and finance related presentations.
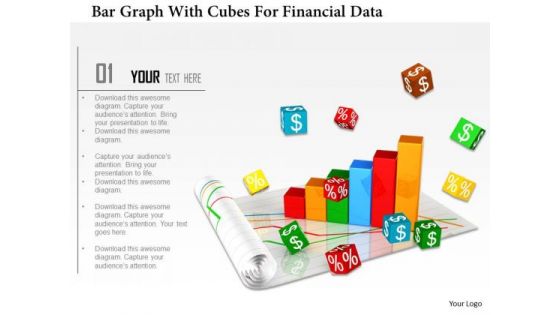
Stock Photo Bar Graph With Cubes For Financial Data PowerPoint Slide
Graphic of bar graph and cubes are used to decorate this image template. This PPT contains the concept of financial data analysis. Use this PPT for finance and business related presentations.
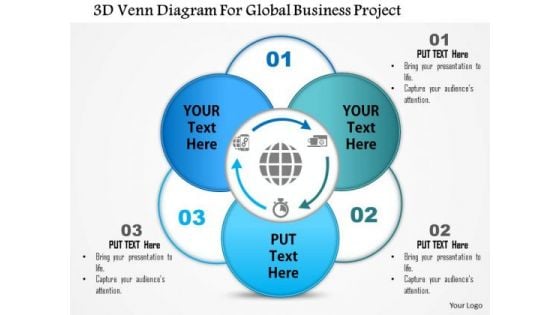
Business Diagram 3d Venn Diagram For Global Business Project Presentation Template
This business diagram displays 3d Venn diagram. This editable slide is suitable to present business reports. Use this diagram for business and finance related topics and display complete data analysis in your presentation.

Business Diagram Business Workflow Layout Diagram For Process Flow Presentation Template
This business diagram displays graphic of multiple business icons around globe. This power point template contains the concept of business analysis and research. Use this diagram to build unique presentation for your viewers.
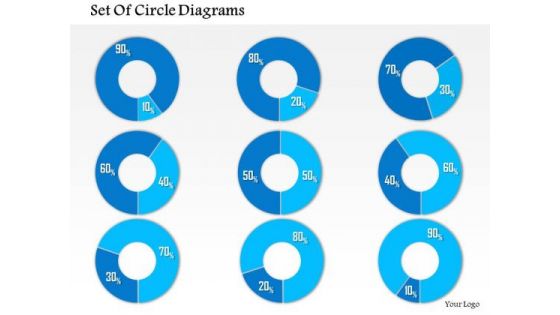
Business Framework 10 Percent To 90 Percent PowerPoint Presentation
This business diagram has been designed with graphic of multiple pie graphs. This diagram slide contains the concept of result analysis with percentage values. Use this diagram to present and compare data in an impressive manner
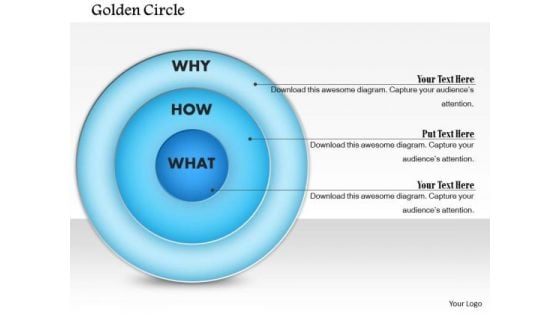
Business Framework Golden Circle PowerPoint Presentation
This business diagram has been designed with graphic of blue colored circle. This business slide is suitable to display data analysis in any business presentation. Use this slide to build a unique presentations for your viewers
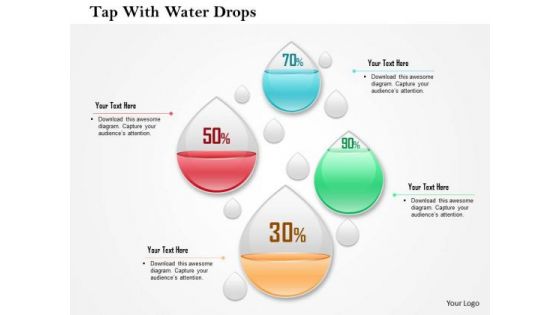
Business Diagram Four Water Drops With Percentage Values Presentation Template
This business diagram has been designed with graphic of four water drops and percentage values. This slide may be used to display percentage values for business analysis. Use this editable diagram for finance and business related presentations.
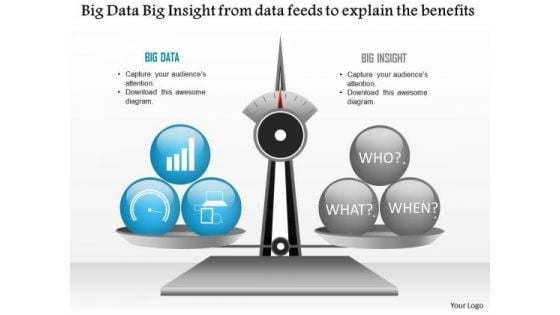
Business Diagram Big Data Big Insight From Data Feeds To Explain The Benefits Ppt Slide
Explain the benefits of big data analysis and data feeds with this technology diagram. This slide contains the graphic of scale with big data and big insight. Use this slide your data information and measurement related presentations.
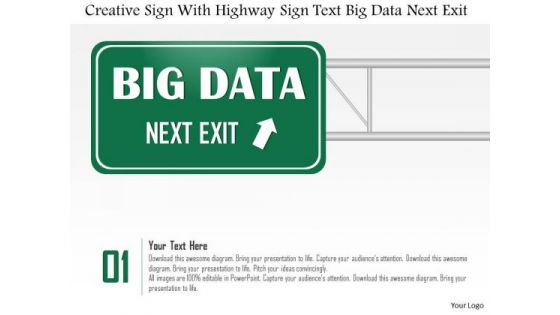
Business Diagram Creative Sign With Highway Sign Text Big Data Next Exit Ppt Slide
This diagram has been designed with graphic of magnifier and text boxes. These boxes are used to display creative sign and highway sign for big data analysis. This diagram can be used for data related topics in any presentation.
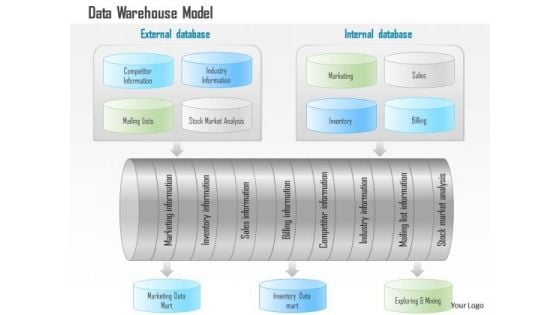
Business Diagram Data Warehouse Model With Analytics And Business Intelligence Ppt Slide
This technology diagram has been designed with graphic of data warehouse model. This model depicts concept of business intelligence and analysis. Download this editable slide build an exclusive presentation.
Business Diagram Exponentially Growing Big Data With Icons Surrounding Cloud Ppt Slide
This slide contains the graphic of clouds and icons. This diagram has been designed with concept of big data growth. This diagram displays the exponential growth of data analysis. Use this diagram slide for your data technology related presentations.
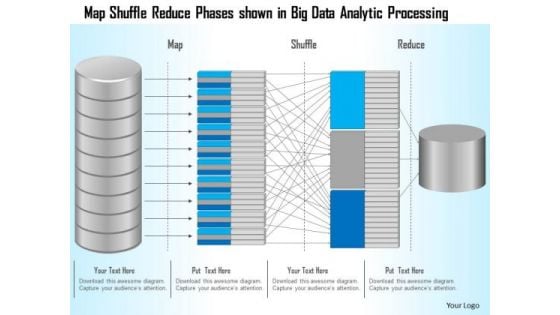
Business Diagram Map Shuffle Reduce Phases Shown In Big Data Analytic Processing Ppt Slide
This technology slide has been designed with graphic of map and data text. This diagram helps to depict concept of data analysis and processing. Use this diagram slide for computer technology related presentations.
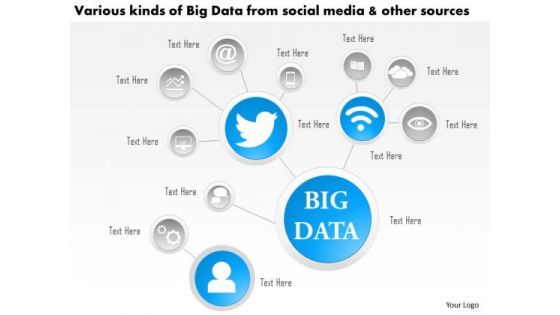
Business Diagram Various Kinds Of Big Data From Social Media And Other Sources Ppt Slide
This technology diagram contains the concept of big data analysis. This slide depicts various kinds of social media and other sources. Use this diagram for mobile and communication related presentations.
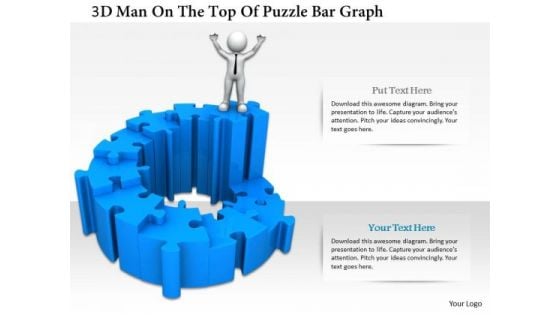
3d Man On The Top Of Puzzle Bar Graph
This PPT has been designed with graphic of 3d man and puzzle are graph. This PPT displays the concept of result analysis and financial growth. Use this PPT for your business and finance related presentations.
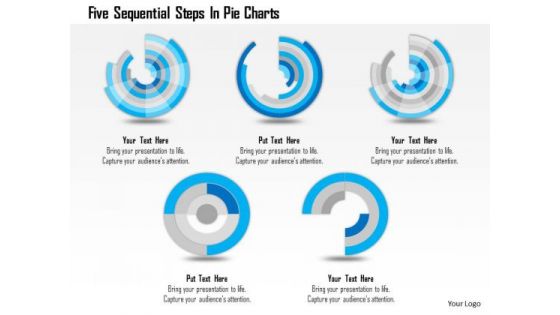
Business Diagram Five Sequential Steps In Pie Charts Presentation Template
Five sequential pie charts are used to craft this power point template. This PPT contains the concept of process flow and result analysis. Use this PPT for your business and sales related presentations and build quality presentation for your viewers.
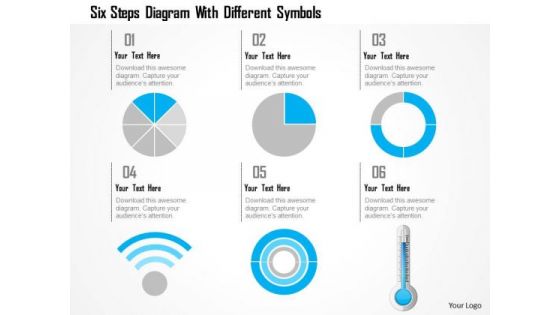
Business Diagram Six Steps Diagram With Different Symbols Presentation Template
This power point template has been crafted with graphic of 3d pie charts with Wi-Fi symbol and thermometer. This PPT contains the concept of calculation and result analysis. Use this PPT for your business and science related presentations.
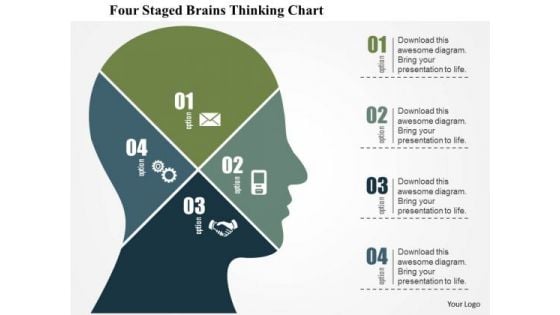
Business Diagram Four Staged Brains Thinking Chart Presentation Template
Graphic of four staged chart in human brain has been used to design this business diagram. This slide depicts concept of thinking process and analysis. Make your presentation more interactive with this business slide.
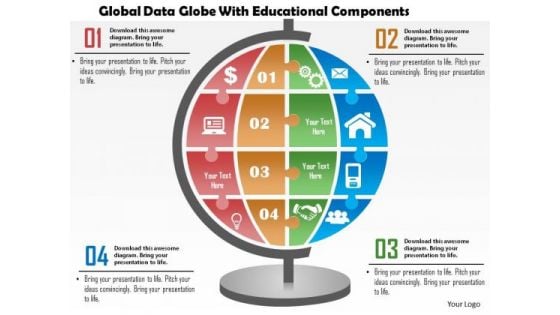
Business Diagram Global Data Globe With Educational Components Presentation Template
This business diagram has been designed with graphic of globe with icons. Use our diagram slide to organize data and to display data analysis. This diagram is suitable for global business and marketing related presentations.


 Continue with Email

 Home
Home


