Bar Graph
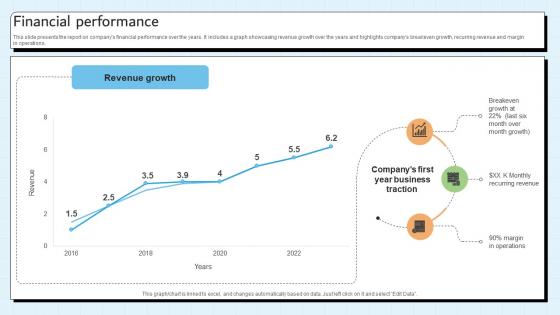
Financial Performance Customer Relationship Management Platform Pitch Deck
This slide presents the report on companys financial performance over the years. It includes a graph showcasing revenue growth over the years and highlights companys breakeven growth, recurring revenue and margin in operations. Present like a pro with Financial Performance Customer Relationship Management Platform Pitch Deck. Create beautiful presentations together with your team, using our easy-to-use presentation slides. Share your ideas in real-time and make changes on the fly by downloading our templates. So whether you are in the office, on the go, or in a remote location, you can stay in sync with your team and present your ideas with confidence. With Slidegeeks presentation got a whole lot easier. Grab these presentations today. This slide presents the report on companys financial performance over the years. It includes a graph showcasing revenue growth over the years and highlights companys breakeven growth, recurring revenue and margin in operations.

Increasing Business Awareness Introducing Digital Marketing Strategy SS V
This slide presents the importance of digital marketing in insurance promotion. It includes a graph showing the market growth of digital advertising with key insights and key statistics. Are you searching for a Increasing Business Awareness Introducing Digital Marketing Strategy SS V that is uncluttered, straightforward, and original Its easy to edit, and you can change the colors to suit your personal or business branding. For a presentation that expresses how much effort you have put in, this template is ideal With all of its features, including tables, diagrams, statistics, and lists, its perfect for a business plan presentation. Make your ideas more appealing with these professional slides. Download Increasing Business Awareness Introducing Digital Marketing Strategy SS V from Slidegeeks today. This slide presents the importance of digital marketing in insurance promotion. It includes a graph showing the market growth of digital advertising with key insights and key statistics.
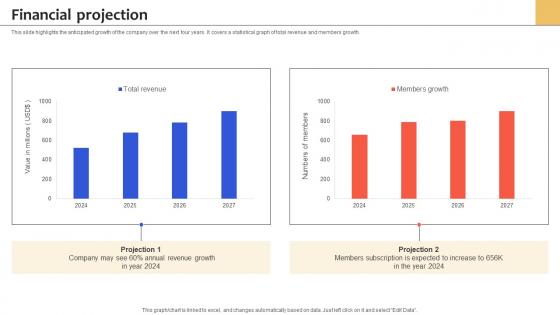
Financial Projection Health Insurance Services Management Platform Pitch Deck
This slide highlights the anticipated growth of the company over the next four years. It covers a statistical graph of total revenue and members growth. Slidegeeks is here to make your presentations a breeze with Financial Projection Health Insurance Services Management Platform Pitch Deck With our easy-to-use and customizable templates, you can focus on delivering your ideas rather than worrying about formatting. With a variety of designs to choose from, you are sure to find one that suits your needs. And with animations and unique photos, illustrations, and fonts, you can make your presentation pop. So whether you are giving a sales pitch or presenting to the board, make sure to check out Slidegeeks first This slide highlights the anticipated growth of the company over the next four years. It covers a statistical graph of total revenue and members growth.
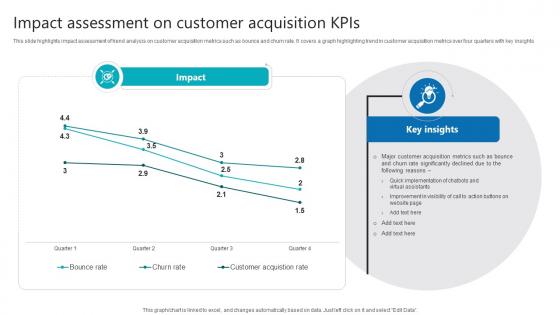
Impact Assessment On Customer Acquisition Kpis Product Analytics Implementation Data Analytics V
This slide highlights impact assessment of trend analysis on customer acquisition metrics such as bounce and churn rate. It covers a graph highlighting trend in customer acquisition metrics over four quarters with key insights The Impact Assessment On Customer Acquisition Kpis Product Analytics Implementation Data Analytics V is a compilation of the most recent design trends as a series of slides. It is suitable for any subject or industry presentation, containing attractive visuals and photo spots for businesses to clearly express their messages. This template contains a variety of slides for the user to input data, such as structures to contrast two elements, bullet points, and slides for written information. Slidegeeks is prepared to create an impression. This slide highlights impact assessment of trend analysis on customer acquisition metrics such as bounce and churn rate. It covers a graph highlighting trend in customer acquisition metrics over four quarters with key insights
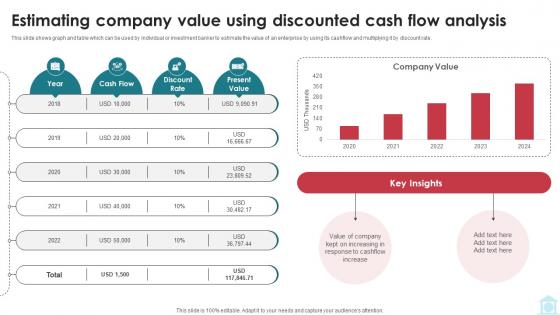
Estimating Company Value Using Discounted Cash Mastering Investment Banking Fin SS V
This slide shows graph and table which can be used by individual or investment banker to estimate the value of an enterprise by using its cashflow and multiplying it by discount rate. Coming up with a presentation necessitates that the majority of the effort goes into the content and the message you intend to convey. The visuals of a PowerPoint presentation can only be effective if it supplements and supports the story that is being told. Keeping this in mind our experts created Estimating Company Value Using Discounted Cash Mastering Investment Banking Fin SS V to reduce the time that goes into designing the presentation. This way, you can concentrate on the message while our designers take care of providing you with the right template for the situation. This slide shows graph and table which can be used by individual or investment banker to estimate the value of an enterprise by using its cashflow and multiplying it by discount rate.

Estimating Company Value Using Investment Banking Simplified Functions Fin SS V
This slide shows graph and table which can be used by individual or investment banker to estimate the value of an enterprise by using its cashflow and multiplying it by discount rate. Coming up with a presentation necessitates that the majority of the effort goes into the content and the message you intend to convey. The visuals of a PowerPoint presentation can only be effective if it supplements and supports the story that is being told. Keeping this in mind our experts created Estimating Company Value Using Investment Banking Simplified Functions Fin SS V to reduce the time that goes into designing the presentation. This way, you can concentrate on the message while our designers take care of providing you with the right template for the situation. This slide shows graph and table which can be used by individual or investment banker to estimate the value of an enterprise by using its cashflow and multiplying it by discount rate.
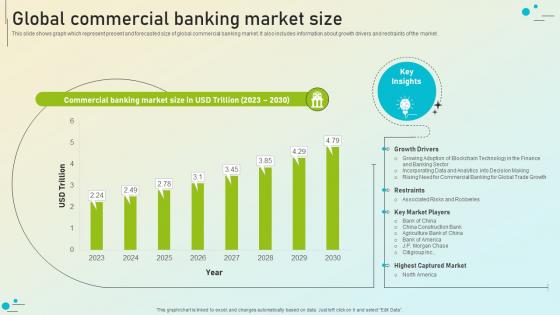
Beginners Guide To Commercial Global Commercial Banking Market Size Fin SS V
This slide shows graph which represent present and forecasted size of global commercial banking market. It also includes information about growth drivers and restraints of the market. The Beginners Guide To Commercial Global Commercial Banking Market Size Fin SS V is a compilation of the most recent design trends as a series of slides. It is suitable for any subject or industry presentation, containing attractive visuals and photo spots for businesses to clearly express their messages. This template contains a variety of slides for the user to input data, such as structures to contrast two elements, bullet points, and slides for written information. Slidegeeks is prepared to create an impression. This slide shows graph which represent present and forecasted size of global commercial banking market. It also includes information about growth drivers and restraints of the market.
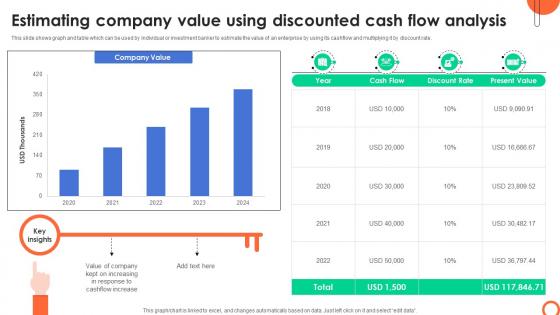
Estimating Company Value Using Discounted Understanding Investment Banking Framework Fin SS V
This slide shows graph and table which can be used by individual or investment banker to estimate the value of an enterprise by using its cashflow and multiplying it by discount rate. Coming up with a presentation necessitates that the majority of the effort goes into the content and the message you intend to convey. The visuals of a PowerPoint presentation can only be effective if it supplements and supports the story that is being told. Keeping this in mind our experts created Estimating Company Value Using Discounted Understanding Investment Banking Framework Fin SS V to reduce the time that goes into designing the presentation. This way, you can concentrate on the message while our designers take care of providing you with the right template for the situation. This slide shows graph and table which can be used by individual or investment banker to estimate the value of an enterprise by using its cashflow and multiplying it by discount rate.
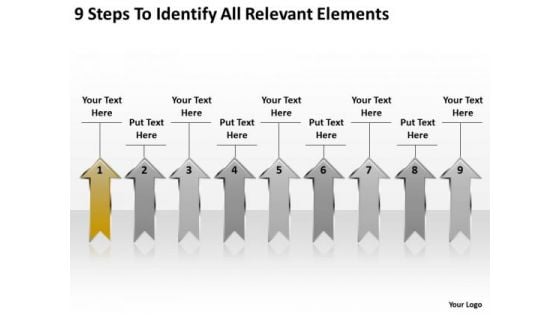
Parallel Arrows PowerPoint 9 Steps To Identify Relevant Elements Templates
We present our parallel arrows powerpoint 9 steps to identify relevant elements templates.Download our Process and Flows PowerPoint Templates because It will Raise the bar of your Thoughts. They are programmed to take you to the next level. Present our Flow Charts PowerPoint Templates because It can be used to Set your controls for the heart of the sun. Our PowerPoint Templates and Slides will be the propellant to get you there. Use our Success PowerPoint Templates because Our PowerPoint Templates and Slides team portray an attitude of elegance. Personify this quality by using them regularly. Download and present our Arrows PowerPoint Templates because You should Bet on your luck with our PowerPoint Templates and Slides. Be assured that you will hit the jackpot. Download and present our Shapes PowerPoint Templates because Our PowerPoint Templates and Slides are specially created by a professional team with vast experience. They diligently strive to come up with the right vehicle for your brilliant Ideas. Use these PowerPoint slides for presentations relating to Arrow, business, concept, control, creative, curl, customer, design,direction, element, green, icon, illustration, infographic, label, layout, mark,marketing, message, new, number, offer, one, paper, product, service, set,shadow, shop, sign, site, step, sticker, symbol, tag, three, two, vector, web, white. The prominent colors used in the PowerPoint template are Yellow, Gray, White. Presenters tell us our parallel arrows powerpoint 9 steps to identify relevant elements templates provide you with a vast range of viable options. Select the appropriate ones and just fill in your text. Presenters tell us our creative PowerPoint templates and PPT Slides will make you look like a winner. Customers tell us our parallel arrows powerpoint 9 steps to identify relevant elements templates are visually appealing. Use our creative PowerPoint templates and PPT Slides are readymade to fit into any presentation structure. Customers tell us our parallel arrows powerpoint 9 steps to identify relevant elements templates are specially created by a professional team with vast experience. They diligently strive to come up with the right vehicle for your brilliant Ideas. Presenters tell us our direction PowerPoint templates and PPT Slides are aesthetically designed to attract attention. We guarantee that they will grab all the eyeballs you need. Reorganize your team with our Parallel Arrows PowerPoint 9 Steps To Identify Relevant Elements Templates. Download without worries with our money back guaranteee.
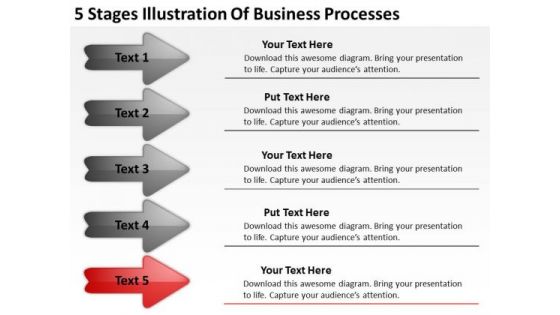
Business PowerPoint Presentations Processes Ppt Start Up Plan Slides
We present our business powerpoint presentations processes ppt start up plan Slides.Download our Process and flows PowerPoint Templates because Our PowerPoint Templates and Slides will embellish your thoughts. See them provide the desired motivation to your team. Download and present our Flow Charts PowerPoint Templates because You aspire to touch the sky with glory. Let our PowerPoint Templates and Slides provide the fuel for your ascent. Present our Arrows PowerPoint Templates because Our PowerPoint Templates and Slides will provide weight to your words. They will bring out the depth of your thought process. Present our Marketing PowerPoint Templates because Our PowerPoint Templates and Slides will Activate the energies of your audience. Get their creative juices flowing with your words. Download and present our Shapes PowerPoint Templates because Our PowerPoint Templates and Slides are aesthetically designed to attract attention. We gaurantee that they will grab all the eyeballs you need.Use these PowerPoint slides for presentations relating to Arrows, flow charts, process and flows, marketing, stepes, shapes, future, symbol, charts, design, direction, flow, illustration, increase, info graphic, color, colorful, concept, control, creative, curl, customer, design, direction, element, blue, icon, illustration, label. The prominent colors used in the PowerPoint template are Red, Black, White. Customers tell us our business powerpoint presentations processes ppt start up plan Slides are designed to make your presentations professional. Presenters tell us our marketing PowerPoint templates and PPT Slides provide great value for your money. Be assured of finding the best projection to highlight your words. Use our business powerpoint presentations processes ppt start up plan Slides will impress their bosses and teams. You can be sure our stepes PowerPoint templates and PPT Slides will make you look like a winner. The feedback we get is that our business powerpoint presentations processes ppt start up plan Slides will make the presenter look like a pro even if they are not computer savvy. We assure you our stepes PowerPoint templates and PPT Slides are aesthetically designed to attract attention. We guarantee that they will grab all the eyeballs you need. Set an example with your views. Place the bar with our Business PowerPoint Presentations Processes Ppt Start Up Plan Slides.
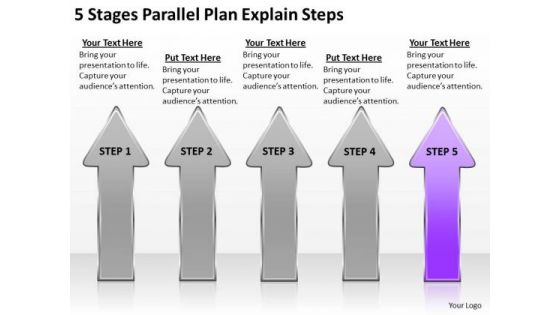
5 Stages Parallel Plan Explain Steps Ppt Example Business Outline PowerPoint Slides
We present our 5 stages parallel plan explain steps ppt example business outline PowerPoint Slides.Use our Process and Flows PowerPoint Templates because Our PowerPoint Templates and Slides will provide the perfect balance. Your weighty ideas will get the ideal impetus. Use our Arrows PowerPoint Templates because you should Experience excellence with our PowerPoint Templates and Slides. They will take your breath away. Present our Marketing PowerPoint Templates because You can Be the puppeteer with our PowerPoint Templates and Slides as your strings. Lead your team through the steps of your script. Use our Business PowerPoint Templates because It will Raise the bar of your Thoughts. They are programmed to take you to the next level. Present our Flow Charts PowerPoint Templates because Our PowerPoint Templates and Slides will let your words and thoughts hit bullseye everytime.Use these PowerPoint slides for presentations relating to Arrow, blue, choice, concept,creative, design, direction, flow, four,illustration, infographic, instruction, manual, marketing, modern ,number, offer, options, pointer, process, product,promotion, sequence, simple, special,step, symbol. The prominent colors used in the PowerPoint template are Purple, Gray, Black. You can be sure our 5 stages parallel plan explain steps ppt example business outline PowerPoint Slides effectively help you save your valuable time. You can be sure our four PowerPoint templates and PPT Slides will generate and maintain the level of interest you desire. They will create the impression you want to imprint on your audience. Professionals tell us our 5 stages parallel plan explain steps ppt example business outline PowerPoint Slides are effectively colour coded to prioritise your plans They automatically highlight the sequence of events you desire. Presenters tell us our design PowerPoint templates and PPT Slides will impress their bosses and teams. The feedback we get is that our 5 stages parallel plan explain steps ppt example business outline PowerPoint Slides will make the presenter successul in his career/life. You can be sure our four PowerPoint templates and PPT Slides have awesome images to get your point across. Award yourself with our 5 Stages Parallel Plan Explain Steps Ppt Example Business Outline PowerPoint Slides. You deserve to deal with the best.
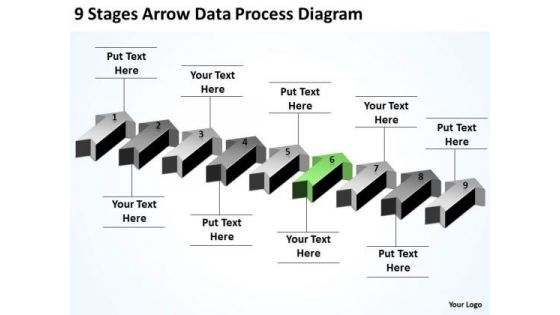
Parallel Data Processing 9 Stages Arrow Diagram PowerPoint Slides
We present our parallel data processing 9 stages arrow diagram PowerPoint Slides.Download and present our Arrows PowerPoint Templates because You should Press the right buttons with our PowerPoint Templates and Slides. They will take your ideas down the perfect channel. Download and present our Steps PowerPoint Templates because It will Give impetus to the hopes of your colleagues. Our PowerPoint Templates and Slides will aid you in winning their trust. Use our Process and Flows PowerPoint Templates because Our PowerPoint Templates and Slides will generate and maintain the level of interest you desire. They will create the impression you want to imprint on your audience. Use our Future PowerPoint Templates because It will Raise the bar of your Thoughts. They are programmed to take you to the next level. Download and present our Flow Charts PowerPoint Templates because It can be used to Set your controls for the heart of the sun. Our PowerPoint Templates and Slides will be the propellant to get you there.Use these PowerPoint slides for presentations relating to Advertising, arrow, blue, concept,creative, design, direction, flow, green,illustration, increase, infographic,instruction, label, layout, manual,modern, number, offer, one, options,order, page, paper, pointer, product,progress, promotion, sequence, simple,special, step, symbol. The prominent colors used in the PowerPoint template are Green lime, White, Gray. Presenters tell us our parallel data processing 9 stages arrow diagram PowerPoint Slides are visually appealing. Presenters tell us our concept PowerPoint templates and PPT Slides will make you look like a winner. Customers tell us our parallel data processing 9 stages arrow diagram PowerPoint Slides will impress their bosses and teams. Use our green PowerPoint templates and PPT Slides are second to none. Customers tell us our parallel data processing 9 stages arrow diagram PowerPoint Slides effectively help you save your valuable time. Presenters tell us our concept PowerPoint templates and PPT Slides are incredible easy to use. Excellence is an article of faith with our Parallel Data Processing 9 Stages Arrow Diagram PowerPoint Slides team. They give their all and more to achieve it.

Top Tenets Of Zero Trust Network Access Model Zero Trust Network Security Graphics Pdf
This graph chart is linked to excel, and changes automatically based on data. Just left click on it and select Edit Data. Do you have an important presentation coming up Are you looking for something that will make your presentation stand out from the rest Look no further than Top Tenets Of Zero Trust Network Access Model Zero Trust Network Security Graphics Pdf. With our professional designs, you can trust that your presentation will pop and make delivering it a smooth process. And with Slidegeeks, you can trust that your presentation will be unique and memorable. So why wait Grab Top Tenets Of Zero Trust Network Access Model Zero Trust Network Security Graphics Pdf today and make your presentation stand out from the rest This graph chart is linked to excel, and changes automatically based on data. Just left click on it and select Edit Data.
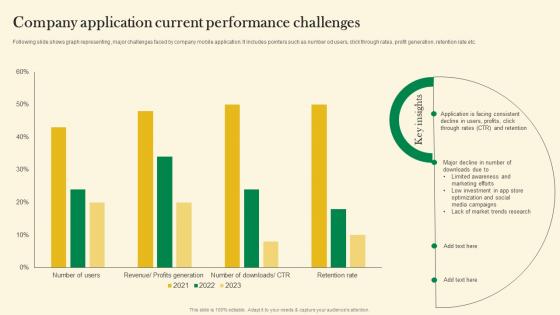
Company Application Current Performance Challenges Online Customer Acquisition Rules Pdf
Following slide shows graph representing ,major challenges faced by company mobile application. It includes pointers such as number od users, click through rates, profit generation, retention rate etc. Take your projects to the next level with our ultimate collection of Company Application Current Performance Challenges Online Customer Acquisition Rules Pdf Slidegeeks has designed a range of layouts that are perfect for representing task or activity duration, keeping track of all your deadlines at a glance. Tailor these designs to your exact needs and give them a truly corporate look with your own brand colors they well make your projects stand out from the rest. Following slide shows graph representing ,major challenges faced by company mobile application. It includes pointers such as number od users, click through rates, profit generation, retention rate etc.
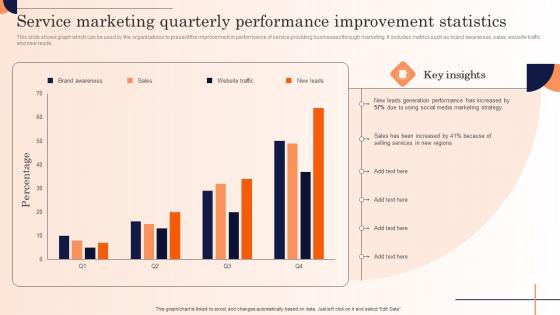
Service Marketing Quarterly Performance Strategic Marketing Campaign Demonstration Pdf
This slide shows graph which can be used by the organizations to present the improvement in performance of service providing businesses through marketing. It includes metrics such as brand awareness, sales, website traffic and new leads.Take your projects to the next level with our ultimate collection of Service Marketing Quarterly Performance Strategic Marketing Campaign Demonstration Pdf. Slidegeeks has designed a range of layouts that are perfect for representing task or activity duration, keeping track of all your deadlines at a glance. Tailor these designs to your exact needs and give them a truly corporate look with your own brand colors they all make your projects stand out from the rest. This slide shows graph which can be used by the organizations to present the improvement in performance of service providing businesses through marketing. It includes metrics such as brand awareness, sales, website traffic and new leads.
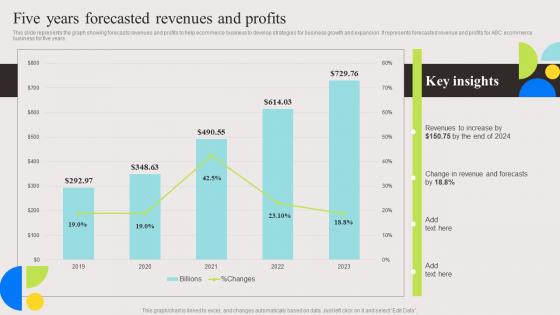
Five Years Forecasted Revenues And Evaluation And Deployment Of Enhanced Themes Pdf
This slide represents the graph showing forecasts revenues and profits to help ecommerce business to develop strategies for business growth and expansion. It represents forecasted revenue and profits for ABC ecommerce business for five years. Make sure to capture your audiences attention in your business displays with our gratis customizable Five Years Forecasted Revenues And Evaluation And Deployment Of Enhanced Themes Pdf. These are great for business strategies, office conferences, capital raising or task suggestions. If you desire to acquire more customers for your tech business and ensure they stay satisfied, create your own sales presentation with these plain slides. This slide represents the graph showing forecasts revenues and profits to help ecommerce business to develop strategies for business growth and expansion. It represents forecasted revenue and profits for ABC ecommerce business for five years.
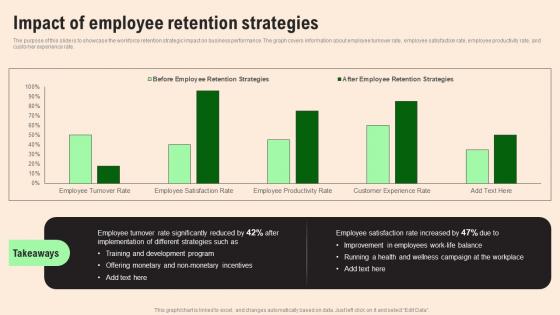
Impact Of Employee Retention HR Retention Techniques For Business Owners Structure Pdf
The purpose of this slide is to showcase the workforce retention strategic impact on business performance. The graph covers information about employee turnover rate, employee satisfaction rate, employee productivity rate, and customer experience rate. Take your projects to the next level with our ultimate collection of Impact Of Employee Retention HR Retention Techniques For Business Owners Structure Pdf. Slidegeeks has designed a range of layouts that are perfect for representing task or activity duration, keeping track of all your deadlines at a glance. Tailor these designs to your exact needs and give them a truly corporate look with your own brand colors they will make your projects stand out from the rest The purpose of this slide is to showcase the workforce retention strategic impact on business performance. The graph covers information about employee turnover rate, employee satisfaction rate, employee productivity rate, and customer experience rate.
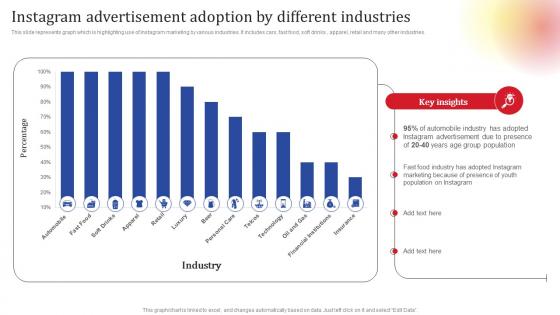
Instagram Advertisement Social Media Platform Advertising To Enhance Brand Awareness Infographics Pdf
This slide represents graph which is highlighting use of Instagram marketing by various industries. It includes cars, fast food, soft drinks , apparel, retail and many other industries. Do you have an important presentation coming up Are you looking for something that will make your presentation stand out from the rest Look no further than Instagram Advertisement Social Media Platform Advertising To Enhance Brand Awareness Infographics Pdf. With our professional designs, you can trust that your presentation will pop and make delivering it a smooth process. And with Slidegeeks, you can trust that your presentation will be unique and memorable. So why wait Grab Instagram Advertisement Social Media Platform Advertising To Enhance Brand Awareness Infographics Pdf today and make your presentation stand out from the rest This slide represents graph which is highlighting use of Instagram marketing by various industries. It includes cars, fast food, soft drinks , apparel, retail and many other industries.
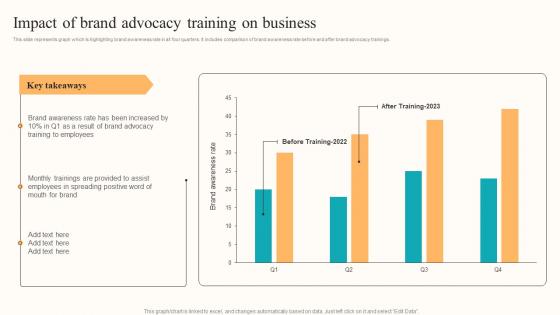
Impact Of Brand Advocacy Developing Employee Centric Marketing Program Background Pdf
This slide represents graph which is highlighting brand awareness rate in all four quarters. It includes comparison of brand awareness rate before and after brand advocacy trainings. Do you have an important presentation coming up Are you looking for something that will make your presentation stand out from the rest Look no further than Impact Of Brand Advocacy Developing Employee Centric Marketing Program Background Pdf. With our professional designs, you can trust that your presentation will pop and make delivering it a smooth process. And with Slidegeeks, you can trust that your presentation will be unique and memorable. So why wait Grab Impact Of Brand Advocacy Developing Employee Centric Marketing Program Background Pdf today and make your presentation stand out from the rest This slide represents graph which is highlighting brand awareness rate in all four quarters. It includes comparison of brand awareness rate before and after brand advocacy trainings.
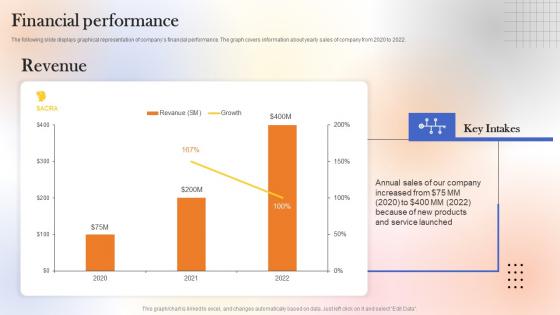
Financial Performance Web Designing Platform Fundraising Pitch Deck Download Pdf
The following slide displays graphical representation of companys financial performance. The graph covers information about yearly sales of company from 2020 to 2022. Do you have an important presentation coming up Are you looking for something that will make your presentation stand out from the rest Look no further than Financial Performance Web Designing Platform Fundraising Pitch Deck Download Pdf. With our professional designs, you can trust that your presentation will pop and make delivering it a smooth process. And with Slidegeeks, you can trust that your presentation will be unique and memorable. So why wait Grab Financial Performance Web Designing Platform Fundraising Pitch Deck Download Pdf today and make your presentation stand out from the rest The following slide displays graphical representation of companys financial performance. The graph covers information about yearly sales of company from 2020 to 2022.
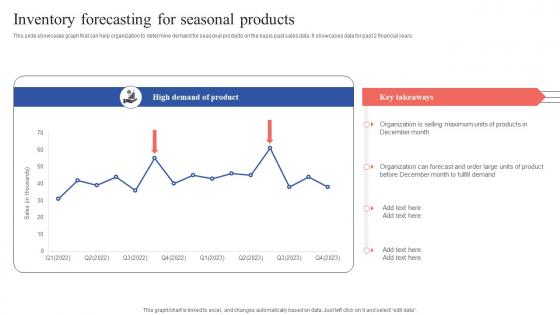
Inventory Forecasting For Seasonal Products Tactical Guide Stock Administration Formats Pdf
This slide showcases graph that can help organization to determine demand for seasonal products on the basis past sales data. It showcases data for past 2 financial years. Make sure to capture your audiences attention in your business displays with our gratis customizable Inventory Forecasting For Seasonal Products Tactical Guide Stock Administration Formats Pdf. These are great for business strategies, office conferences, capital raising or task suggestions. If you desire to acquire more customers for your tech business and ensure they stay satisfied, create your own sales presentation with these plain slides. This slide showcases graph that can help organization to determine demand for seasonal products on the basis past sales data. It showcases data for past 2 financial years.
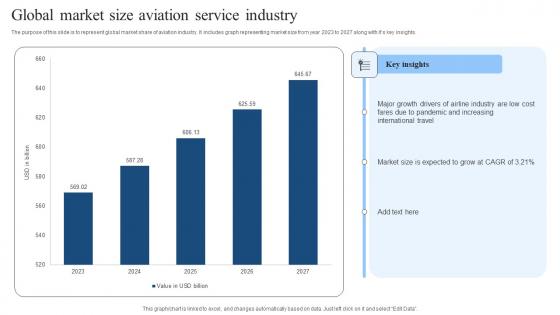
Global Market Size Aviation Service Industry Background Pdf
The purpose of this slide is to represent global market share of aviation industry. It includes graph representing market size from year 2023 to 2027 along with its key insights. Pitch your topic with ease and precision using this Global Market Size Aviation Service Industry Background Pdf. This layout presents information on Global Market Size, Aviation Service Industry. It is also available for immediate download and adjustment. So, changes can be made in the color, design, graphics or any other component to create a unique layout. The purpose of this slide is to represent global market share of aviation industry. It includes graph representing market size from year 2023 to 2027 along with its key insights.

Increasing Business Awareness Introducing Social Media Marketing For Creating Strategy SS V
This slide presents an overview of social media marketing. It also include a graph showcasing the associated benefits of social media for insurers such as marketing, customer service, new sales leads, fraud detection and risk selection. Take your projects to the next level with our ultimate collection of Increasing Business Awareness Introducing Social Media Marketing For Creating Strategy SS V. Slidegeeks has designed a range of layouts that are perfect for representing task or activity duration, keeping track of all your deadlines at a glance. Tailor these designs to your exact needs and give them a truly corporate look with your own brand colors they will make your projects stand out from the rest This slide presents an overview of social media marketing. It also include a graph showcasing the associated benefits of social media for insurers such as marketing, customer service, new sales leads, fraud detection and risk selection
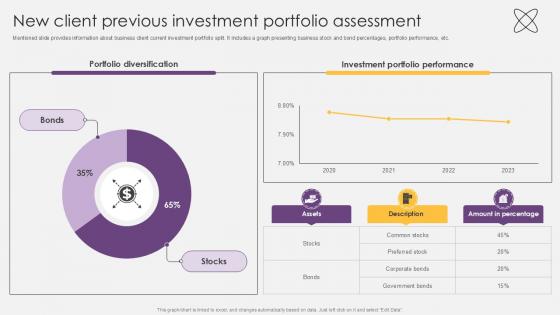
New Client Previous Investment Portfolio Assessment Investment Fund PPT Example
Mentioned slide provides information about business client current investment portfolio split.It includes a graph presenting business stock and bond percentages, portfolio performance, etc. This New Client Previous Investment Portfolio Assessment Investment Fund PPT Example from Slidegeeks makes it easy to present information on your topic with precision. It provides customization options, so you can make changes to the colors, design, graphics, or any other component to create a unique layout. It is also available for immediate download, so you can begin using it right away. Slidegeeks has done good research to ensure that you have everything you need to make your presentation stand out. Make a name out there for a brilliant performance. Mentioned slide provides information about business client current investment portfolio split.It includes a graph presenting business stock and bond percentages, portfolio performance, etc.
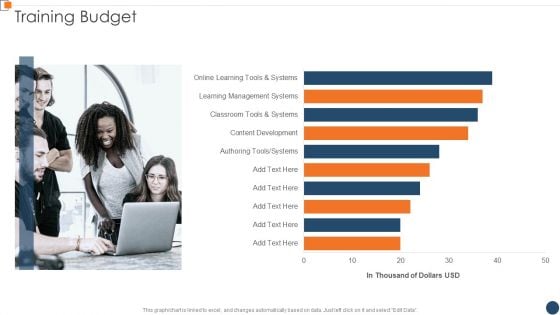
BANT Sales Lead Qualification Model Training Budget Template PDF
This graph or chart is linked to excel and change automatically based on data. Just left click on it and select Edit Data. Deliver an awe inspiring pitch with this creative BANT Sales Lead Qualification Model Training Budget Template PDF bundle. Topics like Content Development, Learning Management, Online Learning can be discussed with this completely editable template. It is available for immediate download depending on the needs and requirements of the user.
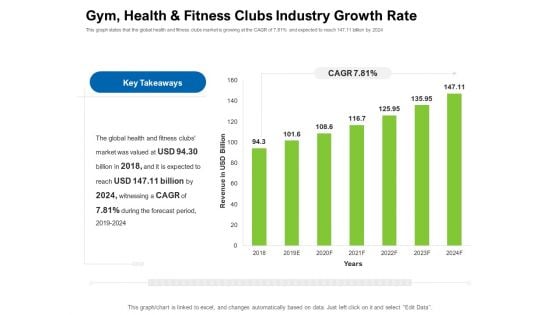
Strategies To Enter Physical Fitness Club Business Gym Health And Fitness Clubs Industry Growth Rate Summary PDF
This graph states that the global health and fitness clubs market is growing at the CAGR of 7.81 percent and expected to reach 147.11 billion by 2024. Deliver an awe inspiring pitch with this creative strategies to enter physical fitness club business gym health and fitness clubs industry growth rate summary pdf bundle. Topics like global, health, market, revenue can be discussed with this completely editable template. It is available for immediate download depending on the needs and requirements of the user.

Byjus Investor Capital Financing Pitch Deck Byjus Annual Revenue And Growth Rate Background PDF
This slide provides information about the annual revenue and growth rate of Byjus in terms of graph and line chart for 3 years.Deliver an awe inspiring pitch with this creative Byjus Investor Capital Financing Pitch Deck Byjus Annual Revenue And Growth Rate Background PDF bundle. Topics like Annual Revenue, Annual Growth, Previous Period can be discussed with this completely editable template. It is available for immediate download depending on the needs and requirements of the user.
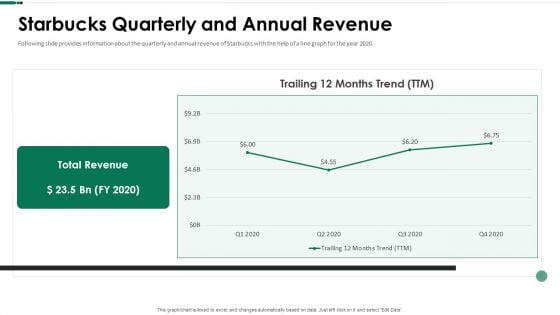
Starbucks Quarterly And Annual Revenue Ppt Slides Introduction PDF
Following slide provides information about the quarterly and annual revenue of Starbucks with the help of a line graph for the year 2020. Deliver and pitch your topic in the best possible manner with this starbucks quarterly and annual revenue ppt slides introduction pdf. Use them to share invaluable insights on starbucks quarterly and annual revenue and impress your audience. This template can be altered and modified as per your expectations. So, grab it now.
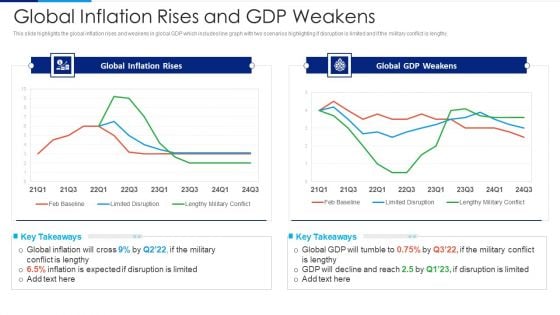
Russia Ukraine Conflict Effect Global Inflation Rises And Gdp Weakens Professional PDF
This slide highlights the global inflation rises and weakens in global GDP which includes line graph with two scenarios highlighting if disruption is limited and if the military conflict is lengthy. Deliver an awe inspiring pitch with this creative Russia Ukraine Conflict Effect Global Inflation Rises And Gdp Weakens Professional PDF bundle. Topics like Global Inflation Rises, Global GDP Weakens can be discussed with this completely editable template. It is available for immediate download depending on the needs and requirements of the user.
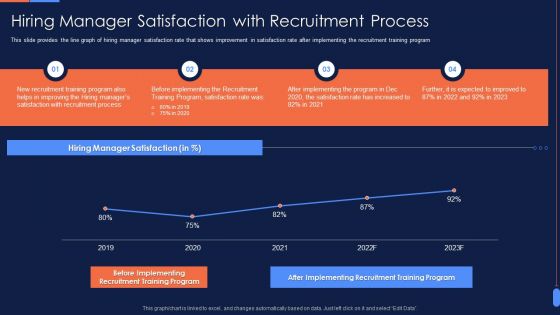
Recruitment Training To Optimize Hiring Manager Satisfaction With Recruitment Process Topics PDF
This slide provides the line graph of hiring manager satisfaction rate that shows improvement in satisfaction rate after implementing the recruitment training program. Deliver an awe inspiring pitch with this creative Recruitment Training To Optimize Hiring Manager Satisfaction With Recruitment Process Topics PDF bundle. Topics like New Recruitment Training Program, New Recruitment Training Program, 2019 TO 2023 can be discussed with this completely editable template. It is available for immediate download depending on the needs and requirements of the user.
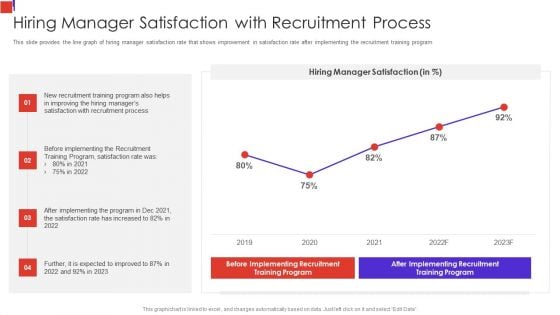
Outline Of Employee Recruitment Hiring Manager Satisfaction With Recruitment Process Clipart PDF
This slide provides the line graph of hiring manager satisfaction rate that shows improvement in satisfaction rate after implementing the recruitment training program Deliver and pitch your topic in the best possible manner with this Outline Of Employee Recruitment Hiring Manager Satisfaction With Recruitment Process Clipart PDF Use them to share invaluable insights on Recruitment Training, Improving The Hiring, Satisfaction With Recruitment and impress your audience. This template can be altered and modified as per your expectations. So, grab it now.
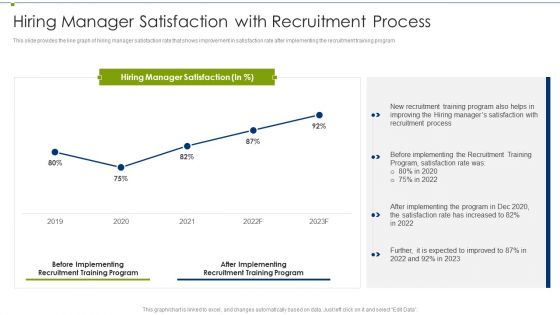
Recruitment Training Program For Workforce Hiring Manager Satisfaction With Recruitment Process Infographics PDF
This slide provides the line graph of hiring manager satisfaction rate that shows improvement in satisfaction rate after implementing the recruitment training program Deliver and pitch your topic in the best possible manner with this Recruitment Training Program For Workforce Hiring Manager Satisfaction With Recruitment Process Infographics PDF Use them to share invaluable insights on Recruitment Training Program, Improving The Hiring Managers, Recruitment Process and impress your audience. This template can be altered and modified as per your expectations. So, grab it now.
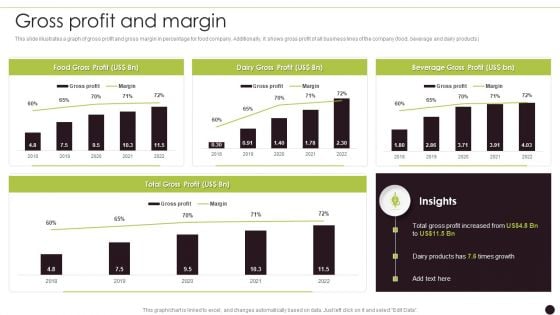
Canned Food Company Profile Gross Profit And Margin Portrait PDF
This slide illustrates a graph of gross profit and gross margin in percentage for food company. Additionally, it shows gross profit of all business lines of the company food, beverage and dairy products Deliver an awe inspiring pitch with this creative Canned Food Company Profile Gross Profit And Margin Portrait PDF bundle. Topics like Total Gross, Dairy Profit, Beverage Gross can be discussed with this completely editable template. It is available for immediate download depending on the needs and requirements of the user.
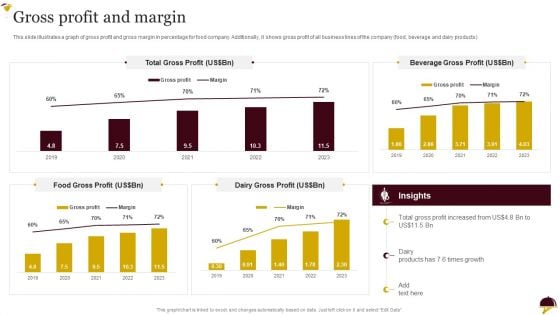
Food Company Overview Gross Profit And Margin Structure PDF
This slide illustrates a graph of gross profit and gross margin in percentage for food company. Additionally, it shows gross profit of all business lines of the company food, beverage and dairy products.Deliver an awe inspiring pitch with this creative Food Company Overview Gross Profit And Margin Structure PDF bundle. Topics like Food Gross, Total Gross, Beverage Gross can be discussed with this completely editable template. It is available for immediate download depending on the needs and requirements of the user.
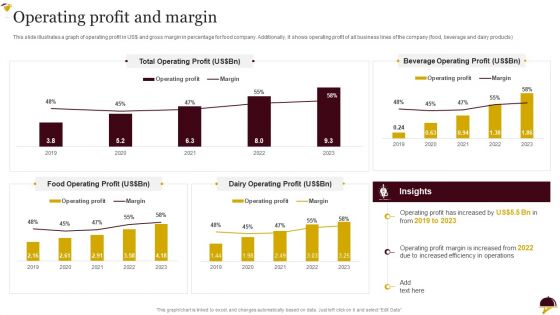
Food Company Overview Operating Profit And Margin Guidelines PDF
This slide illustrates a graph of operating profit in USdollr and gross margin in percentage for food company. Additionally, it shows operating profit of all business lines of the company food, beverage and dairy products.Deliver an awe inspiring pitch with this creative Food Company Overview Operating Profit And Margin Guidelines PDF bundle. Topics like Total Operating, Beverage Operating, Food Operating can be discussed with this completely editable template. It is available for immediate download depending on the needs and requirements of the user.
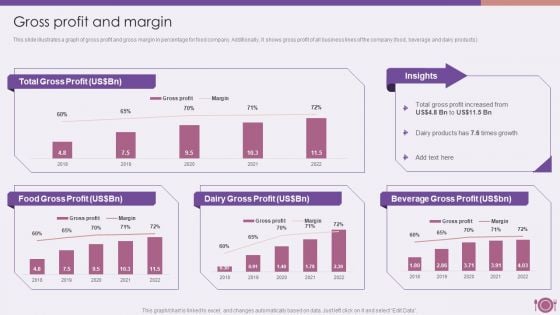
Packaged Food Firm Description Gross Profit And Margin Brochure PDF
This slide illustrates a graph of gross profit and gross margin in percentage for food company. Additionally, it shows gross profit of all business lines of the company food, beverage and dairy products.Deliver an awe inspiring pitch with this creative Packaged Food Firm Description Gross Profit And Margin Brochure PDF bundle. Topics like Total Gross, Food Gross, Dairy Gross can be discussed with this completely editable template. It is available for immediate download depending on the needs and requirements of the user.
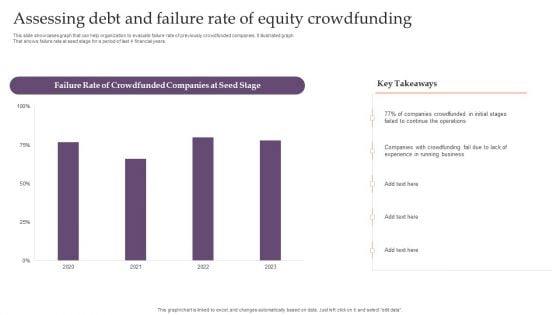
Assessing Debt And Equity Fundraising Alternatives For Business Growth Assessing Debt And Failure Rate Pictures PDF
This slide showcases graph that can help organization to evaluate failure rate of previously crowdfunded companies. It illustrated graph That shows failure rate at seed stage for a period of last 4 financial years. Here you can discover an assortment of the finest PowerPoint and Google Slides templates. With these templates, you can create presentations for a variety of purposes while simultaneously providing your audience with an eye catching visual experience. Download Assessing Debt And Equity Fundraising Alternatives For Business Growth Assessing Debt And Failure Rate Pictures PDF to deliver an impeccable presentation. These templates will make your job of preparing presentations much quicker, yet still, maintain a high level of quality. Slidegeeks has experienced researchers who prepare these templates and write high quality content for you. Later on, you can personalize the content by editing the Assessing Debt And Equity Fundraising Alternatives For Business Growth Assessing Debt And Failure Rate Pictures PDF.
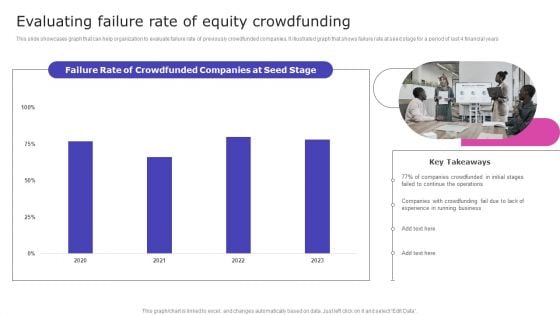
Strategic Fund Acquisition Plan For Business Opertions Expansion Evaluating Failure Rate Of Equity Crowdfunding Information PDF
This slide showcases graph that can help organization to evaluate failure rate of previously crowdfunded companies. It illustrated graph that shows failure rate at seed stage for a period of last 4 financial years. Slidegeeks is one of the best resources for PowerPoint templates. You can download easily and regulate Strategic Fund Acquisition Plan For Business Opertions Expansion Evaluating Failure Rate Of Equity Crowdfunding Information PDF for your personal presentations from our wonderful collection. A few clicks is all it takes to discover and get the most relevant and appropriate templates. Use our Templates to add a unique zing and appeal to your presentation and meetings. All the slides are easy to edit and you can use them even for advertisement purposes.
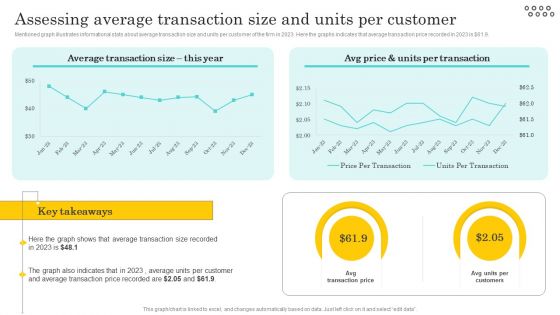
Optimizing And Managing Retail Assessing Average Transaction Size And Units Per Slides PDF
Mentioned graph illustrates informational stats about average transaction size and units per customer of the firm in 2023. Here the graphs indicates that average transaction price recorded in 2023 is dollar 61.9. Slidegeeks is one of the best resources for PowerPoint templates. You can download easily and regulate Optimizing And Managing Retail Assessing Average Transaction Size And Units Per Slides PDF for your personal presentations from our wonderful collection. A few clicks is all it takes to discover and get the most relevant and appropriate templates. Use our Templates to add a unique zing and appeal to your presentation and meetings. All the slides are easy to edit and you can use them even for advertisement purposes.
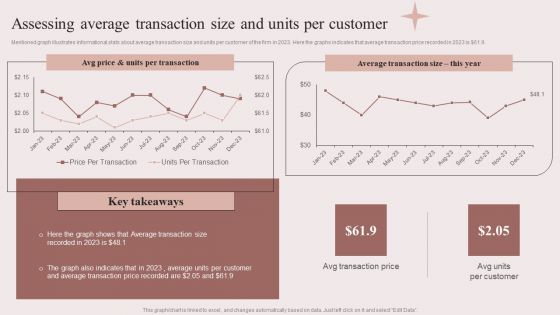
Enhancing Retail Process By Effective Inventory Management Assessing Average Transaction Size Units Clipart PDF
Mentioned graph illustrates informational stats about average transaction size and units per customer of the firm in 2023. Here the graphs indicates that average transaction price recorded in 2023 is doller 61.9. Slidegeeks is one of the best resources for PowerPoint templates. You can download easily and regulate Enhancing Retail Process By Effective Inventory Management Assessing Average Transaction Size Units Clipart PDF for your personal presentations from our wonderful collection. A few clicks is all it takes to discover and get the most relevant and appropriate templates. Use our Templates to add a unique zing and appeal to your presentation and meetings. All the slides are easy to edit and you can use them even for advertisement purposes.
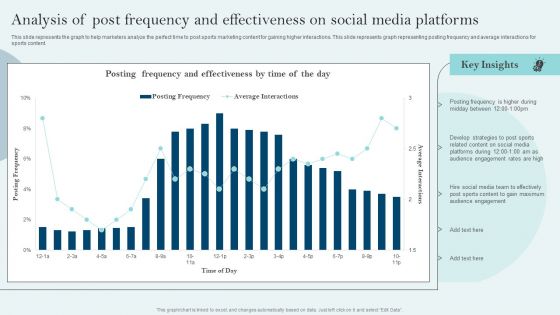
Comprehensive Sports Event Marketing Plan Analysis Of Post Frequency And Effectiveness On Social Slides PDF
This slide represents the graph to help marketers analyze the perfect time to post sports marketing content for gaining higher interactions. This slide represents graph representing posting frequency and average interactions for sports content. Boost your pitch with our creative Comprehensive Sports Event Marketing Plan Analysis Of Post Frequency And Effectiveness On Social Slides PDF. Deliver an awe-inspiring pitch that will mesmerize everyone. Using these presentation templates you will surely catch everyones attention. You can browse the ppts collection on our website. We have researchers who are experts at creating the right content for the templates. So you do not have to invest time in any additional work. Just grab the template now and use them.
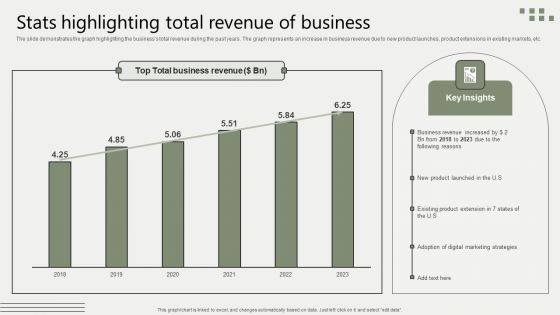
Global Business Market Development Guide Stats Highlighting Total Revenue Of Business Portrait PDF
The slide demonstrates the graph highlighting the businesss total revenue during the past years. The graph represents an increase in business revenue due to new product launches, product extensions in existing markets, etc. This modern and well arranged Global Business Market Development Guide Stats Highlighting Total Revenue Of Business Portrait PDF provides lots of creative possibilities. It is very simple to customize and edit with the Powerpoint Software. Just drag and drop your pictures into the shapes. All facets of this template can be edited with Powerpoint no extra software is necessary. Add your own material, put your images in the places assigned for them, adjust the colors, and then you can show your slides to the world, with an animated slide included.
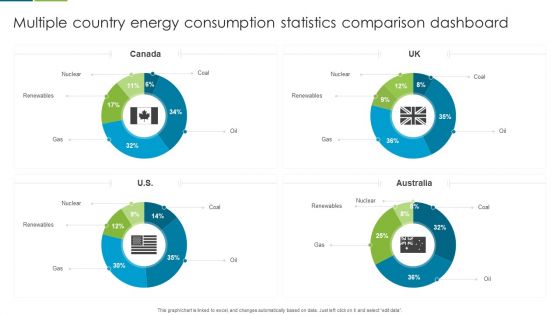
Multiple Country Energy Consumption Statistics Comparison Dashboard Formats PDF
This graph or chart is linked to excel, and changes automatically based on data. Just left click on it and select edit data. Pitch your topic with ease and precision using this Multiple Country Energy Consumption Statistics Comparison Dashboard Formats PDF. This layout presents information on Nuclear, Renewables, Gas. It is also available for immediate download and adjustment. So, changes can be made in the color, design, graphics or any other component to create a unique layout.
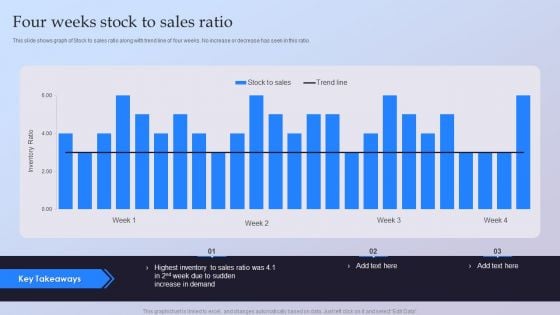
Four Weeks Stock To Sales Ratio Ppt Ideas Guide PDF
This slide shows graph of Stock to sales ratio along with trend line of four weeks. No increase or decrease has seen in this ratio. Pitch your topic with ease and precision using this Four Weeks Stock To Sales Ratio Ppt Ideas Guide PDF. This layout presents information on Highest Inventory, Sales Ratio, Increase Demand. It is also available for immediate download and adjustment. So, changes can be made in the color, design, graphics or any other component to create a unique layout.
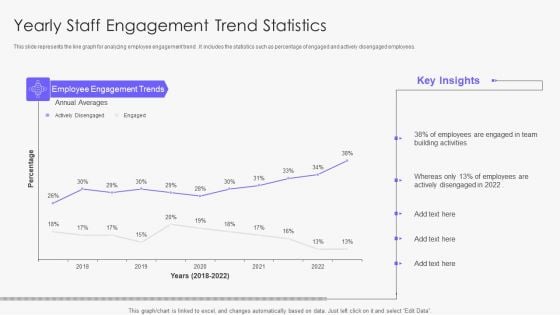
Yearly Staff Engagement Trend Statistics Demonstration PDF
This slide represents the line graph for analyzing employee engagement trend . It includes the statistics such as percentage of engaged and actively disengaged employees. Pitch your topic with ease and precision using this Yearly Staff Engagement Trend Statistics Demonstration PDF. This layout presents information on Team, Employees, Average. It is also available for immediate download and adjustment. So, changes can be made in the color, design, graphics or any other component to create a unique layout.
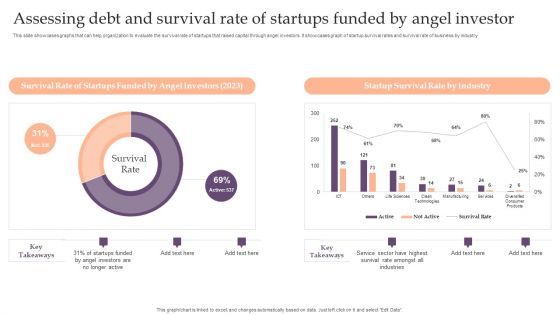
Assessing Debt And Equity Fundraising Alternatives For Business Growth Assessing Debt And Survival Rate Of Startups Background PDF
This slide showcases graphs that can help organization to evaluate the survival rate of startups that raised capital through angel investors. It showcases graph of startup survival rates and survival rate of business by industry. This Assessing Debt And Equity Fundraising Alternatives For Business Growth Assessing Debt And Survival Rate Of Startups Background PDF from Slidegeeks makes it easy to present information on your topic with precision. It provides customization options, so you can make changes to the colors, design, graphics, or any other component to create a unique layout. It is also available for immediate download, so you can begin using it right away. Slidegeeks has done good research to ensure that you have everything you need to make your presentation stand out. Make a name out there for a brilliant performance.

Yearly Selling Forecasts Revenue Chart Summary PDF
This slide covers projections for yearly revenue generation from product sales. It includes forecasted revenue for different years and a graph depicting the projected sales revenue growth. Showcasing this set of slides titled Yearly Selling Forecasts Revenue Chart Summary PDF. The topics addressed in these templates are Project Sales Revenue, Forecasts Revenue Chart. All the content presented in this PPT design is completely editable. Download it and make adjustments in color, background, font etc. as per your unique business setting.
Sustainable Energy Resources Column Chart Ppt PowerPoint Presentation Icon Infographic Template PDF
This graph or chart is linked to excel, and changes automatically based on data. Just left click on it and select Edit Data. Deliver and pitch your topic in the best possible manner with this Sustainable Energy Resources Column Chart Ppt PowerPoint Presentation Icon Infographic Template PDF. Use them to share invaluable insights on Column Chart, 2017 To 2022 and impress your audience. This template can be altered and modified as per your expectations. So, grab it now.
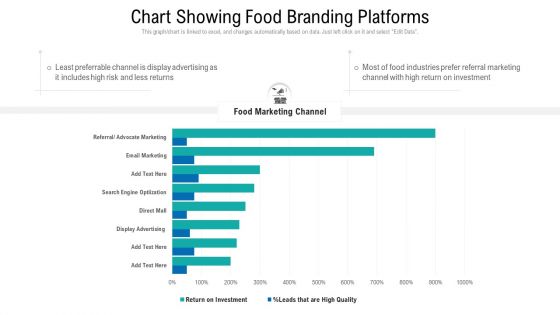
Chart Showing Food Branding Platforms Ppt Summary Gridlines PDF
This graph or chart is linked to excel, and changes automatically based on data. Just left click on it and select Edit Data. Showcasing this set of slides titled chart showing food branding platforms ppt summary gridlines pdf. The topics addressed in these templates are chart showing food branding platforms. All the content presented in this PPT design is completely editable. Download it and make adjustments in color, background, font etc. as per your unique business setting.
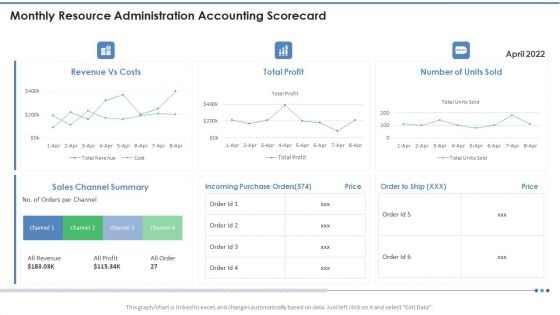
Monthly Resource Administration Accounting Scorecard Template PDF
This graph or chart is linked to excel, and changes automatically based on data. Just left click on it and select Edit Data. Deliver and pitch your topic in the best possible manner with this Monthly Resource Administration Accounting Scorecard Template PDF. Use them to share invaluable insights on Revenue Vs Costs, Total Profit, Number Units Sold and impress your audience. This template can be altered and modified as per your expectations. So, grab it now.
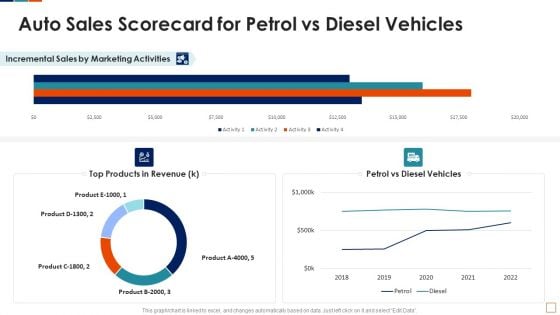
Auto Sales Scorecard For Petrol Vs Diesel Vehicles Template PDF
This graph or chart is linked to excel, and changes automatically based on data. Just left click on it and select Edit Data. Deliver an awe inspiring pitch with this creative Auto Sales Scorecard For Petrol Vs Diesel Vehicles Template PDF bundle. Topics like Top Products Revenue, Petrol Vs Diesel, Vehicles Incremental Sales, Marketing Activities Product can be discussed with this completely editable template. It is available for immediate download depending on the needs and requirements of the user.
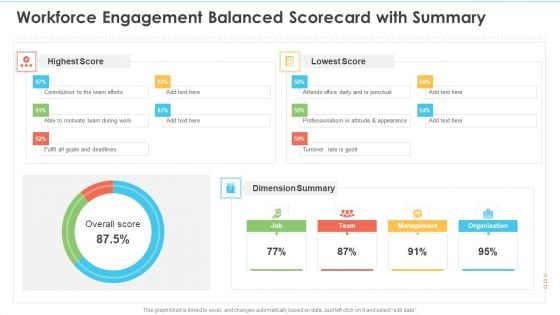
Workforce Engagement Balanced Scorecard With Summary Ppt Layouts Template PDF
This graph or chart is linked to excel, and changes automatically based on data. Just left click on it and select edit data. Deliver and pitch your topic in the best possible manner with this Workforce Engagement Balanced Scorecard With Summary Ppt Layouts Template PDF. Use them to share invaluable insights on Highest Score, Lowest Score, Dimension Summary and impress your audience. This template can be altered and modified as per your expectations. So, grab it now.
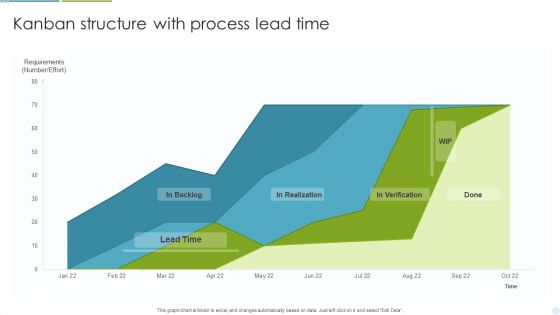
Kanban Structure With Process Lead Time Ppt Gallery Template PDF
This graph or chart is linked to excel, and changes automatically based on data. Just left click on it and select Edit Data. Showcasing this set of slides titled Kanban Structure With Process Lead Time Ppt Gallery Template PDF. The topics addressed in these templates are Lead Time, In Realization, Requirements. All the content presented in this PPT design is completely editable. Download it and make adjustments in color, background, font etc. as per your unique business setting.
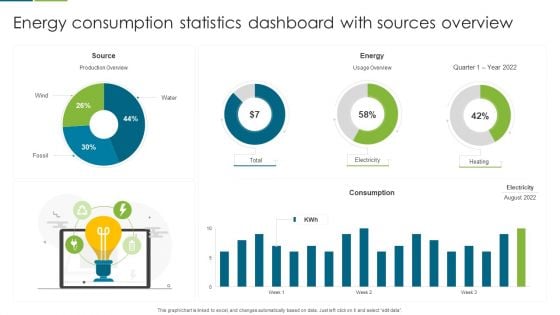
Energy Consumption Statistics Dashboard With Sources Overview Template PDF
This graph or chart is linked to excel, and changes automatically based on data. Just left click on it and select edit data. Pitch your topic with ease and precision using this Energy Consumption Statistics Dashboard With Sources Overview Template PDF. This layout presents information on Source, Energy, Consumption. It is also available for immediate download and adjustment. So, changes can be made in the color, design, graphics or any other component to create a unique layout.
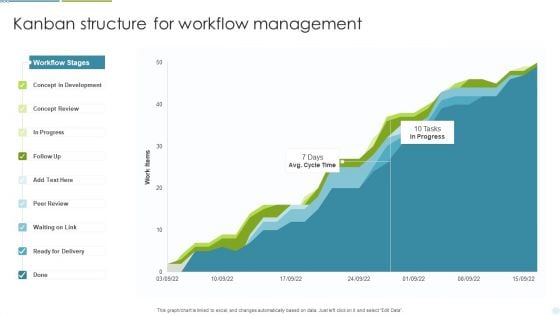
Kanban Structure For Workflow Management Ppt Inspiration Template PDF
This graph or chart is linked to excel, and changes automatically based on data. Just left click on it and select Edit Data. Pitch your topic with ease and precision using this Kanban Structure For Workflow Management Ppt Inspiration Template PDF. This layout presents information on Concept Development, Concept Review, Ready For Delivery. It is also available for immediate download and adjustment. So, changes can be made in the color, design, graphics or any other component to create a unique layout.
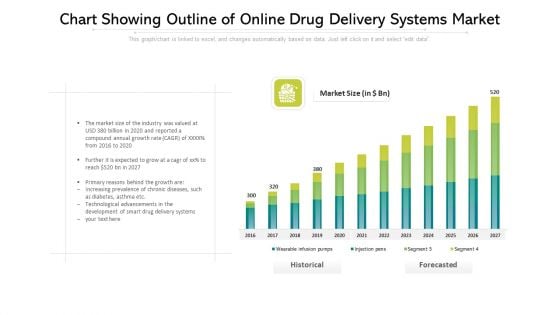
Chart Showing Outline Of Online Drug Delivery Systems Market Ppt PowerPoint Presentation File Clipart PDF
This graph or chart is linked to excel, and changes automatically based on data. Just left click on it and select edit data. Showcasing this set of slides titled chart showing outline of online drug delivery systems market ppt powerpoint presentation file clipart pdf. The topics addressed in these templates are technological, development, growth. All the content presented in this PPT design is completely editable. Download it and make adjustments in color, background, font etc. as per your unique business setting.
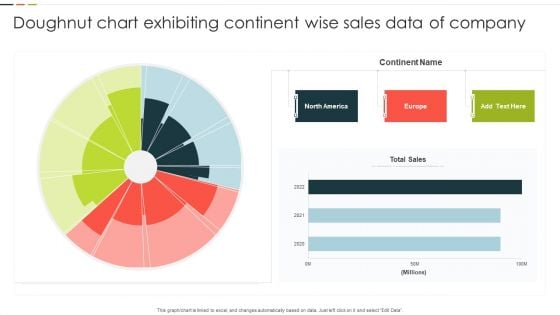
Doughnut Chart Exhibiting Continent Wise Sales Data Of Company Background PDF
This graph or chart is linked to excel, and changes automatically based on data. Just left click on it and select Edit Data. Showcasing this set of slides titled Doughnut Chart Exhibiting Continent Wise Sales Data Of Company Background PDF. The topics addressed in these templates are Continent Name, Total Sales, 2020 To 2022. All the content presented in this PPT design is completely editable. Download it and make adjustments in color, background, font etc. as per your unique business setting.
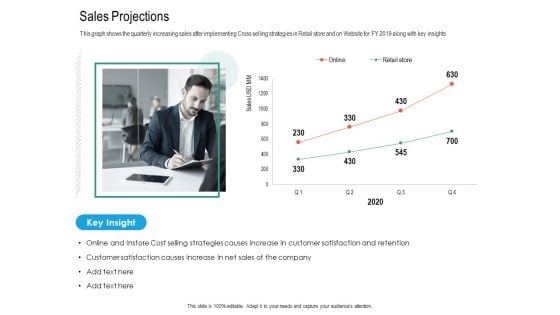
Upselling Strategies For Business Sales Projections Template PDF
This graph shows the quarterly increasing sales after implementing Cross selling strategies in Retail store and on Website for FY 2019 along with key insights. Deliver an awe inspiring pitch with this creative upselling strategies for business sales projections template pdf bundle. Topics like cost selling, strategies, retention, sales can be discussed with this completely editable template. It is available for immediate download depending on the needs and requirements of the user.
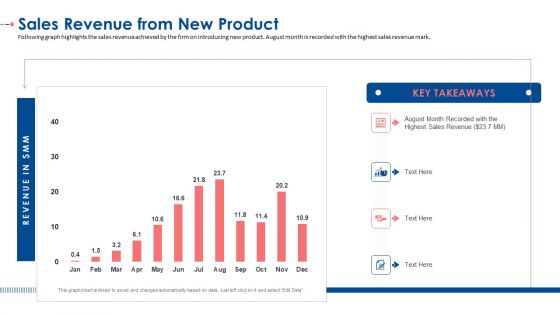
Sales Revenue From New Product Ppt Infographic Template Example PDF
Following graph highlights the sales revenue achieved by the firm on introducing new product. August month is recorded with the highest sales revenue mark. Deliver and pitch your topic in the best possible manner with this sales revenue from new product ppt infographic template example pdf. Use them to share invaluable insights on sales revenue from new product and impress your audience. This template can be altered and modified as per your expectations. So, grab it now.
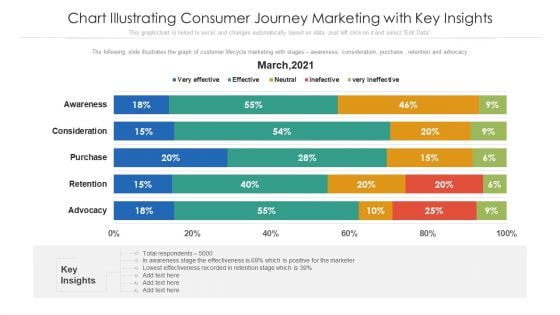
Chart Illustrating Consumer Journey Marketing With Key Insights Ppt PowerPoint Presentation File Demonstration PDF
The following slide illustrates the graph of customer lifecycle marketing with stages awareness, consideration, purchase , retention and advocacy. Showcasing this set of slides titled chart illustrating consumer journey marketing with key insights ppt powerpoint presentation file demonstration pdf. The topics addressed in these templates are awareness, consideration, purchase. All the content presented in this PPT design is completely editable. Download it and make adjustments in color, background, font etc. as per your unique business setting.


 Continue with Email

 Home
Home


