Bar Graphics
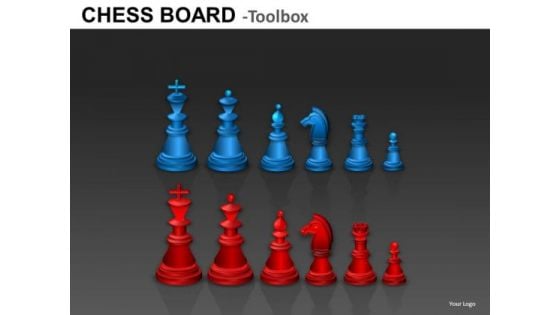
Red And Blue Chess Pieces Graphics
Red and Blue Chess pieces GraphicsThese high quality powerpoint pre-designed slides and powerpoint templates have been carefully created by our professional team to help you impress your audience. All slides have been created and are 100% editable in powerpoint. Each and every property of any graphic - color, size, orientation, shading, outline etc. can be modified to help you build an effective powerpoint presentation. Any text can be entered at any point in the powerpoint template or slide. Simply DOWNLOAD, TYPE and PRESENT! Develop a fearless attitude with our Red And Blue Chess Pieces Graphics. They assist in breaking through.
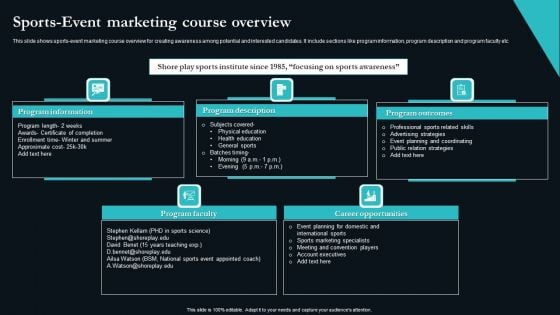
Sports Event Marketing Course Overview Graphics PDF
This slide shows sports-event marketing course overview for creating awareness among potential and interested candidates. It include sections like program information, program description and program faculty etc. Presenting Sports Event Marketing Course Overview Graphics PDF to dispense important information. This template comprises five stages. It also presents valuable insights into the topics including Program Information, Program Description, Program Outcomes, Program Faculty, Career Opportunities. This is a completely customizable PowerPoint theme that can be put to use immediately. So, download it and address the topic impactfully.
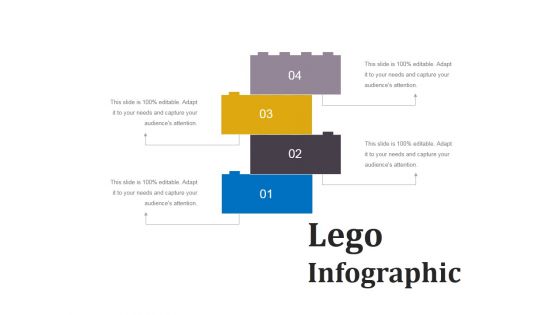
Lego Infographic Ppt PowerPoint Presentation Portfolio Graphics
This is a lego infographic ppt powerpoint presentation portfolio graphics. This is a four stage process. The stages in this process are business, marketing, game, development, block.

Business Diagram Thermometer Graphics Indicating Progress Presentation Template
This power point template diagram has been designed with graphic of thermometer and bar graph. This PPT contains the concept of growth analysis. Use this PPT for business and marketing related presentations.
Bars With Communication Icons PowerPoint Template
This diagram contains graphics of bars with communication icons. Download this diagram slide to display business strategy. This diagram provides an effective way of displaying information you can edit text, color, shade and style as per you need.
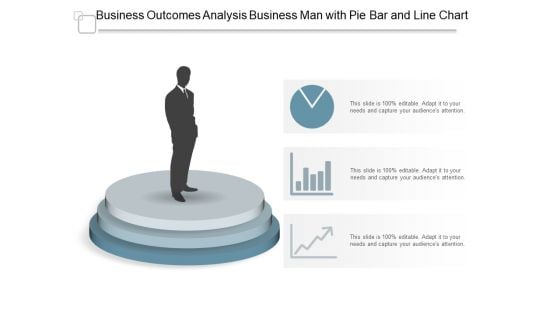
Business Outcomes Analysis Business Man With Pie Bar And Line Chart Ppt Powerpoint Presentation Infographics Visual Aids
This is a business outcomes analysis business man with pie bar and line chart ppt powerpoint presentation infographics visual aids. This is a three stage process. The stages in this process are business outcomes, business results, business output.
Stock Market Analysis Magnifying Glass Over Bar Graph And Dollar Sign Ppt PowerPoint Presentation Icon Visual Aids
This is a stock market analysis magnifying glass over bar graph and dollar sign ppt powerpoint presentation icon visual aids. This is a four stage process. The stages in this process are stock market, financial markets, bull market.
Mobile Phone With Bar Chart And Magnify Glass Vector Icon Ppt PowerPoint Presentation Visual Aids Show PDF
Presenting mobile phone with bar chart and magnify glass vector icon ppt powerpoint presentation visual aids show pdf to dispense important information. This template comprises three stages. It also presents valuable insights into the topics including mobile phone with bar chart and magnify glass vector icon. This is a completely customizable PowerPoint theme that can be put to use immediately. So, download it and address the topic impactfully.
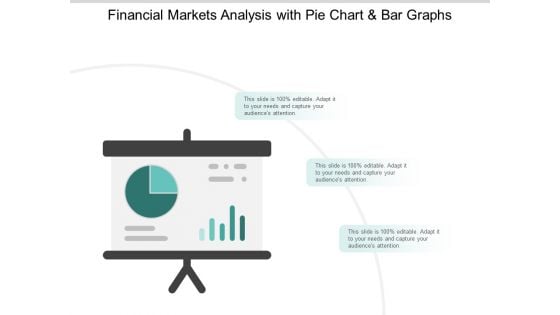
Stock Market Survey Reporting With Pie Chat And Bar Graph Ppt PowerPoint Presentation Infographic Template Example 2015
This is a stock market survey reporting with pie chat and bar graph ppt powerpoint presentation infographic template example 2015. This is a three stage process. The stages in this process are stock market, financial markets, bull market.
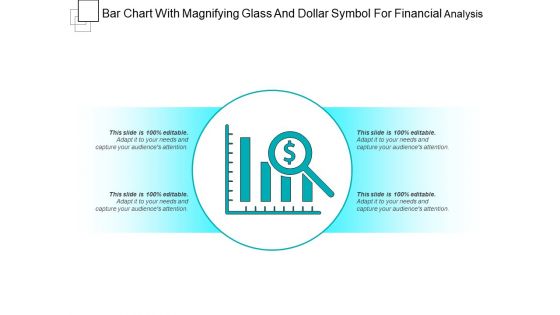
Bar Chart With Magnifying Glass And Dollar Symbol For Financial Analysis Ppt PowerPoint Presentation File Structure PDF
Presenting this set of slides with name bar chart with magnifying glass and dollar symbol for financial analysis ppt powerpoint presentation file structure pdf. This is a one stage process. The stages in this process is bar chart with magnifying glass and dollar symbol for financial analysis. This is a completely editable PowerPoint presentation and is available for immediate download. Download now and impress your audience.
Consulting Services With Bar Graph And Chat Bo Vector Icon Ppt PowerPoint Presentation File Background Designs PDF
Persuade your audience using this consulting services with bar graph and chat bo vector icon ppt powerpoint presentation file background designs pdf. This PPT design covers three stages, thus making it a great tool to use. It also caters to a variety of topics including consulting services with bar graph and chat bo vector icon. Download this PPT design now to present a convincing pitch that not only emphasizes the topic but also showcases your presentation skills.
Key Drivers Of Sales And Marketing Growth With Bar Graph Vector Icon Ppt PowerPoint Presentation File Inspiration PDF
Presenting key drivers of sales and marketing growth with bar graph vector icon ppt powerpoint presentation file inspiration pdf to dispense important information. This template comprises one stages. It also presents valuable insights into the topics including key drivers of sales and marketing growth with bar graph vector icon. This is a completely customizable PowerPoint theme that can be put to use immediately. So, download it and address the topic impactfully.
Employee Career Growth Steps With Bar Chart And Idea Bulb Vector Icon Ppt PowerPoint Presentation File Format Ideas PDF
Persuade your audience using this employee career growth steps with bar chart and idea bulb vector icon ppt powerpoint presentation file format ideas pdf. This PPT design covers three stages, thus making it a great tool to use. It also caters to a variety of topics including employee career growth steps with bar chart and idea bulb vector icon. Download this PPT design now to present a convincing pitch that not only emphasizes the topic but also showcases your presentation skills.
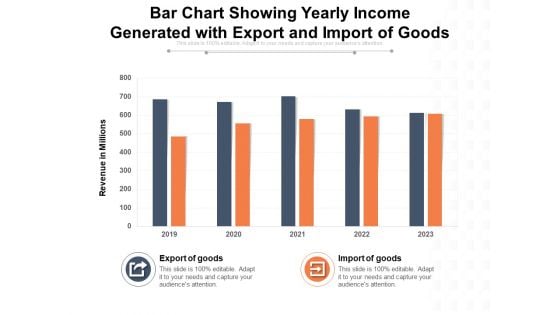
Bar Chart Showing Yearly Income Generated With Export And Import Of Goods Ppt PowerPoint Presentation Gallery Clipart Images PDF
Presenting this set of slides with name bar chart showing yearly income generated with export and import of goods ppt powerpoint presentation gallery clipart images pdf. The topics discussed in these slides are export of goods, import of goods. This is a completely editable PowerPoint presentation and is available for immediate download. Download now and impress your audience.
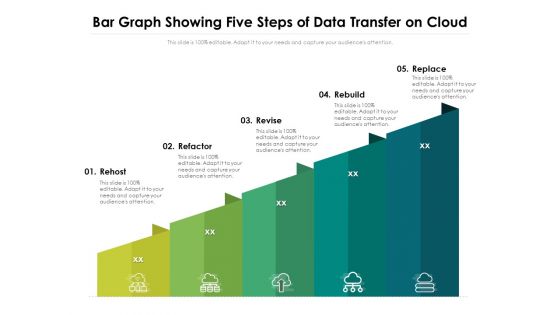
Bar Graph Showing Five Steps Of Data Transfer On Cloud Ppt PowerPoint Presentation Ideas Slide Download PDF
Presenting this set of slides with name bar graph showing five steps of data transfer on cloud ppt powerpoint presentation ideas slide download pdf. This is a five stage process. The stages in this process are rehost, refactor, revise, rebuild, replace. This is a completely editable PowerPoint presentation and is available for immediate download. Download now and impress your audience.
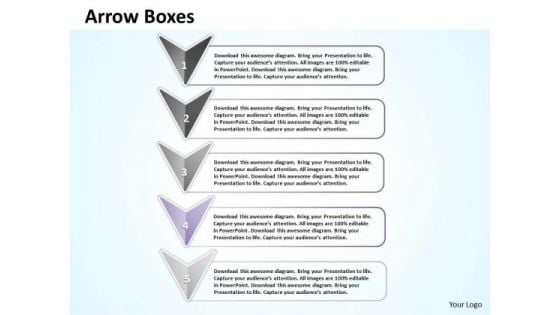
Ppt Fourth Stage Description Using PowerPoint Graphics Arrows Templates
PPT fourth stage description using powerpoint graphics arrows Templates-A management technique that scrutinizes the processes that a company goes through to perform certain tasks. The intention is to create a more efficient way of working, thereby saving time and money. This image represents the concept of Defining five different points of view on the same topic using Arrows. Deliver amazing presentations to mesmerize your audience using this Diagram.-PPT fourth stage description using powerpoint graphics arrows Templates-arrow, background, banner, bar, blank, box, bubble, business, colorful, communication, cubes, curve, decorative, design, glowing, graphic, icon, label, message, number, pattern, product, sale, shape, shiny, sign, sticker, symbol, tag, template, text, title, vector, web Get ambitions burning with your thoughts. Fan the flames with our Ppt Fourth Stage Description Using PowerPoint Graphics Arrows Templates.
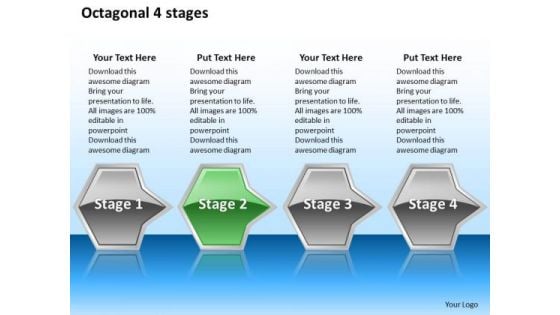
Ppt Consecutive Octagonal PowerPoint Graphics Arrows 4 Stage Templates
PPT consecutive octagonal powerpoint graphics arrows 4 stage Templates-This PowerPoint Diagram shows octagonal arrows. It shows the consecutive concepts to be explained together in one process. This Template will fit for Business Presentations.-PPT consecutive octagonal powerpoint graphics arrows 4 stage Templates-Shapes, Designs, Arrows, Badge, Balloon, Bar, Blank, Blue, Bright, Bubbles, Buttons, Circle, Color, Cross, Design, Drop, Elements, Glossy, Glowing, Graphic, Hexagon, Icon, Illustration, Navigation, Octagon, Plus, Polygon, Rectangles, Round, Seals, Set, Shadow, Shiny, Sign, Speech, Squares, Stars, Stickers, Submit, Symbol You will find our Ppt Consecutive Octagonal PowerPoint Graphics Arrows 4 Stage Templates clearly amazing. Add on your thoughts and astound the audience.
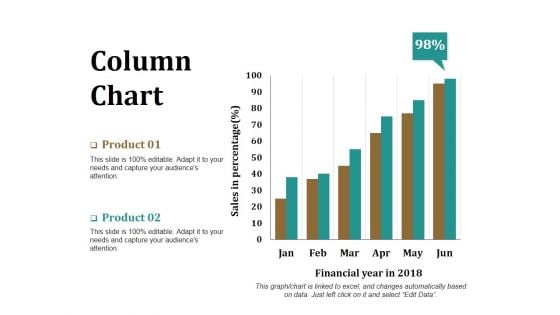
Column Chart Ppt PowerPoint Presentation Model Graphics Download
This is a column chart ppt powerpoint presentation model graphics download. This is a two stage process. The stages in this process are product, financial year, sales in percentage, bar graph, success.

Staff With Professional Qualification Ppt PowerPoint Presentation Gallery Graphics Pictures
This is a staff with professional qualification ppt powerpoint presentation gallery graphics pictures. This is a five stage process. The stages in this process are qualification, bar graph, business, marketing, success.
Workforce Diversity By Region Ppt PowerPoint Presentation Icon Graphics Pictures
This is a workforce diversity by region ppt powerpoint presentation icon graphics pictures. This is a four stage process. The stages in this process are by region, bar graph, business, presentation, marketing.
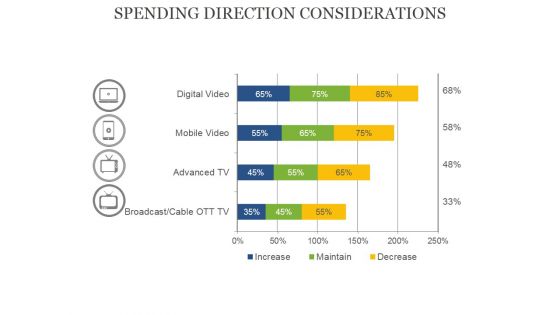
Spending Direction Considerations Ppt PowerPoint Presentation Portfolio Graphics Template
This is a spending direction considerations ppt powerpoint presentation portfolio graphics template. This is a four stage process. The stages in this process are bar graph, business, presentation, percentage, finance.
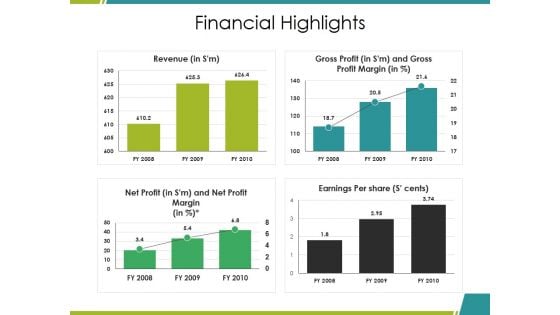
Financial Highlights Ppt PowerPoint Presentation Ideas Graphics Download
This is a financial highlights ppt powerpoint presentation ideas graphics download. This is a four stage process. The stages in this process are revenue, gross profit, net profit, earnings per share, bar graph.
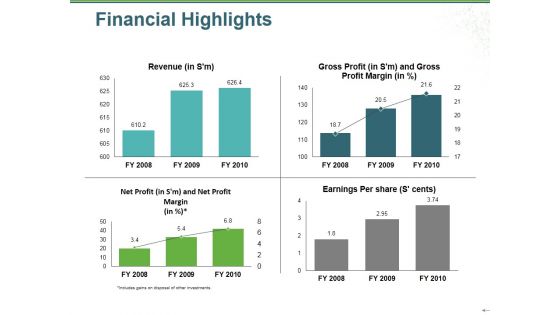
Financial Highlights Ppt PowerPoint Presentation Gallery Graphics Example
This is a financial highlights ppt powerpoint presentation gallery graphics example. This is a four stage process. The stages in this process are revenue, gross profit, net profit, earnings per share, bar graph.
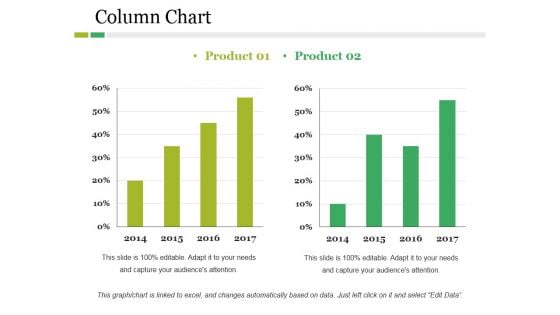
Column Chart Ppt PowerPoint Presentation Layouts Graphics Example
This is a column chart ppt powerpoint presentation layouts graphics example. This is a two stage process. The stages in this process are product, year, bar graph, business, finance.
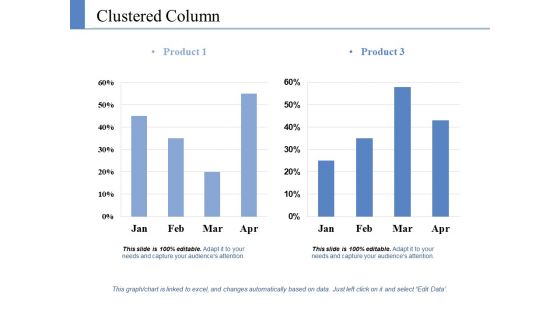
Clustered Column Ppt PowerPoint Presentation Pictures Graphics Template
This is a clustered column ppt powerpoint presentation pictures graphics template. This is a two stage process. The stages in this process are product, growth, success, business, bar graph.
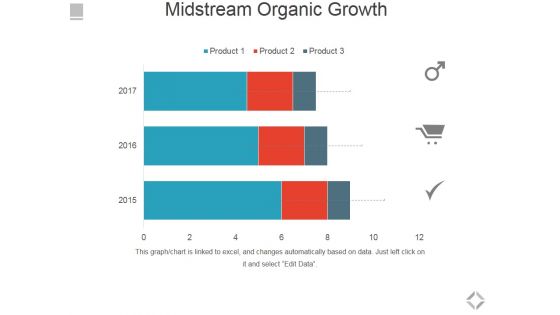
Midstream Organic Growth Ppt PowerPoint Presentation Ideas Graphics Tutorials
This is a midstream organic growth ppt powerpoint presentation ideas graphics tutorials. This is a three stage process. The stages in this process are business, marketing, bar graph, management, financials.
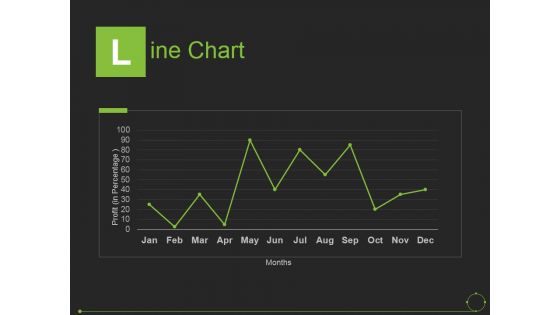
Line Chart Ppt PowerPoint Presentation File Graphics Tutorials
This is a line chart ppt powerpoint presentation file graphics tutorials. This is a one stage process. The stages in this process are months, line chart, bar graph, business, marketing.
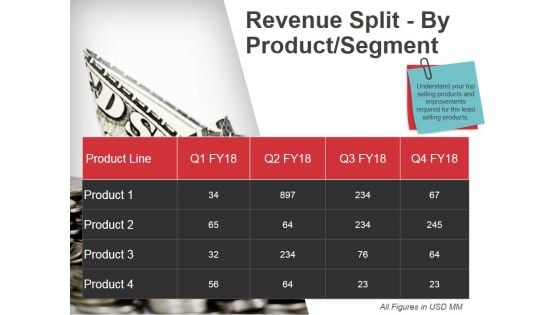
Revenue Split By Product Segment Ppt PowerPoint Presentation Ideas Graphics
This is a revenue split by product segment ppt powerpoint presentation ideas graphics. This is a four stage process. The stages in this process are business, marketing, bar graph, success.
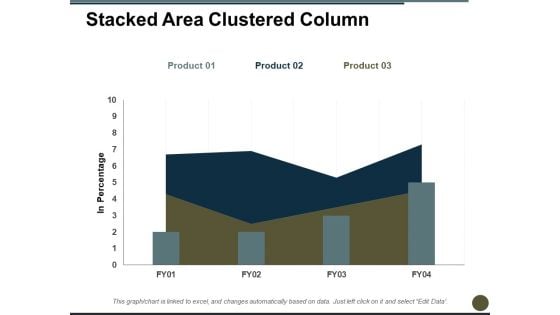
Stacked Area Clustered Column Ppt PowerPoint Presentation Professional Graphics
This is a stacked area clustered column ppt powerpoint presentation professional graphics. This is a three stage process. The stages in this process are in percentage, bar chart, product, growth, year.
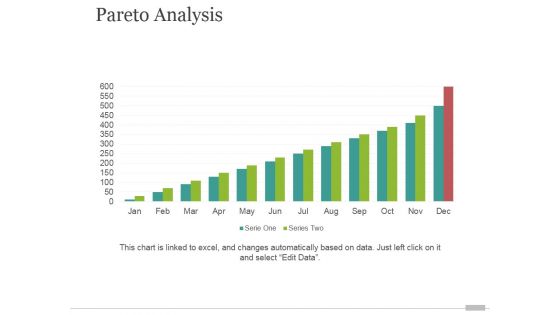
Pareto Analysis Tamplate 2 Ppt PowerPoint Presentation Graphics
This is a pareto analysis tamplate 2 ppt powerpoint presentation graphics. This is a twelve stage process. The stages in this process are bar graph, finance, marketing, strategy, analysis, business.
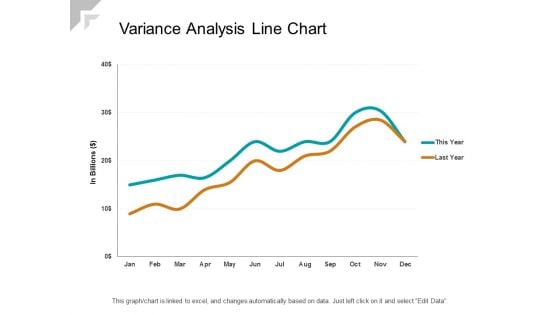
Variance Analysis Line Chart Ppt PowerPoint Presentation Styles Graphics Example
Presenting this set of slides with name variance analysis line chart ppt powerpoint presentation styles graphics example. The topics discussed in these slides are revenue trend, bar chart, financial. This is a completely editable PowerPoint presentation and is available for immediate download. Download now and impress your audience.
Countdown Timer Vector Icon Ppt Powerpoint Presentation Icon Graphics Example
Presenting this set of slides with name countdown timer vector icon ppt powerpoint presentation icon graphics example. The topics discussed in these slides are number icon, mathematical, number bar vector. This is a completely editable PowerPoint presentation and is available for immediate download. Download now and impress your audience.
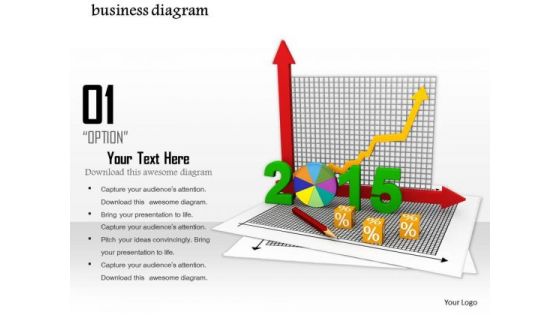
0814 Business Diagram 2015 For Planning Image Graphics For PowerPoint
Define the concepts of target and success with this unique image. This image depicts planning for year 2015. In this image pie chart and bar graph is displayed with year 2015. Use this image in business, marketing and sales related presentations.
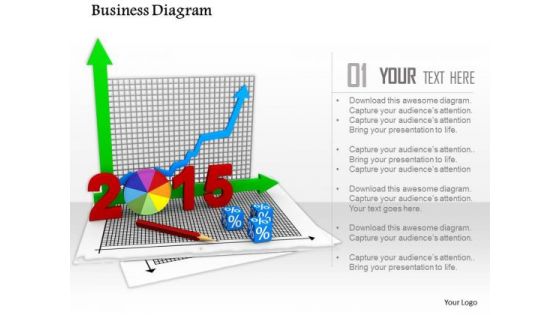
0814 Business Diagram For Planning Image Graphics For PowerPoint
Define the concepts of planning with this unique image. This image of charts and graphs depicts planning for year 2015. In this image pie chart and bar graph is displayed with year 2015. Use this image in business, marketing and sales related presentations.
Overview Implementing Asset Maximizing Efficiency Asset Tracking Solutions Graphics Pdf
This slide covers overview for implementing asset tracking software in logistics management. It involves key technologies such as bar code scanners, RFID applications, GPS and ultra wide band. Slidegeeks has constructed Overview Implementing Asset Maximizing Efficiency Asset Tracking Solutions Graphics Pdf after conducting extensive research and examination. These presentation templates are constantly being generated and modified based on user preferences and critiques from editors. Here, you will find the most attractive templates for a range of purposes while taking into account ratings and remarks from users regarding the content. This is an excellent jumping off point to explore our content and will give new users an insight into our top notch PowerPoint Templates. This slide covers overview for implementing asset tracking software in logistics management. It involves key technologies such as bar code scanners, RFID applications, GPS and ultra wide band.
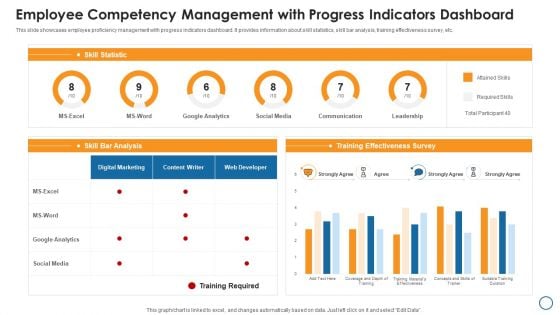
Employee Competency Management With Progress Indicators Dashboard Graphics PDF
This slide showcases employee proficiency management with progress indicators dashboard. It provides information about skill statistics, skill bar analysis, training effectiveness survey, etc. Showcasing this set of slides titled employee competency management with progress indicators dashboard graphics pdf. The topics addressed in these templates are google analytics, social media, survey. All the content presented in this PPT design is completely editable. Download it and make adjustments in color, background, font etc. as per your unique business setting.
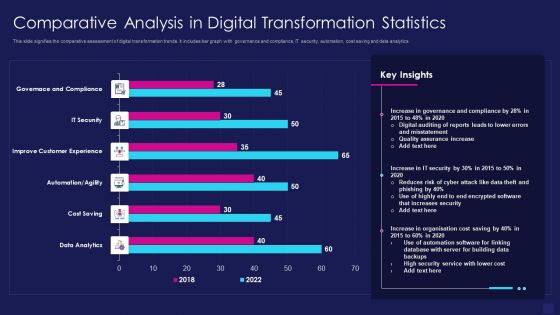
Comparative Analysis In Digital Transformation Statistics Graphics PDF
This slide signifies the comparative assessment of digital transformation trends. It includes bar graph with governance and compliance, IT security, automation, cost saving and data analytics. Showcasing this set of slides titled comparative analysis in digital transformation statistics graphics pdf. The topics addressed in these templates are data analytics, cost saving, improve customer experience. All the content presented in this PPT design is completely editable. Download it and make adjustments in color, background, font etc. as per your unique business setting.
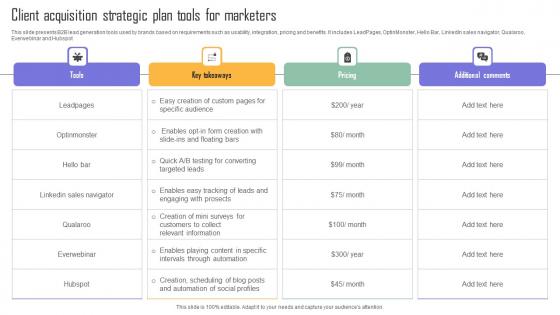
Client Acquisition Strategic Plan Tools For Marketers Graphics Pdf
This slide presents B2B lead generation tools used by brands based on requirements such as usability, integration, pricing and benefits. It includes LeadPages, OptinMonster, Hello Bar, LinkedIn sales navigator, Qualaroo, Everwebinar and Hubspot. Pitch your topic with ease and precision using this Client Acquisition Strategic Plan Tools For Marketers Graphics Pdf. This layout presents information on Tools, Key Takeaways, Pricing. It is also available for immediate download and adjustment. So, changes can be made in the color, design, graphics or any other component to create a unique layout. This slide presents B2B lead generation tools used by brands based on requirements such as usability, integration, pricing and benefits. It includes LeadPages, OptinMonster, Hello Bar, LinkedIn sales navigator, Qualaroo, Everwebinar and Hubspot.
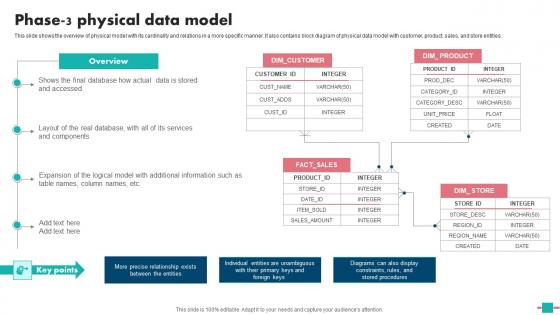
Database Modeling Phase 3 Physical Data Model Graphics Pdf
This slide shows the overview of physical model with its cardinality and relations in a more specific manner. It also contains block diagram of physical data model with customer, product, sales, and store entities. Make sure to capture your audiences attention in your business displays with our gratis customizable Database Modeling Phase 3 Physical Data Model Graphics Pdf. These are great for business strategies, office conferences, capital raising or task suggestions. If you desire to acquire more customers for your tech business and ensure they stay satisfied, create your own sales presentation with these plain slides. This slide shows the overview of physical model with its cardinality and relations in a more specific manner. It also contains block diagram of physical data model with customer, product, sales, and store entities.
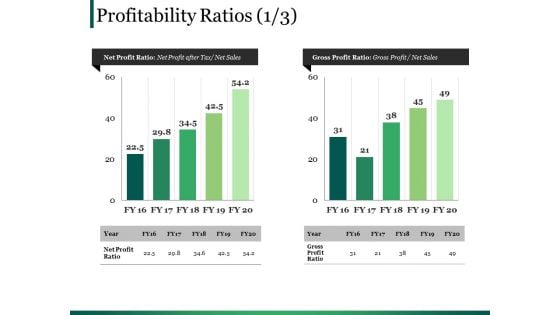
Profitability Ratios Template 2 Ppt PowerPoint Presentation Summary Graphics
This is a profitability ratios template 2 ppt powerpoint presentation summary graphics. This is a two stage process. The stages in this process are business, marketing, bar, finance, planning.
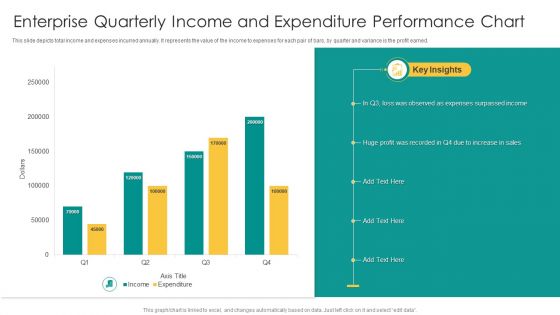
Enterprise Quarterly Income And Expenditure Performance Chart Graphics PDF
This slide depicts total income and expenses incurred annually. It represents the value of the income to expenses for each pair of bars, by quarter and variance is the profit earned. Pitch your topic with ease and precision using this Enterprise Quarterly Income And Expenditure Performance Chart Graphics PDF. This layout presents information on Expenses Surpassed Income, Sales, Huge Profit. It is also available for immediate download and adjustment. So, changes can be made in the color, design, graphics or any other component to create a unique layout.
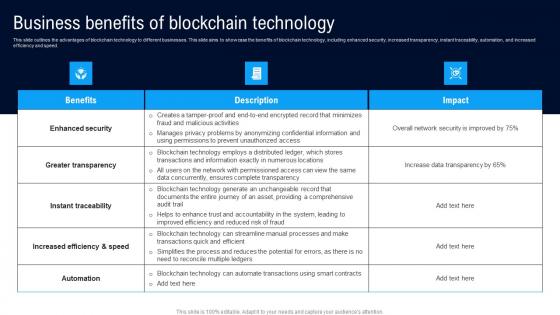
Business Benefits Of Blockchain Different Architectures Of Blockchain Graphics Pdf
This slide outlines the advantages of blockchain technology to different businesses. This slide aims to showcase the benefits of blockchain technology, including enhanced security, increased transparency, instant traceability, automation, and increased efficiency and speed. Do you know about Slidesgeeks Business Benefits Of Blockchain Different Architectures Of Blockchain Graphics Pdf These are perfect for delivering any kind od presentation. Using it, create PowerPoint presentations that communicate your ideas and engage audiences. Save time and effort by using our pre designed presentation templates that are perfect for a wide range of topic. Our vast selection of designs covers a range of styles, from creative to business, and are all highly customizable and easy to edit. Download as a PowerPoint template or use them as Google Slides themes. This slide outlines the advantages of blockchain technology to different businesses. This slide aims to showcase the benefits of blockchain technology, including enhanced security, increased transparency, instant traceability, automation, and increased efficiency and speed.
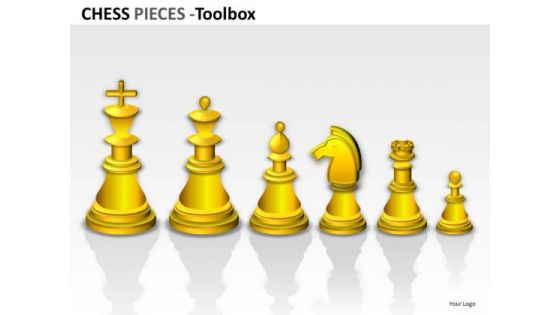
PowerPoint Graphics Showing Teamwork Leadership With Chess Pieces
PowerPoint Graphics Showing teamwork leadership with chess pieces-These high quality powerpoint pre-designed slides and powerpoint templates have been carefully created by our professional team to help you impress your audience. All slides have been created and are 100% editable in powerpoint. Each and every property of any graphic - color, size, orientation, shading, outline etc. can be modified to help you build an effective powerpoint presentation. Any text can be entered at any point in the powerpoint template or slide. Simply DOWNLOAD, TYPE and PRESENT! Your career will soar away. Our PowerPoint Graphics Showing Teamwork Leadership With Chess Pieces will give it wings.
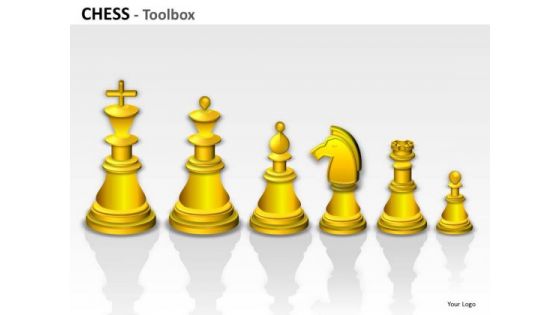
PowerPoint Clipart Graphics And Slides Showing Chess Pieces
PowerPoint Clipart Graphics and Slides showing Chess PiecesThese high quality powerpoint pre-designed slides and powerpoint templates have been carefully created by our professional team to help you impress your audience. All slides have been created and are 100% editable in powerpoint. Each and every property of any graphic - color, size, orientation, shading, outline etc. can be modified to help you build an effective powerpoint presentation. Any text can be entered at any point in the powerpoint template or slide. Simply DOWNLOAD, TYPE and PRESENT! Improve the environment in your factory. Use our PowerPoint Clipart Graphics And Slides Showing Chess Pieces to spread bonhomie.
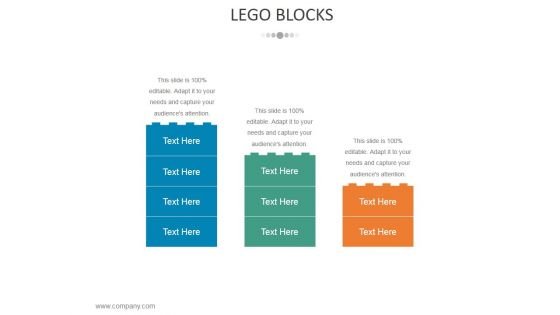
Lego Blocks Ppt PowerPoint Presentation Outline Graphics Template
This is a lego blocks ppt powerpoint presentation outline graphics template. This is a three stage process. The stages in this process are business, strategy, marketing, analysis, lego.
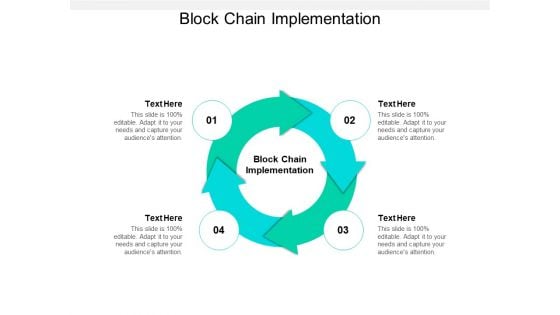
Block Chain Implementation Ppt PowerPoint Presentation Pictures Graphics Design Cpb
Presenting this set of slides with name block chain implementation ppt powerpoint presentation pictures graphics design cpb. This is an editable Powerpoint four stages graphic that deals with topics like block chain implementation to help convey your message better graphically. This product is a premium product available for immediate download and is 100 percent editable in Powerpoint. Download this now and use it in your presentations to impress your audience.
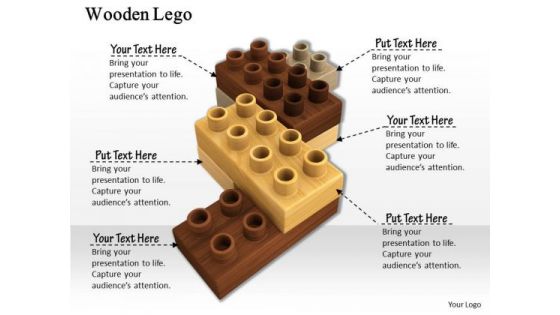
Stock Photo Graphics Of Brown Lego Blocks PowerPoint Slide
3d brown graphic of Lego blocks are used in this business power point image slide. This image slide is a conceptual slide which can be used to show teamwork and unity concepts. Display these concepts in your business presentations and create an impact on your viewers.
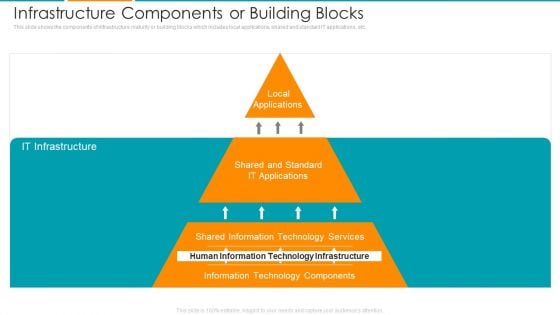
Infrastructure Components Or Building Blocks Ppt Portfolio Graphics PDF
This slide shows the components of infrastructure maturity or building blocks which includes local applications, shared and standard IT applications, etc. Presenting infrastructure components or building blocks ppt portfolio graphics pdf to provide visual cues and insights. Share and navigate important information on three stages that need your due attention. This template can be used to pitch topics like human information technology infrastructure, it infrastructure, local applications. In addition, this PPT design contains high-resolution images, graphics, etc, that are easily editable and available for immediate download.
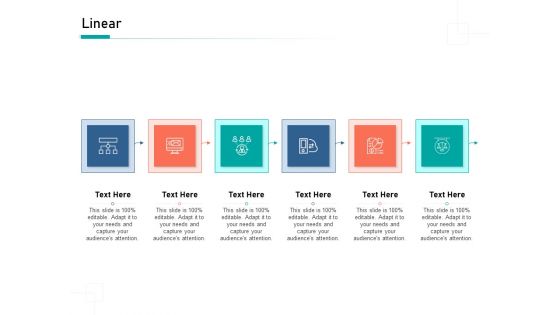
Organizational Building Blocks Linear Ppt PowerPoint Presentation File Graphics PDF
this is organizational building blocks linear ppt powerpoint presentation file graphics pdf template with various stages. focus and dispense information on six stages using this creative set, that comes with editable features. it contains large content boxes to add your information on topics like linear. you can also showcase facts, figures, and other relevant content using this ppt layout. grab it now.
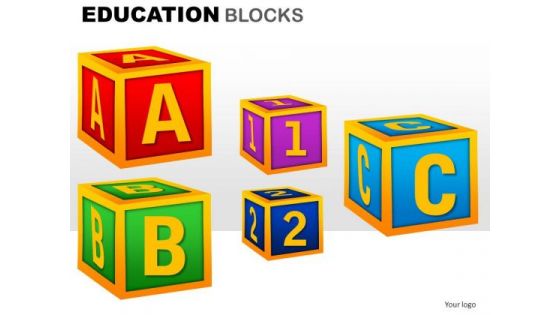
Education Alphabets Blocks Clipart Graphics Images For Ppt Slides
Education_Alphabets_Blocks_Clipart_Graphics_Images_for_PPT_Slides-These high quality powerpoint pre-designed slides and powerpoint templates have been carefully created by our professional team to help you impress your audience. All slides have been created and are 100% editable in powerpoint. Each and every property of any graphic - color, size, orientation, shading, outline etc. can be modified to help you build an effective powerpoint presentation. Any text can be entered at any point in the powerpoint template or slide. Simply DOWNLOAD, TYPE and PRESENT! These PowerPoint presentation slides can be used to represent themes relating to --Abc, alphabet, basic, blocks, child, childhood, colorful, count, cube, develop, early, education, elementary, font, grammar, kid, kindergarten, learn, letters, numbers, play, playschool, preschool, school, spell, square, stacked, teach, text, toy, wood, young-Education_Alphabets_Blocks_Clipart_Graphics_Images_for_PPT_Slides Develop their attitude for fairplay. Dwell on the benefits with our Education Alphabets Blocks Clipart Graphics Images For Ppt Slides.
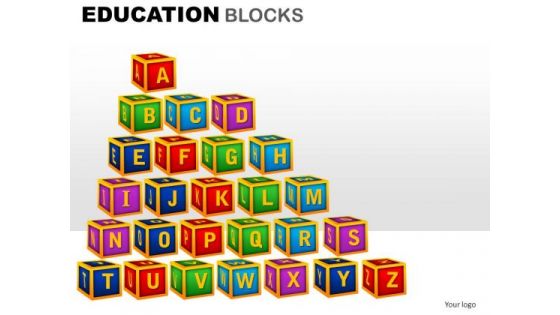
A To Z Education Clipart Graphics Images For PowerPoint
A_to_Z_Education_Clipart_Graphics_Images_for_PowerPoint-These high quality powerpoint pre-designed slides and powerpoint templates have been carefully created by our professional team to help you impress your audience. All slides have been created and are 100% editable in powerpoint. Each and every property of any graphic - color, size, orientation, shading, outline etc. can be modified to help you build an effective powerpoint presentation. Any text can be entered at any point in the powerpoint template or slide. Simply DOWNLOAD, TYPE and PRESENT! These PowerPoint presentation slides can be used to represent themes relating to --Abc, alphabet, basic, blocks, child, childhood, colorful, count, cube, develop, early, education, elementary, font, grammar, kid, kindergarten, learn, letters, numbers, play, playschool, preschool, school, spell, square, stacked, teach, text, toy, wood, young-A_to_Z_Education_Clipart_Graphics_Images_for_PowerPoint Enter any arena with our A To Z Education Clipart Graphics Images For PowerPoint. You will certainly emerge the champion.
A To Z Scrabble Letters PowerPoint Clipart Graphics Slides
A_to_Z_Scrabble_Letters_PowerPoint_Clipart_Graphics_Slides-These high quality powerpoint pre-designed slides and powerpoint templates have been carefully created by our professional team to help you impress your audience. All slides have been created and are 100% editable in powerpoint. Each and every property of any graphic - color, size, orientation, shading, outline etc. can be modified to help you build an effective powerpoint presentation. Any text can be entered at any point in the powerpoint template or slide. Simply DOWNLOAD, TYPE and PRESENT! These PowerPoint presentation slides can be used to represent themes relating to --Abc, alphabet, basic, blocks, child, childhood, colorful, count, cube, develop, early, education, elementary, font, grammar, kid, kindergarten, learn, letters, numbers, play, playschool, preschool, school, spell, square, stacked, teach, text, toy, wood, young-A_to_Z_Scrabble_Letters_PowerPoint_Clipart_Graphics_Slides Go excavating with our A To Z Scrabble Letters PowerPoint Clipart Graphics Slides. Dig deep into all the material available.
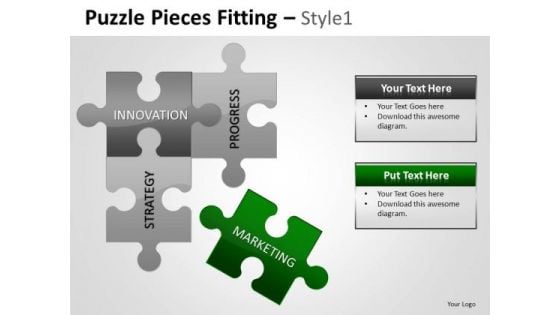
4 Factors Puzzle Pieces PowerPoint Slides Ppt Graphics
4 Factors Puzzle Pieces PowerPoint Slides PPT Graphics-These high quality, editable pre-designed powerpoint slides have been carefully created by our professional team to help you impress your audience. Each graphic in every slide is vector based and is 100% editable in powerpoint. Each and every property of any slide - color, size, shading etc can be modified to build an effective powerpoint presentation. Use these slides to convey complex business concepts in a simplified manner. Any text can be entered at any point in the powerpoint slide. Simply DOWNLOAD, TYPE and PRESENT! Fulfill aspirations with our 4 Factors Puzzle Pieces PowerPoint Slides Ppt Graphics. Cater to all your clients fancy demands.
3d Cube Puzzle Pieces PowerPoint Slides And Ppt Clipart Graphics
3D Cube Puzzle Pieces PowerPoint Slides And PPT Clipart Graphics-These high quality powerpoint pre-designed slides and powerpoint templates have been carefully created by our professional team to help you impress your audience. All slides have been created and are 100% editable in powerpoint. Each and every property of any graphic - color, size, orientation, shading, outline etc. can be modified to help you build an effective powerpoint presentation. Any text can be entered at any point in the powerpoint template or slide. Simply DOWNLOAD, TYPE and PRESENT! Change the world with our 3d Cube Puzzle Pieces PowerPoint Slides And Ppt Clipart Graphics. You will come out on top.

Last Puzzle Piece Solution Ppt Slides PowerPoint Graphics
Last Puzzle Piece Solution PPT Slides PowerPoint Graphics-These high quality, editable pre-designed powerpoint slides have been carefully created by our professional team to help you impress your audience. Each graphic in every slide is vector based and is 100% editable in powerpoint. Each and every property of any slide - color, size, shading etc can be modified to build an effective powerpoint presentation. Use these slides to convey complex business concepts in a simplified manner. Any text can be entered at any point in the powerpoint slide. Simply DOWNLOAD, TYPE and PRESENT! Brief your team with our Last Puzzle Piece Solution Ppt Slides PowerPoint Graphics. Download without worries with our money back guaranteee.
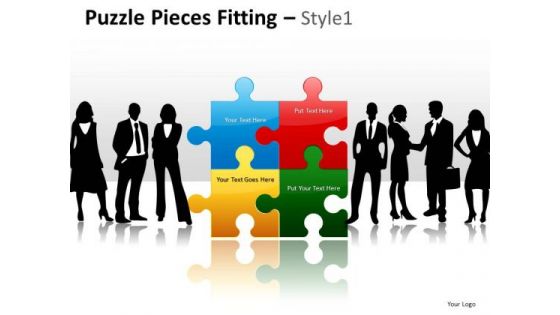
Teamwork Puzzle Pieces PowerPoint Slides Ppt Template Graphics
Teamwork Puzzle Pieces PowerPoint Slides PPT Template Graphics-These high quality powerpoint pre-designed slides and powerpoint templates have been carefully created by our professional team to help you impress your audience. All slides have been created and are 100% editable in powerpoint. Each and every property of any graphic - color, size, orientation, shading, outline etc. can be modified to help you build an effective powerpoint presentation. Any text can be entered at any point in the powerpoint template or slide. Simply DOWNLOAD, TYPE and PRESENT! Test boundaries of presenting with our Teamwork Puzzle Pieces PowerPoint Slides Ppt Template Graphics. Download without worries with our money back guaranteee.

Application Of Smart Contract In Block Chain Technology Graphics PDF
This slide showcase smart contract programmes that stored on blockchain that run with predetermined condition in different areas. It include safeguard efficiency medication, retail supplier relation and international marketing. Presenting Application Of Smart Contract In Block Chain Technology Graphics PDF to dispense important information. This template comprises three stages. It also presents valuable insights into the topics including Safeguard Efficiency Medication, Retail Supplier Relation, International Marketing. This is a completely customizable PowerPoint theme that can be put to use immediately. So, download it and address the topic impactfully.
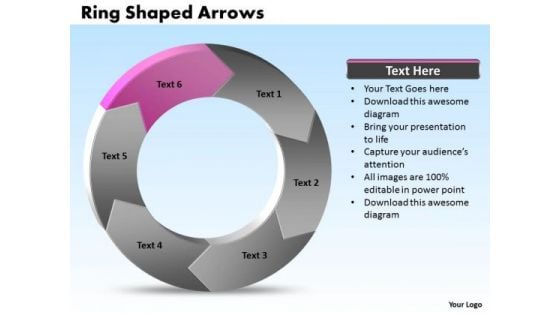
Ppt Plot Diagram PowerPoint Shaped Graphics Arrows 6 Divisions Templates
PPT plot diagram powerpoint shaped graphics arrows 6 divisions Templates-Like your thoughts arrows are inherently precise and true. Illustrate your plans to your listeners with the same accuracy. Show them how to persistently hit bulls eye.Create visually stunning and define your PPT Presentations in a unique and inspiring manner using our above template-PPT plot diagram powerpoint shaped graphics arrows 6 divisions Templates-Abstract, Around, Arrow, Arrow Circles, Chart, Circle, Circular, Circular Arrows, Circular Flow, Circulation, Cycle, Cyclic, Direction, Element, Flow, Icon, Illustration, Isolated, Motion, Movement, Refresh, Ring, Rotation, Round, Section, Set, Shape, Sign, Symbol Our Ppt Plot Diagram PowerPoint Shaped Graphics Arrows 6 Divisions Templates will ensure you make an impressive presentation You will be glad you tried us out.
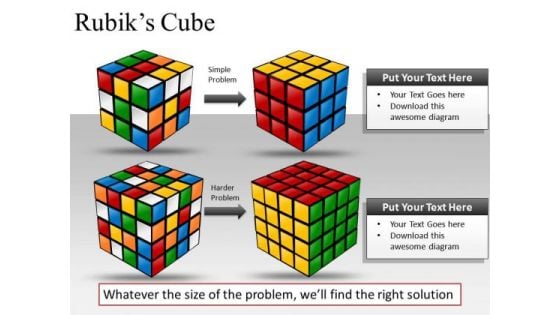
Solution Rubiks Cube PowerPoint Slides And Ppt Clipart Graphics
Solution Rubiks Cube PowerPoint Slides And PPT Clipart GraphicsThese high quality powerpoint pre-designed slides and powerpoint templates have been carefully created by our professional team to help you impress your audience. All slides have been created and are 100% editable in powerpoint. Each and every property of any graphic - color, size, orientation, shading, outline etc. can be modified to help you build an effective powerpoint presentation. Any text can be entered at any point in the powerpoint template or slide. Simply DOWNLOAD, TYPE and PRESENT! Make your discourse an eventful one. Bring on the action with our Solution Rubiks Cube PowerPoint Slides And Ppt Clipart Graphics.
Team Achievement Dashboard For Tracking Tasks Completion Graphics PDF
This slide illustrates team success dashboard for tracking tasks completion. This provides information about rate, section, incomplete, assignee, upcoming tasks, etc. Showcasing this set of slides titled team achievement dashboard for tracking tasks completion graphics pdf. The topics addressed in these templates are completion rate, spent time on project, task completion. All the content presented in this PPT design is completely editable. Download it and make adjustments in color, background, font etc. as per your unique business setting.


 Continue with Email

 Home
Home


