Benefits Dashboard
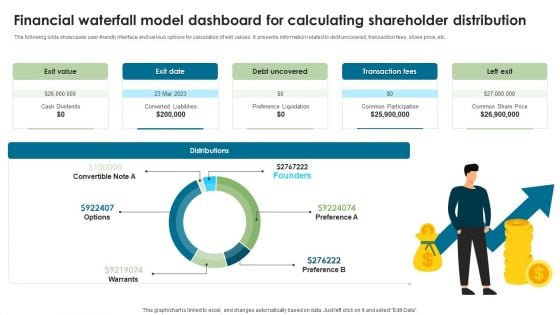
Financial Waterfall Model Dashboard For Calculating Shareholder Distribution Slides PDF
The following slide showcases user-friendly interface and various options for calculation of exit values. It presents information related to debt uncovered, transaction fees, share price, etc. Showcasing this set of slides titled Financial Waterfall Model Dashboard For Calculating Shareholder Distribution Slides PDF. The topics addressed in these templates are Exit Value, Exit Date, Debt Uncovered. All the content presented in this PPT design is completely editable. Download it and make adjustments in color, background, font etc. as per your unique business setting.

Online Kpi Dashboard Diagram Powerpoint Slide Deck Samples
This is a online kpi dashboard diagram powerpoint slide deck samples. This is a four stage process. The stages in this process are brand awareness, focus on growing audience, reach growth, strangers, lead generation, focus on conversations to valuable actions, engagement growth, customer support, ensure rapid, approved response, activity engagement, prospects, customers, community development, foster community that initiates and sustains and conversations, engagement activity, fans.
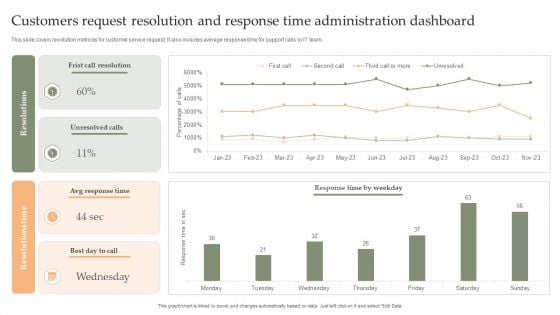
Customers Request Resolution And Response Time Administration Dashboard Mockup PDF
This slide covers resolution metrices for customer service request. It also includes average response time for support calls by IT team. Showcasing this set of slides titled Customers Request Resolution And Response Time Administration Dashboard Mockup PDF. The topics addressed in these templates are Frist Call Resolution, Unresolved Calls, Avg Response Time. All the content presented in this PPT design is completely editable. Download it and make adjustments in color, background, font etc. as per your unique business setting.
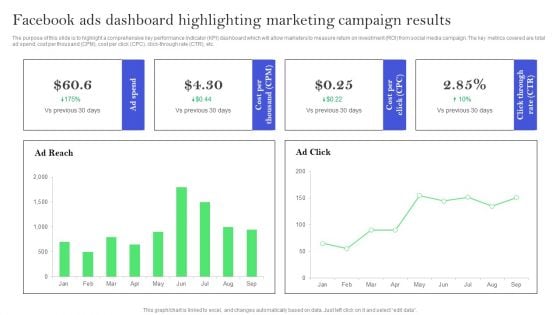
Facebook Ads Dashboard Highlighting Marketing Campaign Results Slides PDF
The purpose of this slide is to highlight a comprehensive key performance indicator KPI dashboard which will allow marketers to measure return on investment ROI from social media campaign. The key metrics covered are total ad spend, cost per thousand CPM, cost per click CPC, click through rate CTR, etc. From laying roadmaps to briefing everything in detail, our templates are perfect for you. You can set the stage with your presentation slides. All you have to do is download these easy to edit and customizable templates. Facebook Ads Dashboard Highlighting Marketing Campaign Results Slides PDF will help you deliver an outstanding performance that everyone would remember and praise you for. Do download this presentation today.
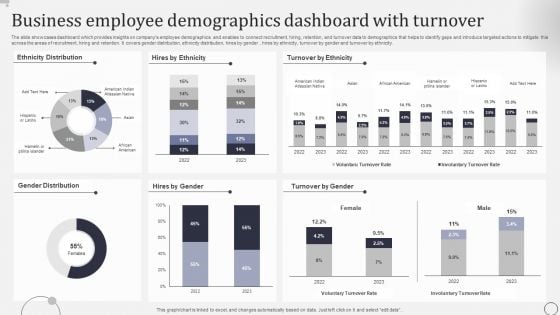
Business Employee Demographics Dashboard With Turnover Graphics PDF
The slide showcases dashboard which provides insights on companys employee demographics and enables to connect recruitment, hiring, retention, and turnover data to demographics that helps to identify gaps and introduce targeted actions to mitigate this across the areas of recruitment, hiring and retention. It covers gender distribution, ethnicity distribution, hires by gender , hires by ethnicity, turnover by gender and turnover by ethnicity. Showcasing this set of slides titled Business Employee Demographics Dashboard With Turnover Graphics PDF The topics addressed in these templates are Ethnicity Distribution, Turnover Ethnicity, Gender Distribution. All the content presented in this PPT design is completely editable. Download it and make adjustments in color, background, font etc. as per your unique business setting.
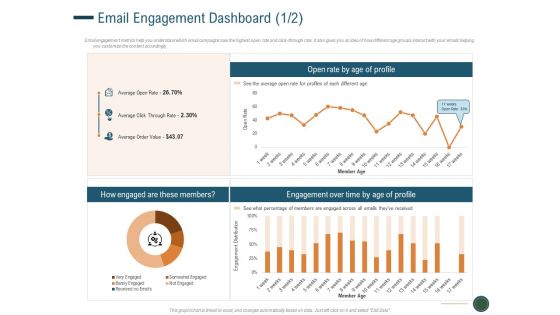
Enhance Profit Client Journey Analysis Email Engagement Dashboard Slides PDF
Email engagement metrics help you understand which email campaigns saw the highest open rate and click-through rate. It also gives you an idea of how different age groups interact with your emails helping you customize the content accordingly. Deliver and pitch your topic in the best possible manner with this enhance profit client journey analysis email engagement dashboard slides pdf. Use them to share invaluable insights on engagement over time by age of profile, open rate by age of profile and impress your audience. This template can be altered and modified as per your expectations. So, grab it now.
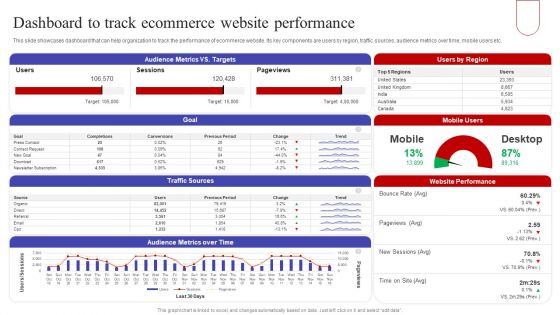
Dashboard To Track Ecommerce Website Performance Summary PDF
This slide showcases dashboard that can help organization to track the performance of ecommerce website. Its key components are users by region, traffic sources, audience metrics over time, mobile users etc. Do you know about Slidesgeeks Dashboard To Track Ecommerce Website Performance Summary PDF These are perfect for delivering any kind od presentation. Using it, create PowerPoint presentations that communicate your ideas and engage audiences. Save time and effort by using our pre designed presentation templates that are perfect for a wide range of topic. Our vast selection of designs covers a range of styles, from creative to business, and are all highly customizable and easy to edit. Download as a PowerPoint template or use them as Google Slides themes.
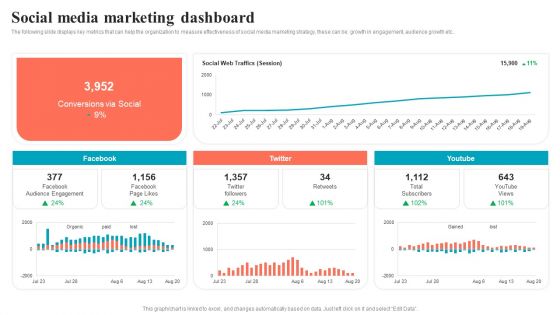
Brand Positioning Through Successful Social Media Marketing Dashboard Background PDF
The following slide displays key metrics that can help the organization to measure effectiveness of social media marketing strategy, these can be growth in engagement, audience growth etc. Do you have to make sure that everyone on your team knows about any specific topic I yes, then you should give Brand Positioning Through Successful Social Media Marketing Dashboard Background PDF a try. Our experts have put a lot of knowledge and effort into creating this impeccable Brand Positioning Through Successful Social Media Marketing Dashboard Background PDF. You can use this template for your upcoming presentations, as the slides are perfect to represent even the tiniest detail. You can download these templates from the Slidegeeks website and these are easy to edit. So grab these today.
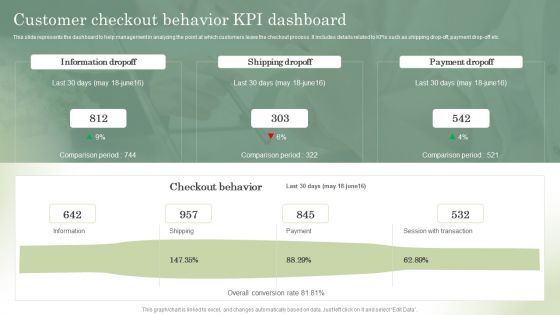
Optimizing Online Stores Customer Checkout Behavior KPI Dashboard Brochure PDF
This slide represents the dashboard to help management in analyzing the point at which customers leave the checkout process. It includes details related to KPIs such as shipping drop-off, payment drop-off etc. Slidegeeks is here to make your presentations a breeze with Optimizing Online Stores Customer Checkout Behavior KPI Dashboard Brochure PDF With our easy-to-use and customizable templates, you can focus on delivering your ideas rather than worrying about formatting. With a variety of designs to choose from, youre sure to find one that suits your needs. And with animations and unique photos, illustrations, and fonts, you can make your presentation pop. So whether youre giving a sales pitch or presenting to the board, make sure to check out Slidegeeks first.
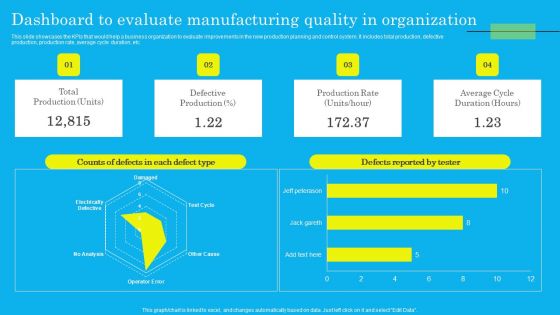
Dashboard To Evaluate Manufacturing Quality In Organization Elements PDF
This slide showcases the KPIs that would help a business organization to evaluate improvements in the new production planning and control system. It includes total production, defective production, production rate, average cycle duration, etc. Here you can discover an assortment of the finest PowerPoint and Google Slides templates. With these templates, you can create presentations for a variety of purposes while simultaneously providing your audience with an eye catching visual experience. Download Dashboard To Evaluate Manufacturing Quality In Organization Elements PDF to deliver an impeccable presentation. These templates will make your job of preparing presentations much quicker, yet still, maintain a high level of quality. Slidegeeks has experienced researchers who prepare these templates and write high quality content for you. Later on, you can personalize the content by editing the Dashboard To Evaluate Manufacturing Quality In Organization Elements PDF.
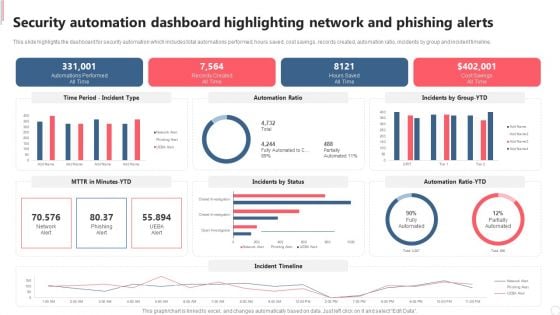
Security Automation Dashboard Highlighting Network And Phishing Alerts Demonstration PDF
This slide highlights the dashboard for security automation which includes total automations performed, hours saved, cost savings, records created, automation ratio, incidents by group and incident timeline. Welcome to our selection of the Security Automation Dashboard Highlighting Network And Phishing Alerts Demonstration PDF. These are designed to help you showcase your creativity and bring your sphere to life. Planning and Innovation are essential for any business that is just starting out. This collection contains the designs that you need for your everyday presentations. All of our PowerPoints are 100 percent editable, so you can customize them to suit your needs. This multi purpose template can be used in various situations. Grab these presentation templates today.
Dashboard For Tracking Brand Awareness Advertisement Campaign Results Designs PDF
This slide showcases dashboard that can help organization to track results of online advertisement campaigns. Its key components ad impressions, click through rate, cost per conversion, revenue per click, impressions, new users and sessions.Are you in need of a template that can accommodate all of your creative concepts This one is crafted professionally and can be altered to fit any style. Use it with Google Slides or PowerPoint. Include striking photographs, symbols, depictions, and other visuals. Fill, move around, or remove text boxes as desired. Test out color palettes and font mixtures. Edit and save your work, or work with colleagues. Download Dashboard For Tracking Brand Awareness Advertisement Campaign Results Designs PDF and observe how to make your presentation outstanding. Give an impeccable presentation to your group and make your presentation unforgettable.
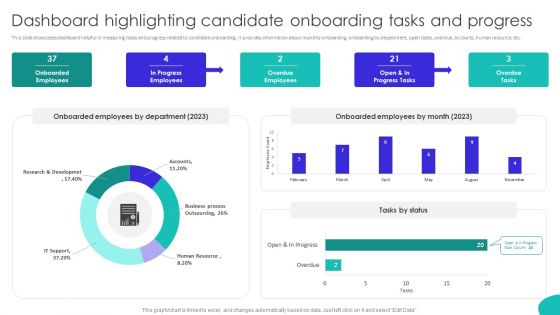
Improving Technology Based Dashboard Highlighting Candidate Onboarding Tasks Information PDF
This slide showcases dashboard helpful in measuring tasks and progress related to candidate onboarding. It provides information about monthly onboarding, onboarding by department, open tasks, overdue, accounts, human resource, etc. Slidegeeks is here to make your presentations a breeze with Improving Technology Based Dashboard Highlighting Candidate Onboarding Tasks Information PDF With our easy-to-use and customizable templates, you can focus on delivering your ideas rather than worrying about formatting. With a variety of designs to choose from, youre sure to find one that suits your needs. And with animations and unique photos, illustrations, and fonts, you can make your presentation pop. So whether youre giving a sales pitch or presenting to the board, make sure to check out Slidegeeks first.
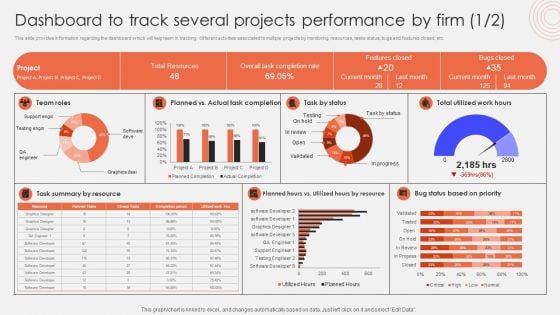
Dashboard To Track Several Projects Performance By Firm Designs PDF
This slide provides information regarding the dashboard which will help team in tracking different activities associated to multiple projects by monitoring resources, tasks status, bugs and features closed, etc. Are you in need of a template that can accommodate all of your creative concepts This one is crafted professionally and can be altered to fit any style. Use it with Google Slides or PowerPoint. Include striking photographs, symbols, depictions, and other visuals. Fill, move around, or remove text boxes as desired. Test out color palettes and font mixtures. Edit and save your work, or work with colleagues. Download Dashboard To Track Several Projects Performance By Firm Designs PDF and observe how to make your presentation outstanding. Give an impeccable presentation to your group and make your presentation unforgettable.
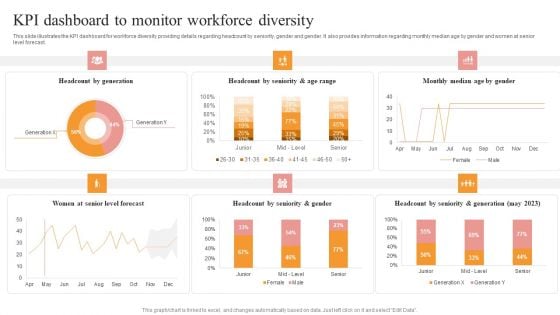
KPI Dashboard To Monitor Workforce Diversity Portrait PDF
This slide illustrates the KPI dashboard for workforce diversity providing details regarding headcount by seniority, gender and gender. It also provides information regarding monthly median age by gender and women at senior level forecast. Welcome to our selection of the KPI Dashboard To Monitor Workforce Diversity Portrait PDF. These are designed to help you showcase your creativity and bring your sphere to life. Planning and Innovation are essential for any business that is just starting out. This collection contains the designs that you need for your everyday presentations. All of our PowerPoints are 100 percent editable, so you can customize them to suit your needs. This multi purpose template can be used in various situations. Grab these presentation templates today.
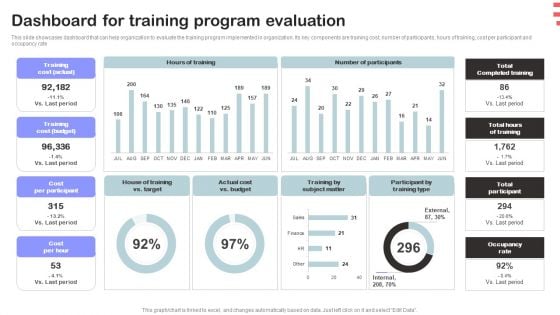
Corporate Training Program Dashboard For Training Program Evaluation Summary PDF
This slide showcases dashboard that can help organization to evaluate the training program implemented in organization. Its key components are training cost, number of participants, hours of training, cost per participant and occupancy rate Are you in need of a template that can accommodate all of your creative concepts This one is crafted professionally and can be altered to fit any style. Use it with Google Slides or PowerPoint. Include striking photographs, symbols, depictions, and other visuals. Fill, move around, or remove text boxes as desired. Test out color palettes and font mixtures. Edit and save your work, or work with colleagues. Download Corporate Training Program Dashboard For Training Program Evaluation Summary PDF and observe how to make your presentation outstanding. Give an impeccable presentation to your group and make your presentation unforgettable.
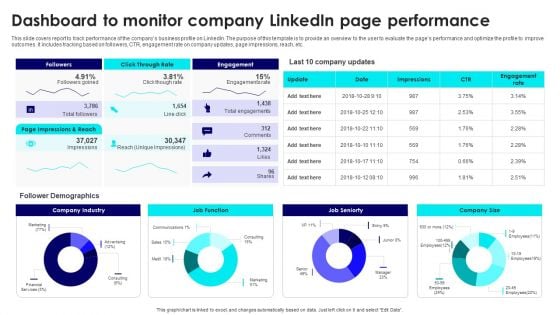
Dashboard To Monitor Company Linkedin Page Performance Portrait PDF
This slide covers report to track performance of the companys business profile on LinkedIn. The purpose of this template is to provide an overview to the user to evaluate the pages performance and optimize the profile to improve outcomes. It includes tracking based on followers, CTR, engagement rate on company updates, page impressions, reach, etc. Create an editable Dashboard To Monitor Company Linkedin Page Performance Portrait PDF that communicates your idea and engages your audience. Whether you are presenting a business or an educational presentation, pre designed presentation templates help save time. Dashboard To Monitor Company Linkedin Page Performance Portrait PDF is highly customizable and very easy to edit, covering many different styles from creative to business presentations. Slidegeeks has creative team members who have crafted amazing templates. So, go and get them without any delay.
Website Performance Tracking And Monitoring Dashboard Inspiration PDF
The following slide showcases a dashboard to track and measure website performance. It includes key elements such as visits, average session duration, bounce rate, page views, goal conversion, visits by week, traffic sources, top channels by conversions, etc. Welcome to our selection of the Website Performance Tracking And Monitoring Dashboard Inspiration PDF. These are designed to help you showcase your creativity and bring your sphere to life. Planning and Innovation are essential for any business that is just starting out. This collection contains the designs that you need for your everyday presentations. All of our PowerPoints are 100 percent editable, so you can customize them to suit your needs. This multi purpose template can be used in various situations. Grab these presentation templates today.
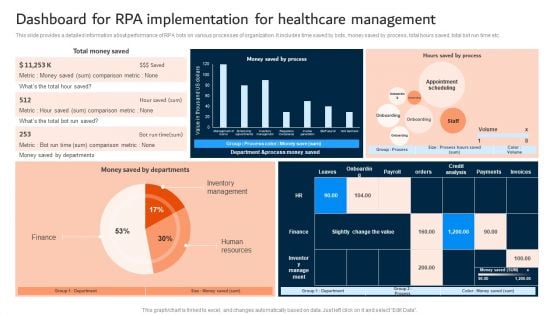
Dashboard For RPA Implementation For Healthcare Management Slides PDF
This slide provides a detailed information about performance of RPA bots on various processes of organization. It includes time saved by bots, money saved by process, total hours saved, total bot run time etc. Formulating a presentation can take up a lot of effort and time, so the content and message should always be the primary focus. The visuals of the PowerPoint can enhance the presenters message, so our Dashboard For RPA Implementation For Healthcare Management Slides PDF was created to help save time. Instead of worrying about the design, the presenter can concentrate on the message while our designers work on creating the ideal templates for whatever situation is needed. Slidegeeks has experts for everything from amazing designs to valuable content, we have put everything into Dashboard For RPA Implementation For Healthcare Management Slides PDF.
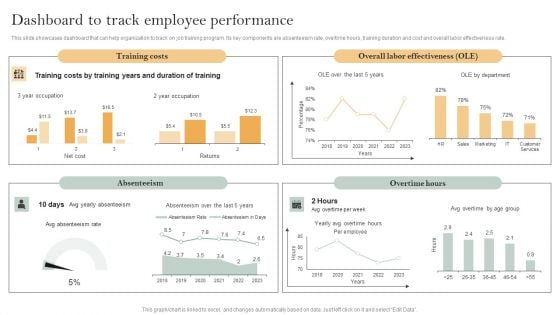
Skill Enhancement Plan Dashboard To Track Employee Performance Microsoft PDF
This slide showcases dashboard that can help organization to track on job training program. Its key components are absenteeism rate, overtime hours, training duration and cost and overall labor effectiveness rate. Present like a pro with Skill Enhancement Plan Dashboard To Track Employee Performance Microsoft PDF Create beautiful presentations together with your team, using our easy-to-use presentation slides. Share your ideas in real-time and make changes on the fly by downloading our templates. So whether you are in the office, on the go, or in a remote location, you can stay in sync with your team and present your ideas with confidence. With Slidegeeks presentation got a whole lot easier. Grab these presentations today.
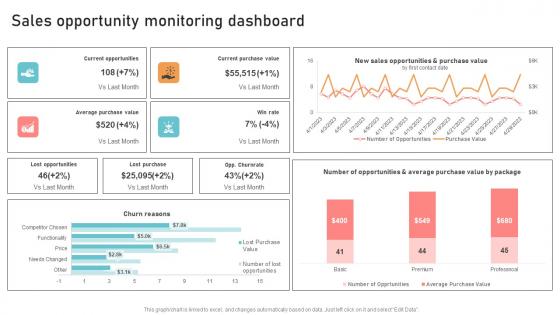
Optimizing Business Integration Sales Opportunity Monitoring Dashboard Diagrams Pdf
Welcome to our selection of the Optimizing Business Integration Sales Opportunity Monitoring Dashboard Diagrams Pdf. These are designed to help you showcase your creativity and bring your sphere to life. Planning and Innovation are essential for any business that is just starting out. This collection contains the designs that you need for your everyday presentations. All of our PowerPoints are 100 percent editable, so you can customize them to suit your needs. This multi purpose template can be used in various situations. Grab these presentation templates today. Our Optimizing Business Integration Sales Opportunity Monitoring Dashboard Diagrams Pdf are topically designed to provide an attractive backdrop to any subject. Use them to look like a presentation pro.
Tracking The Improvements With Buzz Marketing Dashboard Template PDF
This slide showcases the KPIs that would help the business organization to evaluate buzz marketing campaigns improvements. It includes social media followers, YouTube subscribers, Facebook engagement and page impressions, page likes, etc. There are so many reasons you need a Tracking The Improvements With Buzz Marketing Dashboard Template PDF. The first reason is you can not spend time making everything from scratch, Thus, Slidegeeks has made presentation templates for you too. You can easily download these templates from our website easily.
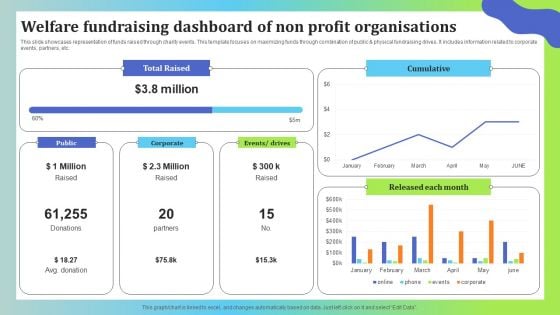
Welfare Fundraising Dashboard Of Non Profit Organisations Graphics PDF
This slide showcases representation of funds raised through charity events. This template focuses on maximizing funds through combination of public and physical fundraising drives. It includes information related to corporate events, partners, etc. Showcasing this set of slides titled Welfare Fundraising Dashboard Of Non Profit Organisations Graphics PDF. The topics addressed in these templates are Total Raised, Cumulative, Each Month. All the content presented in this PPT design is completely editable. Download it and make adjustments in color, background, font etc. as per your unique business setting.
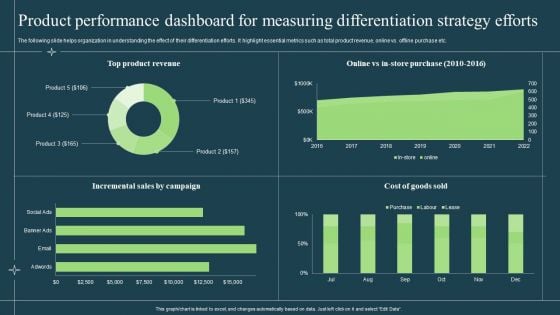
Product Performance Dashboard For Measuring Differentiation Strategy Efforts Diagrams PDF
The following slide helps organization in understanding the effect of their differentiation efforts. It highlight essential metrics such as total product revenue, online vs. offline purchase etc. Deliver an awe inspiring pitch with this creative Product Performance Dashboard For Measuring Differentiation Strategy Efforts Diagrams PDF bundle. Topics like Product, Incremental Sales, Cost Of Goods can be discussed with this completely editable template. It is available for immediate download depending on the needs and requirements of the user.
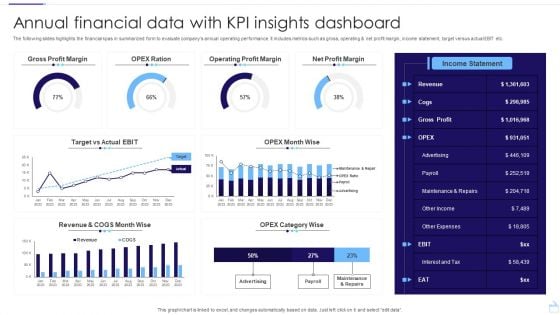
Annual Financial Data With KPI Insights Dashboard Structure PDF
The following slides highlights the financial kpas in summarized form to evaluate companys annual operating performance. It includes metrics such as gross, operating and net profit margin, income statement, target versus actual EBIT etc. Pitch your topic with ease and precision using this Annual Financial Data With KPI Insights Dashboard Structure PDF. This layout presents information on Gross Profit Margin, Operating Profit Margin, Net Profit Margin. It is also available for immediate download and adjustment. So, changes can be made in the color, design, graphics or any other component to create a unique layout.
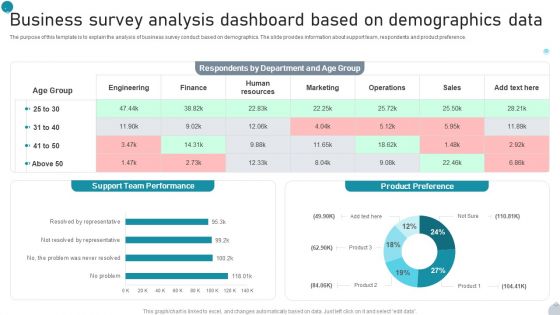
Business Survey Analysis Dashboard Based On Demographics Data Microsoft PDF
The purpose of this template is to explain the analysis of business survey conduct based on demographics. The slide provides information about support team, respondents and product preference. Pitch your topic with ease and precision using this Business Survey Analysis Dashboard Based On Demographics Data Microsoft PDF. This layout presents information on Support, Team Performance, Product Preference It is also available for immediate download and adjustment. So, changes can be made in the color, design, graphics or any other component to create a unique layout.
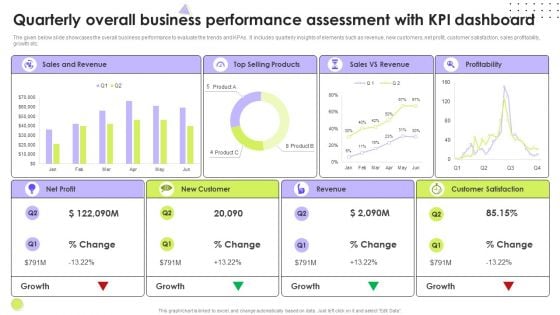
Quarterly Overall Business Performance Assessment With Kpi Dashboard Microsoft PDF
The given below slide showcases the overall business performance to evaluate the trends and KPAs. It includes quarterly insights of elements such as revenue, new customers, net profit, customer satisfaction, sales profitability, growth etc. Pitch your topic with ease and precision using this Quarterly Overall Business Performance Assessment With Kpi Dashboard Microsoft PDF. This layout presents information on Revenue, Customer Satisfaction, Net Profit. It is also available for immediate download and adjustment. So, changes can be made in the color, design, graphics or any other component to create a unique layout.
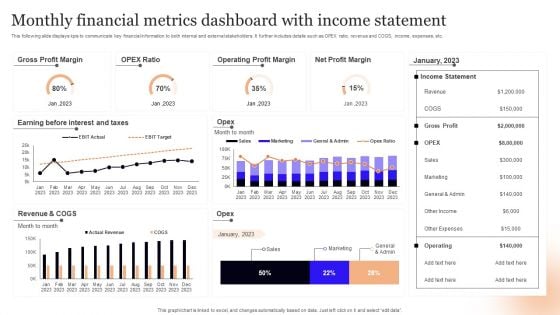
Monthly Financial Metrics Dashboard With Income Statement Infographics PDF
This following slide displays kpis to communicate key financial information to both internal and external stakeholders. It further includes details such as OPEX ratio, revenue and COGS, income, expenses, etc. Showcasing this set of slides titled Monthly Financial Metrics Dashboard With Income Statement Infographics PDF. The topics addressed in these templates are Gross Profit Margin, Taxes, Revenue. All the content presented in this PPT design is completely editable. Download it and make adjustments in color, background, font etc. as per your unique business setting.
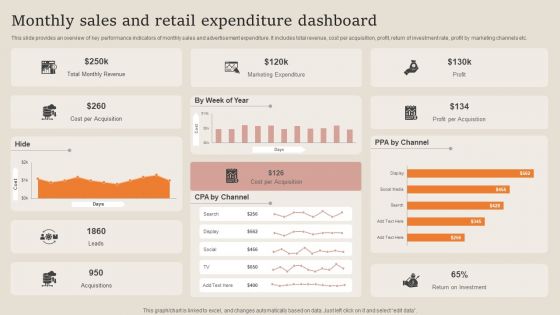
Monthly Sales And Retail Expenditure Dashboard Summary PDF
This slide provides an overview of key performance indicators of monthly sales and advertisement expenditure. It includes total revenue, cost per acquisition, profit, return of investment rate, profit by marketing channels etc. Pitch your topic with ease and precision using this Monthly Sales And Retail Expenditure Dashboard Summary PDF. This layout presents information on Marketing Expenditure, Revenue, Cost Per Acquisition. It is also available for immediate download and adjustment. So, changes can be made in the color, design, graphics or any other component to create a unique layout.
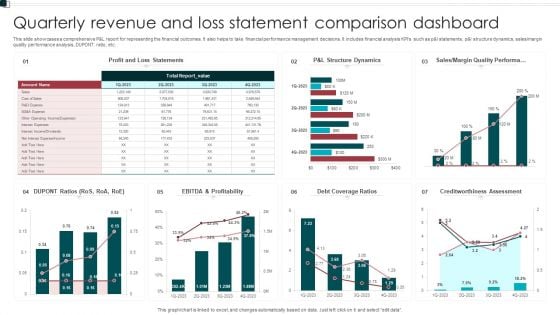
Quarterly Revenue And Loss Statement Comparison Dashboard Portrait PDF
This slide showcases a comprehensive P and L report for representing the financial outcomes. It also helps to take financial performance management decisions. It includes financial analysis KPIs such as p and l statements, p and l structure dynamics, sales or margin quality performance analysis, DUPONT ratio, etc. Showcasing this set of slides titled Quarterly Revenue And Loss Statement Comparison Dashboard Portrait PDF. The topics addressed in these templates are Profitability, Debt Coverage Ratios, Margin Quality Performa. All the content presented in this PPT design is completely editable. Download it and make adjustments in color, background, font etc. as per your unique business setting.
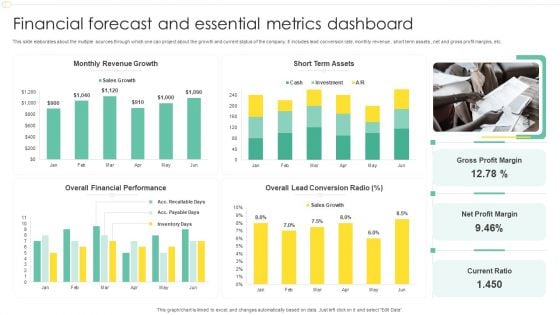
Financial Forecast And Essential Metrics Dashboard Ppt File Show PDF
This slide elaborates about the multiple sources through which one can project about the growth and current status of the company. It includes lead conversion rate, monthly revenue , short term assets , net and gross profit margins, etc. Pitch your topic with ease and precision using this Financial Forecast And Essential Metrics Dashboard Ppt File Show PDF. This layout presents information on Monthly Revenue Growth, Short Term Assets, Overall Financial Performance, Net Profit Margin. It is also available for immediate download and adjustment. So, changes can be made in the color, design, graphics or any other component to create a unique layout.
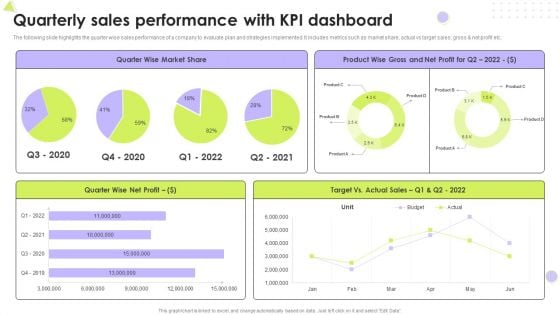
Quarterly Sales Performance With Kpi Dashboard Introduction PDF
The following slide highlights the quarter wise sales performance of a company to evaluate plan and strategies implemented. It includes metrics such as market share, actual vs target sales, gross and net profit etc. Pitch your topic with ease and precision using this Quarterly Sales Performance With Kpi Dashboard Introduction PDF. This layout presents information on Market Share, Net Profit, Target. It is also available for immediate download and adjustment. So, changes can be made in the color, design, graphics or any other component to create a unique layout.
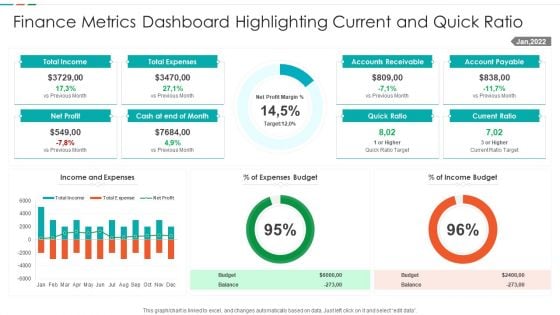
Finance Metrics Dashboard Highlighting Current And Quick Ratio Template PDF
This graph or chart is linked to excel, and changes automatically based on data. Just left click on it and select edit data. Showcasing this set of slides titled Finance Metrics Dashboard Highlighting Current And Quick Ratio Template PDF. The topics addressed in these templates are Total Income Budget, Total Expenses Balance, Net Profit Quick, Ratio Current Ratio. All the content presented in this PPT design is completely editable. Download it and make adjustments in color, background, font etc. as per your unique business setting.
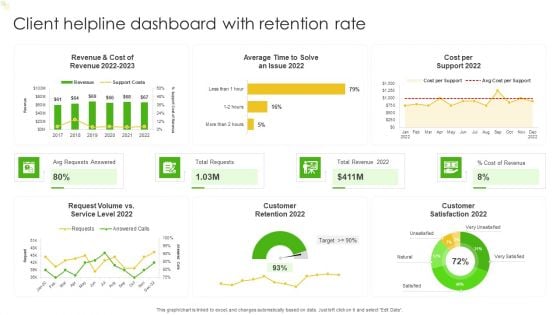
Client Helpline Dashboard With Retention Rate Ppt Gallery Ideas PDF
This graph or chart is linked to excel, and changes automatically based on data. Just left click on it and select Edit Data. Pitch your topic with ease and precision using this Client Helpline Dashboard With Retention Rate Ppt Gallery Ideas PDF. This layout presents information on Cost per Support 2022, Total Requests, Total Revenue 2022, Avg Requests Answered. It is also available for immediate download and adjustment. So, changes can be made in the color, design, graphics or any other component to create a unique layout.
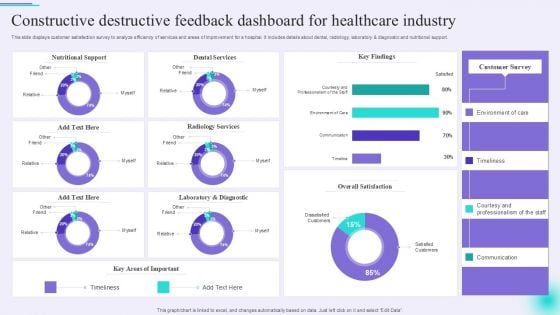
Constructive Destructive Feedback Dashboard For Healthcare Industry Guidelines PDF
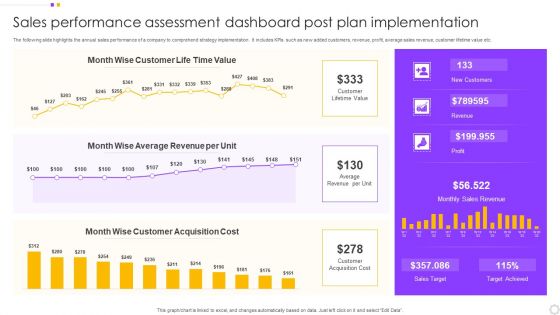
Sales Performance Assessment Dashboard Post Plan Implementation Introduction PDF
The following slide highlights the annual sales performance of a company to comprehend strategy implementation. It includes KPIs such as new added customers, revenue, profit, average sales revenue, customer lifetime value etc. Pitch your topic with ease and precision using this Sales Performance Assessment Dashboard Post Plan Implementation Introduction PDF. This layout presents information on Customer, Value, Average Revenue. It is also available for immediate download and adjustment. So, changes can be made in the color, design, graphics or any other component to create a unique layout.

Client Support Dashboard Ppt PowerPoint Presentation Complete Deck With Slides
Boost your confidence and team morale with this well-structured Client Support Dashboard Ppt PowerPoint Presentation Complete Deck With Slides. This prefabricated set gives a voice to your presentation because of its well-researched content and graphics. Our experts have added all the components very carefully, thus helping you deliver great presentations with a single click. Not only that, it contains a set of twelve slides that are designed using the right visuals, graphics, etc. Various topics can be discussed, and effective brainstorming sessions can be conducted using the wide variety of slides added in this complete deck. Apart from this, our PPT design contains clear instructions to help you restructure your presentations and create multiple variations. The color, format, design anything can be modified as deemed fit by the user. Not only this, it is available for immediate download. So, grab it now.

Healthcare Big Data Assessment Dashboard Slide2 Introduction PDF
This slide covers the records about the patients used to describe massive volumes of information created by the adoption of digital technologies that collect patients records and help in managing hospital performance. Showcasing this set of slides titled Healthcare Big Data Assessment Dashboard Slide2 Introduction PDF. The topics addressed in these templates are Forecasted Patient Turnover, Service Indicators, Occupancy. All the content presented in this PPT design is completely editable. Download it and make adjustments in color, background, font etc. as per your unique business setting.
Enhancing CX Strategy Customer Service Kpi Tracking Dashboard Themes PDF
This Enhancing CX Strategy Customer Service Kpi Tracking Dashboard Themes PDF from Slidegeeks makes it easy to present information on your topic with precision. It provides customization options, so you can make changes to the colors, design, graphics, or any other component to create a unique layout. It is also available for immediate download, so you can begin using it right away. Slidegeeks has done good research to ensure that you have everything you need to make your presentation stand out. Make a name out there for a brilliant performance.
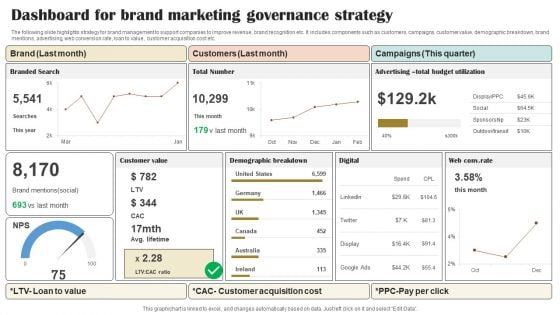
Dashboard For Brand Marketing Governance Strategy Portrait PDF
The following slide highlights strategy for brand management to support companies to improve revenue, brand recognition etc. It includes components such as customers, campaigns, customer value, demographic breakdown, brand mentions, advertising, web conversion rate, loan to value, customer acquisition cost etc. Pitch your topic with ease and precision using this Dashboard For Brand Marketing Governance Strategy Portrait PDF. This layout presents information on Brand, Customers, Campaigns. It is also available for immediate download and adjustment. So, changes can be made in the color, design, graphics or any other component to create a unique layout.
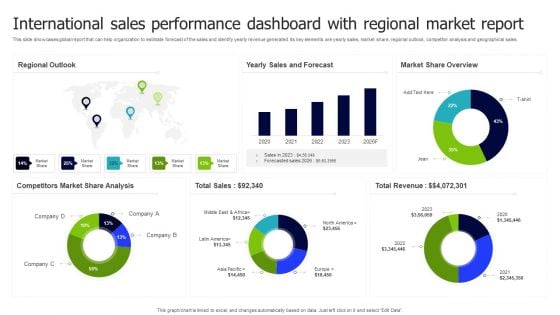
International Sales Performance Dashboard With Regional Market Report Inspiration PDF
This slide showcases global report that can help organization to estimate forecast of the sales and identify yearly revenue generated. Its key elements are yearly sales, market share, regional outlook, competitor analysis and geographical sales. Pitch your topic with ease and precision using this International Sales Performance Dashboard With Regional Market Report Inspiration PDF. This layout presents information on Regional Outlook, Sales And Forecast, Market Share Overview. It is also available for immediate download and adjustment. So, changes can be made in the color, design, graphics or any other component to create a unique layout.
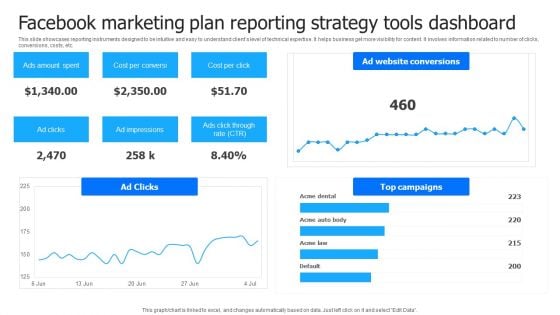
Facebook Marketing Plan Reporting Strategy Tools Dashboard Information PDF
This slide showcases reporting instruments designed to be intuitive and easy to understand clients level of technical expertise. It helps business get more visibility for content. It involves information related to number of clicks, conversions, costs, etc. Showcasing this set of slides titled Facebook Marketing Plan Reporting Strategy Tools Dashboard Information PDF Elements. The topics addressed in these templates are Ads Amount Spent, Cost Per Conversion, Cost Per Click. All the content presented in this PPT design is completely editable. Download it and make adjustments in color, background, font etc. as per your unique business setting.
Multi Cloud Infrastructure Management Cloud Performance Tracking Dashboard Diagrams PDF
This slide covers the Key performance indicators for tracking performance of the cloud such as violations break down, sources, rules and severity. From laying roadmaps to briefing everything in detail, our templates are perfect for you. You can set the stage with your presentation slides. All you have to do is download these easy-to-edit and customizable templates. Multi Cloud Infrastructure Management Cloud Performance Tracking Dashboard Diagrams PDF will help you deliver an outstanding performance that everyone would remember and praise you for. Do download this presentation today.

Improving Corporate Performance Sales Opportunity Monitoring Dashboard Portrait PDF
This graph or chart is linked to excel, and changes automatically based on data. Just left click on it and select Edit Data. Welcome to our selection of the Improving Corporate Performance Sales Opportunity Monitoring Dashboard Portrait PDF. These are designed to help you showcase your creativity and bring your sphere to life. Planning and Innovation are essential for any business that is just starting out. This collection contains the designs that you need for your everyday presentations. All of our PowerPoints are 100 percent editable, so you can customize them to suit your needs. This multi-purpose template can be used in various situations. Grab these presentation templates today.
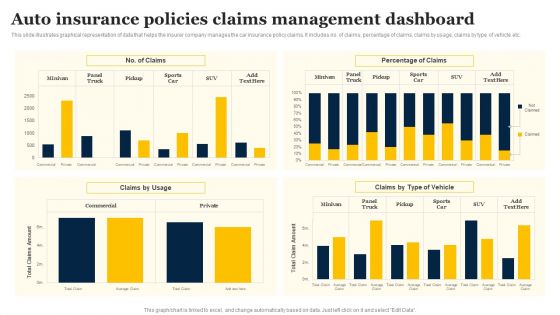
Auto Insurance Policies Claims Management Dashboard Infographics PDF
This slide illustrates graphical representation of data that helps the insurer company manages the car insurance policy claims. It includes no. of claims, percentage of claims, claims by usage, claims by type of vehicle etc. Pitch your topic with ease and precision using this Auto Insurance Policies Claims Management Dashboard Infographics PDF. This layout presents information on Percentage Claims, Claims Usage, Claims Type Vehicle. It is also available for immediate download and adjustment. So, changes can be made in the color, design, graphics or any other component to create a unique layout.
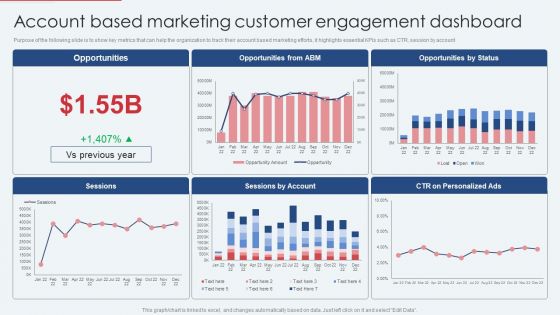
Account Based Marketing Customer Engagement Dashboard Infographics PDF
Purpose of the following slide is to show key metrics that can help the organization to track their account based marketing efforts, it highlights essential KPIs such as CTR, session by account. Boost your pitch with our creative Account Based Marketing Customer Engagement Dashboard Infographics PDF. Deliver an awe inspiring pitch that will mesmerize everyone. Using these presentation templates you will surely catch everyones attention. You can browse the ppts collection on our website. We have researchers who are experts at creating the right content for the templates. So you do not have to invest time in any additional work. Just grab the template now and use them.
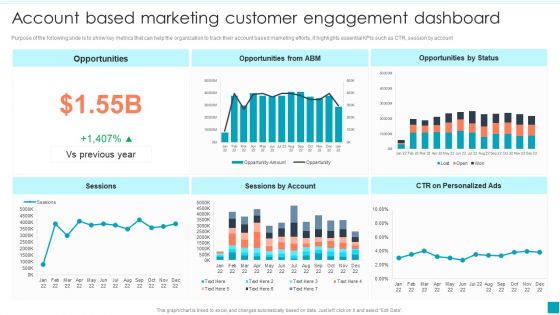
Account Based Marketing Customer Engagement Dashboard Demonstration PDF
Purpose of the following slide is to show key metrics that can help the organization to track their account based marketing efforts, it highlights essential KPIs such as CTR, session by account.Find a pre-designed and impeccable Account Based Marketing Customer Engagement Dashboard Demonstration PDF. The templates can ace your presentation without additional effort. You can download these easy-to-edit presentation templates to make your presentation stand out from others. So, what are you waiting for Download the template from Slidegeeks today and give a unique touch to your presentation.
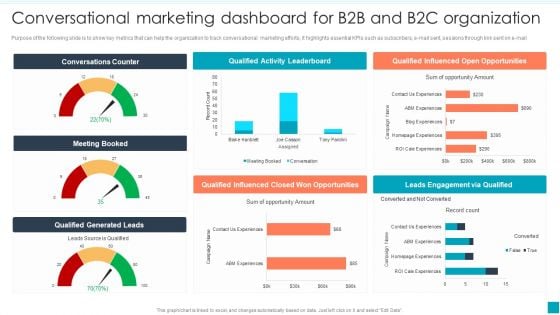
Conversational Marketing Dashboard For B2B And B2C Organization Mockup PDF
Purpose of the following slide is to show key metrics that can help the organization to track conversational marketing efforts, it highlights essential KPIs such as subscribers, e-mail sent, sessions through link sent on e-mail. If your project calls for a presentation, then Slidegeeks is your go-to partner because we have professionally designed, easy-to-edit templates that are perfect for any presentation. After downloading, you can easily edit Conversational Marketing Dashboard For B2B And B2C Organization Mockup PDF and make the changes accordingly. You can rearrange slides or fill them with different images. Check out all the handy templates.
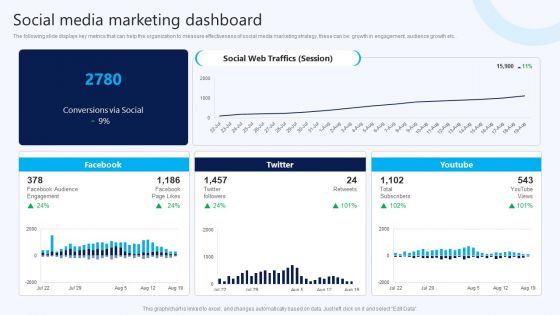
Social Media Marketing Dashboard B2B Electronic Commerce Startup Microsoft PDF
The following slide displays key metrics that can help the organization to measure effectiveness of social media marketing strategy, these can be growth in engagement, audience growth etc. Present like a pro with Social Media Marketing Dashboard B2B Electronic Commerce Startup Microsoft PDF Create beautiful presentations together with your team, using our easy-to-use presentation slides. Share your ideas in real-time and make changes on the fly by downloading our templates. So whether you are in the office, on the go, or in a remote location, you can stay in sync with your team and present your ideas with confidence. With Slidegeeks presentation got a whole lot easier. Grab these presentations today.

Virtual Assets Investment Guide Cryptocurrency Portfolio Investment Dashboard Guidelines PDF
Identifying the metrics which help in analyzing the product performance play a crucial role when it comes to tracking performance. The following slide highlights such manor KPIs, these are total sell, total buy, etc. Deliver an awe inspiring pitch with this creative Virtual Assets Investment Guide Cryptocurrency Portfolio Investment Dashboard Guidelines PDF bundle. Topics like Bitcoin BTC, Total Sell, Total Buy can be discussed with this completely editable template. It is available for immediate download depending on the needs and requirements of the user.
Tracking The Cashflow Improvements With Cash Management Dashboard Download PDF
This slide showcases the KPIs that would help our business organization to track the improvements in the new cash management process. It includes quick ratio, cash balance, current ratio, days inventory outstanding, etc.Take your projects to the next level with our ultimate collection of Tracking The Cashflow Improvements With Cash Management Dashboard Download PDF. Slidegeeks has designed a range of layouts that are perfect for representing task or activity duration, keeping track of all your deadlines at a glance. Tailor these designs to your exact needs and give them a truly corporate look with your own brand colors they all make your projects stand out from the rest.
Tracking Goals Dashboard With Progress Report Rules PDF
This slide showcases the progress report which helps to determine gaps in the objective achievement process and take corrective actions. It also includes objective details such as contributor, due date, and progress percentage. Showcasing this set of slides titled Tracking Goals Dashboard With Progress Report Rules PDF. The topics addressed in these templates are Immediate Action Required, Progress Update Required, Concise Goal Outcome Required. All the content presented in this PPT design is completely editable. Download it and make adjustments in color, background, font etc. as per your unique business setting.
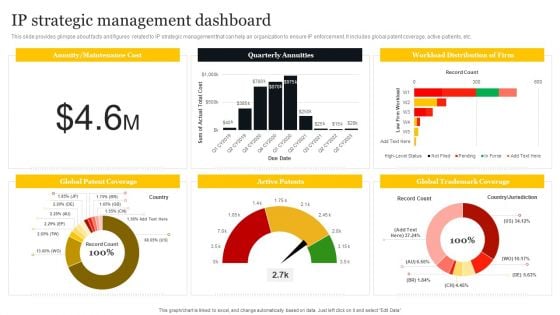
IP Strategic Management Dashboard Ppt PowerPoint Presentation File Example PDF
This slide provides glimpse about facts and figures related to IP strategic management that can help an organization to ensure IP enforcement. It includes global patent coverage, active patients, etc. Showcasing this set of slides titled IP Strategic Management Dashboard Ppt PowerPoint Presentation File Example PDF. The topics addressed in these templates are Quarterly Annuities, Workload Distribution Firm, Active Patents. All the content presented in this PPT design is completely editable. Download it and make adjustments in color, background, font etc. as per your unique business setting.
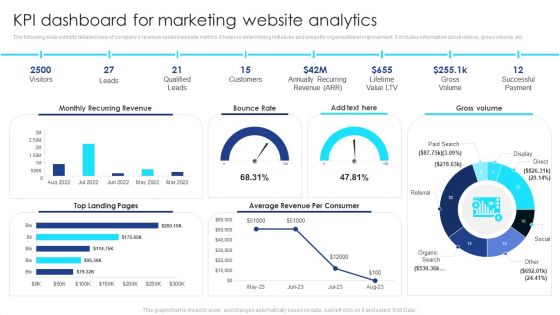
KPI Dashboard For Marketing Website Analytics Summary PDF
The following slide exhibits detailed view of companys revenue-related website metrics. It helps in determining initiatives and areas for organisational improvement. It includes information about visitors, gross volume, etc. Pitch your topic with ease and precision using this KPI Dashboard For Marketing Website Analytics Summary PDF. This layout presents information on Visitors, Leads, Qualified Leads, Customers, Gross Volume, Successful Payment. It is also available for immediate download and adjustment. So, changes can be made in the color, design, graphics or any other component to create a unique layout.
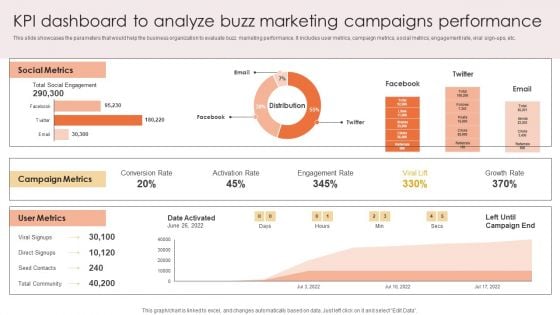
Kpi Dashboard To Analyze Buzz Marketing Campaigns Performance Download PDF
This slide showcases the parameters that would help the business organization to evaluate buzz marketing performance. It includes user metrics, campaign metrics, social metrics, engagement rate, viral sign-ups, etc. Take your projects to the next level with our ultimate collection of Kpi Dashboard To Analyze Buzz Marketing Campaigns Performance Download PDF. Slidegeeks has designed a range of layouts that are perfect for representing task or activity duration, keeping track of all your deadlines at a glance. Tailor these designs to your exact needs and give them a truly corporate look with your own brand colors they will make your projects stand out from the rest.
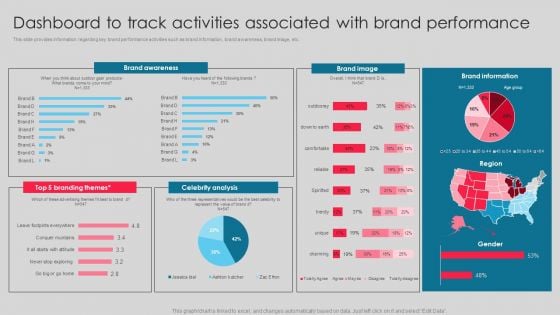
Dashboard To Track Activities Associated With Brand Performance Clipart PDF
This slide provides information regarding key brand performance activities such as brand information, brand awareness, brand image, etc. Want to ace your presentation in front of a live audience Our Dashboard To Track Activities Associated With Brand Performance Clipart PDF can help you do that by engaging all the users towards you. Slidegeeks experts have put their efforts and expertise into creating these impeccable powerpoint presentations so that you can communicate your ideas clearly. Moreover, all the templates are customizable, and easy to edit and downloadable. Use these for both personal and commercial use.
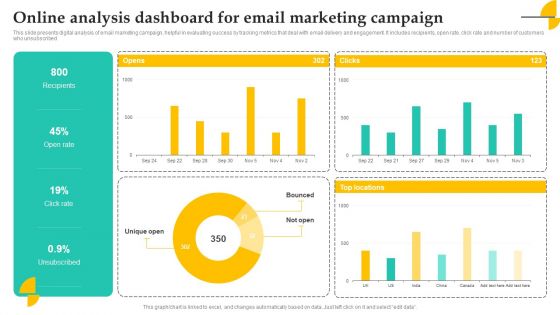
Online Analysis Dashboard For Email Marketing Campaign Elements PDF
This slide presents digital analysis of email marketing campaign, helpful in evaluating success by tracking metrics that deal with email delivery and engagement. It includes recipients, open rate, click rate and number of customers who unsubscribed Showcasing this set of slides titled Online Analysis Dashboard For Email Marketing Campaign Elements PDF. The topics addressed in these templates are Recipients, Open Rate, Campaign. All the content presented in this PPT design is completely editable. Download it and make adjustments in color, background, font etc. as per your unique business setting.

Competition Analysis Matrix Dashboard Comparison Ppt PowerPoint Presentation Complete Deck
This competition analysis matrix dashboard comparison ppt powerpoint presentation complete deck acts as backup support for your ideas, vision, thoughts, etc. Use it to present a thorough understanding of the topic. This PPT slideshow can be utilized for both in-house and outside presentations depending upon your needs and business demands. Entailing twelve slides with a consistent design and theme, this template will make a solid use case. As it is intuitively designed, it suits every business vertical and industry. All you have to do is make a few tweaks in the content or any other component to design unique presentations. The biggest advantage of this complete deck is that it can be personalized multiple times once downloaded. The color, design, shapes, and other elements are free to modify to add personal touches. You can also insert your logo design in this PPT layout. Therefore a well-thought and crafted presentation can be delivered with ease and precision by downloading this competition analysis matrix dashboard comparison ppt powerpoint presentation complete deck PPT slideshow.

Organizational Manpower Kpi Dashboard Employees Ppt PowerPoint Presentation Complete Deck
This organizational manpower kpi dashboard employees ppt powerpoint presentation complete deck acts as backup support for your ideas, vision, thoughts, etc. Use it to present a thorough understanding of the topic. This PPT slideshow can be utilized for both in-house and outside presentations depending upon your needs and business demands. Entailing twelve slides with a consistent design and theme, this template will make a solid use case. As it is intuitively designed, it suits every business vertical and industry. All you have to do is make a few tweaks in the content or any other component to design unique presentations. The biggest advantage of this complete deck is that it can be personalized multiple times once downloaded. The color, design, shapes, and other elements are free to modify to add personal touches. You can also insert your logo design in this PPT layout. Therefore a well-thought and crafted presentation can be delivered with ease and precision by downloading this organizational manpower kpi dashboard employees ppt powerpoint presentation complete deck PPT slideshow.

JIRA KPI Dashboard Ppt PowerPoint Presentation Complete Deck With Slides
This jira kpi dashboard ppt powerpoint presentation complete deck with slides acts as backup support for your ideas, vision, thoughts, etc. Use it to present a thorough understanding of the topic. This PPT slideshow can be utilized for both in-house and outside presentations depending upon your needs and business demands. Entailing sixteen slides with a consistent design and theme, this template will make a solid use case. As it is intuitively designed, it suits every business vertical and industry. All you have to do is make a few tweaks in the content or any other component to design unique presentations. The biggest advantage of this complete deck is that it can be personalized multiple times once downloaded. The color, design, shapes, and other elements are free to modify to add personal touches. You can also insert your logo design in this PPT layout. Therefore a well-thought and crafted presentation can be delivered with ease and precision by downloading this jira kpi dashboard ppt powerpoint presentation complete deck with slides PPT slideshow.


 Continue with Email

 Home
Home


