Benefits Icon
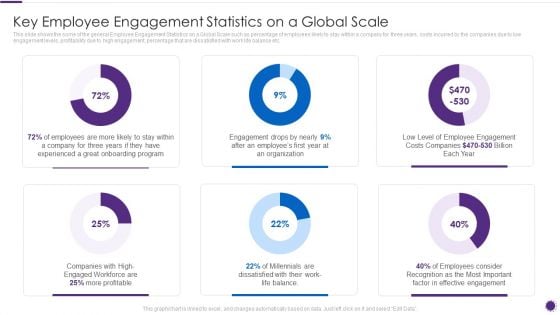
Complete Guide For Total Employee Involvement Strategic Approach Key Employee Engagement Topics PDF
This slide shows the some of the general Employee Engagement Statistics on a Global Scale such as percentage of employees likely to stay within a company for three years, costs incurred by the companies due to low engagement levels, profitability due to high engagement, percentage that are dissatisfied with work life balance etc. Deliver an awe inspiring pitch with this creative Complete Guide For Total Employee Involvement Strategic Approach Key Employee Engagement Topics PDF bundle. Topics like Engagement Drops, Employee Engagement, Employees Consider can be discussed with this completely editable template. It is available for immediate download depending on the needs and requirements of the user.
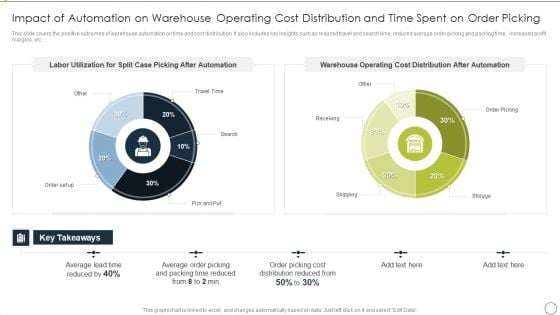
Automating Supply Chain Impact Of Automation On Warehouse Operating Cost Distribution And Time Microsoft PDF
This slide covers the positive outcomes of warehouse automation on time and cost distribution. It also includes key insights such as reduced travel and search time, reduced average order picking and packing time, increased profit margins, etc. Deliver an awe inspiring pitch with this creative Automating Supply Chain Impact Of Automation On Warehouse Operating Cost Distribution And Time Microsoft PDF bundle. Topics like Labor Utilization, Warehouse Operating, Cost Distribution can be discussed with this completely editable template. It is available for immediate download depending on the needs and requirements of the user.
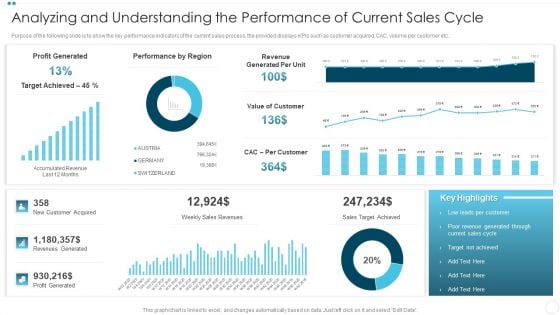
Analyzing And Understanding The Performance Of Current Sales Cycle Background PDF
Purpose of the following slide is to show the key performance indicators of the current sales process, the provided displays KPIs such as customer acquired, CAC, volume per customer etc.Deliver and pitch your topic in the best possible manner with this Analyzing And Understanding The Performance Of Current Sales Cycle Background PDF Use them to share invaluable insights on Profit Generated, Performance By Region, Customer Acquired and impress your audience. This template can be altered and modified as per your expectations. So, grab it now.
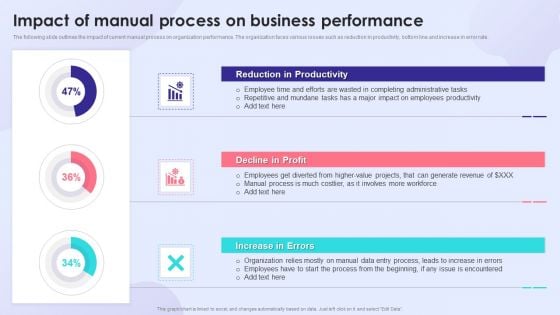
Impact Of Manual Process On Business Performance Summary PDF
The following slide outlines the impact of current manual process on organization performance. The organization faces various issues such as reduction in productivity, bottom line and increase in error rate. Deliver and pitch your topic in the best possible manner with this Impact Of Manual Process On Business Performance Summary PDF. Use them to share invaluable insights on Decline In Profit, Reduction In Productivity, Increase In Errors and impress your audience. This template can be altered and modified as per your expectations. So, grab it now.
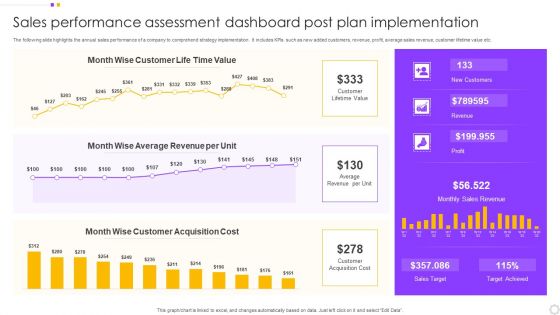
Sales Performance Assessment Dashboard Post Plan Implementation Introduction PDF
The following slide highlights the annual sales performance of a company to comprehend strategy implementation. It includes KPIs such as new added customers, revenue, profit, average sales revenue, customer lifetime value etc. Pitch your topic with ease and precision using this Sales Performance Assessment Dashboard Post Plan Implementation Introduction PDF. This layout presents information on Customer, Value, Average Revenue. It is also available for immediate download and adjustment. So, changes can be made in the color, design, graphics or any other component to create a unique layout.
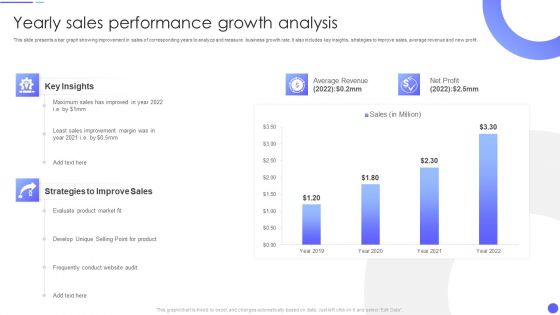
Yearly Sales Performance Growth Analysis Rules PDF
This slide presents a bar graph showing improvement in sales of corresponding years to analyze and measure business growth rate. It also includes key insights, strategies to improve sales, average revenue and new profit.Pitch your topic with ease and precision using this Yearly Sales Performance Growth Analysis Rules PDF This layout presents information on Average Revenue, Strategies To Improve, Sales Improvement It is also available for immediate download and adjustment. So, changes can be made in the color, design, graphics or any other component to create a unique layout.
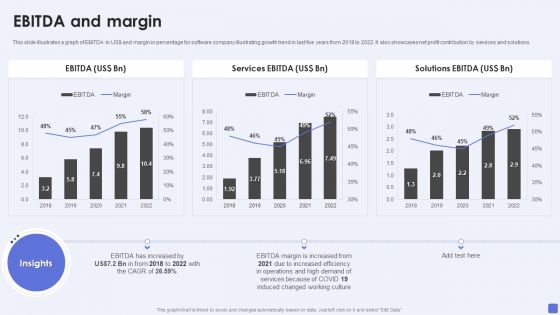
Software Services Business Profile EBITDA And Margin Ppt PowerPoint Presentation Gallery Slide Portrait PDF
This slide illustrates a graph of EBITDA in US dollar and margin in percentage for software company illustrating growth trend in last five years from 2018 to 2022. It also showcases net profit contribution by services and solutions. Deliver an awe inspiring pitch with this creative Software Services Business Profile EBITDA And Margin Ppt PowerPoint Presentation Gallery Slide Portrait PDF bundle. Topics like Services EB, Solutions EBITDA, EBITDA Margin can be discussed with this completely editable template. It is available for immediate download depending on the needs and requirements of the user.
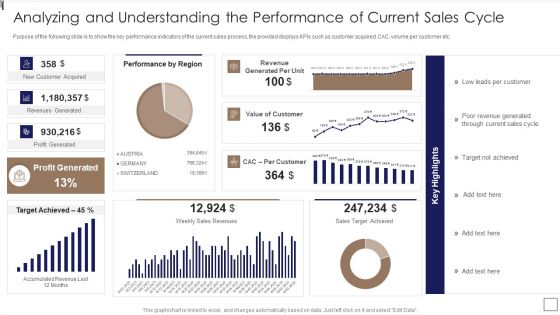
Sales Lead Qualification Procedure And Parameter Analyzing And Understanding Sample PDF
Purpose of the following slide is to show the key performance indicators of the current sales process, the provided displays KPIs such as customer acquired, CAC, volume per customer etc.Deliver and pitch your topic in the best possible manner with this Sales Lead Qualification Procedure And Parameter Analyzing And Understanding Sample PDF Use them to share invaluable insights on Performance By Region, Value Of Customer, Profit Generated and impress your audience. This template can be altered and modified as per your expectations. So, grab it now.
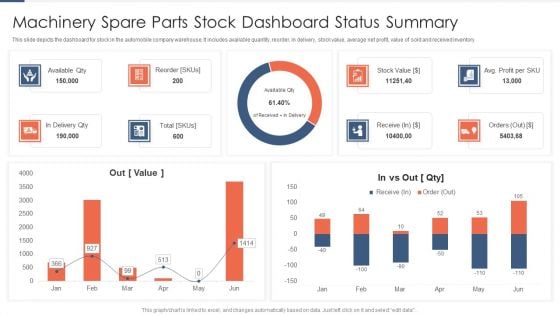
Machinery Spare Parts Stock Dashboard Status Summary Topics PDF
This slide depicts the dashboard for stock in the automobile company warehouse. It includes available quantity, reorder, in delivery, stock value, average net profit, value of sold and received inventory. Pitch your topic with ease and precision using this Machinery Spare Parts Stock Dashboard Status Summary Topics PDF. This layout presents information on Available Qty, Delivery Qty, Reorder. It is also available for immediate download and adjustment. So, changes can be made in the color, design, graphics or any other component to create a unique layout.
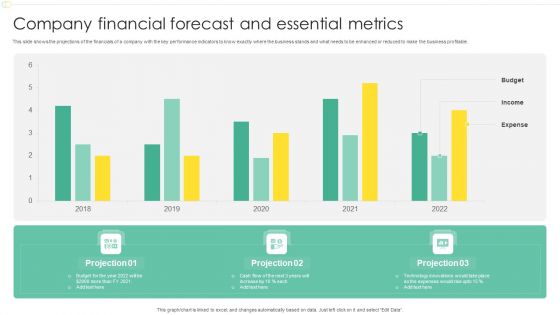
Company Financial Forecast And Essential Metrics Ppt Model Design Templates PDF
This slide shows the projections of the financials of a company with the key performance indicators to know exactly where the business stands and what needs to be enhanced or reduced to make the business profitable. Showcasing this set of slides titled Company Financial Forecast And Essential Metrics Ppt Model Design Templates PDF. The topics addressed in these templates are Budget, Income, Expense, 2018 To 2022. All the content presented in this PPT design is completely editable. Download it and make adjustments in color, background, font etc. as per your unique business setting.
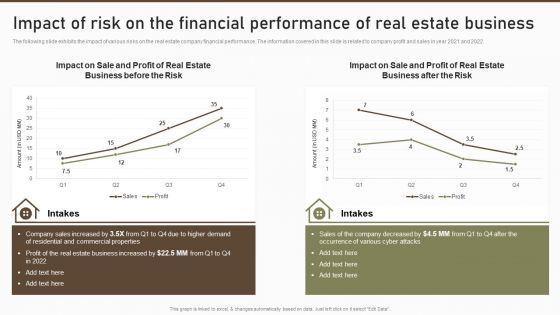
Impact Of Risk On The Financial Performance Of Real Estate Business Summary PDF
The following slide exhibits the impact of various risks on the real estate company financial performance. The information covered in this slide is related to company profit and sales in year 2021 and 2022. Deliver and pitch your topic in the best possible manner with this Impact Of Risk On The Financial Performance Of Real Estate Business Summary PDF. Use them to share invaluable insights on Commercial Properties, Estate Business, Real Estate and impress your audience. This template can be altered and modified as per your expectations. So, grab it now.
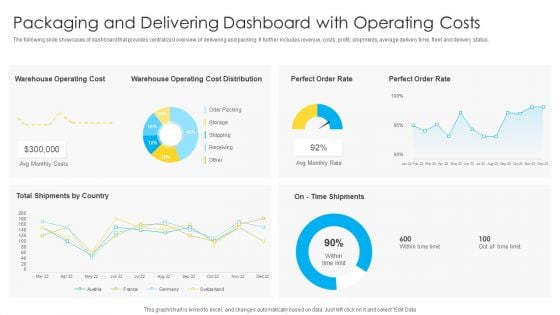
Packaging And Delivering Dashboard With Operating Costs Topics PDF
The following slide showcases of dashboard that provides centralized overview of delivering and packing. It further includes revenue, costs, profit, shipments, average delivery time, fleet and delivery status. Showcasing this set of slides titled Packaging And Delivering Dashboard With Operating Costs Topics PDF. The topics addressed in these templates are Warehouse Operating Cost, Perfect Order Rate, Avg Monthly Costs. All the content presented in this PPT design is completely editable. Download it and make adjustments in color, background, font etc. as per your unique business setting.
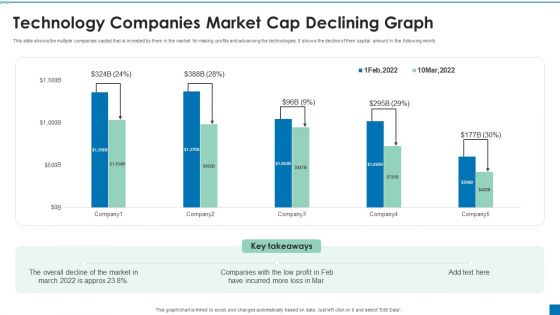
Technology Companies Market Cap Declining Graph Ppt PowerPoint Presentation File Smartart PDF
This slide shows the multiple companies capital that is invested by them in the market for making profits and advancing the technologies. It shows the decline of their capital amount in the following month. Pitch your topic with ease and precision using this Technology Companies Market Cap Declining Graph Ppt PowerPoint Presentation File Smartart PDF. This layout presents information on Overall Decline, Companies Low, Incurred Mor. It is also available for immediate download and adjustment. So, changes can be made in the color, design, graphics or any other component to create a unique layout.

Business Performance Review Dashboard To Measure Overall Business Performance Formats PDF
The following slide highlights a comprehensive quarterly business review QBR dashboard which can be used by the organization to evaluate business performance. The metrics used for review are total revenue, new customers, gross profit, overall costs, sales comparison, sales by different products and top performing channels. Showcasing this set of slides titled Business Performance Review Dashboard To Measure Overall Business Performance Formats PDF. The topics addressed in these templates are Sales Comparison, Sales Product, High Performing. All the content presented in this PPT design is completely editable. Download it and make adjustments in color, background, font etc. as per your unique business setting.
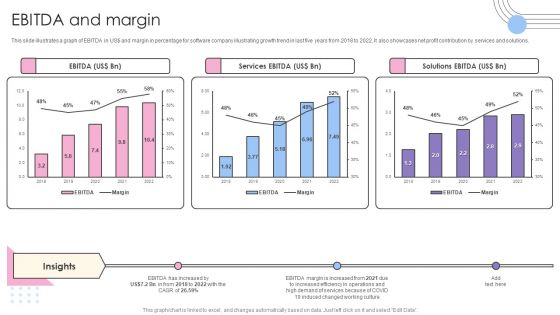
Software Products And Solutions Firm Details EBITDA And Margin Structure PDF
This slide illustrates a graph of EBITDA in US dollar and margin in percentage for software company illustrating growth trend in last five years from 2018 to 2022. It also showcases net profit contribution by services and solutions. Deliver an awe inspiring pitch with this creative Software Products And Solutions Firm Details EBITDA And Margin Structure PDF bundle. Topics like EBITDA, Services EBITDA, Solutions EBITDA, 2018 To 2022 can be discussed with this completely editable template. It is available for immediate download depending on the needs and requirements of the user.
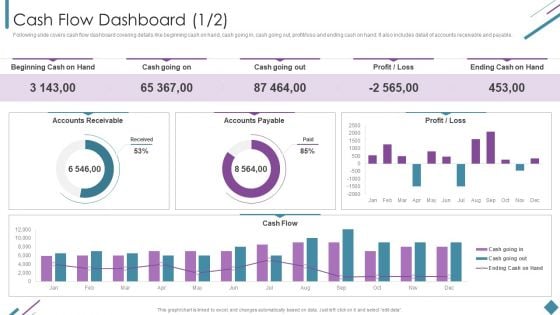
Metrics To Measure Business Performance Cash Flow Dashboard Rules PDF
Following slide covers cash flow dashboard covering details like beginning cash on hand, cash going in, cash going out, profit or loss and ending cash on hand. It also includes detail of accounts receivable and payable. Deliver an awe inspiring pitch with this creative Metrics To Measure Business Performance Cash Flow Dashboard Rules PDF bundle. Topics like Beginning Cash Hand, Cash Going Out, Accounts Payable, Accounts Receivable can be discussed with this completely editable template. It is available for immediate download depending on the needs and requirements of the user.
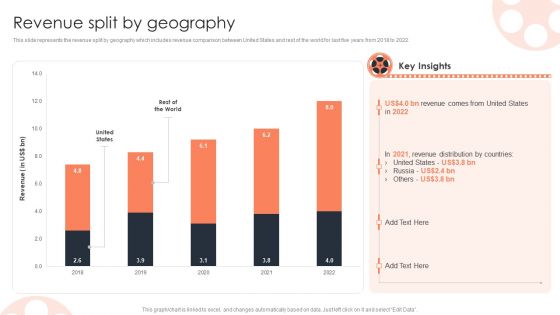
Revenue Split By Geography Film Media Company Profile Ppt PowerPoint Presentation Infographics Infographics PDF
This slide represents the financial highlights of our film production house which includes revenue and net profits for last five years from 2018 to 2022 that shows highest revenue in 2022.Deliver and pitch your topic in the best possible manner with this Revenue Split By Geography Film Media Company Profile Ppt PowerPoint Presentation Infographics Infographics PDF. Use them to share invaluable insights on United States, Revenue Distribution, Key Insights and impress your audience. This template can be altered and modified as per your expectations. So, grab it now.
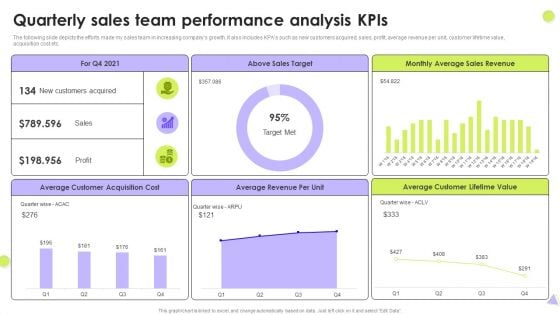
Quarterly Sales Team Performance Analysis Kpis Slides PDF
The following slide depicts the efforts made my sales team in increasing companys growth. It also includes KPAs such as new customers acquired, sales, profit, average revenue per unit, customer lifetime value, acquisition cost etc. Showcasing this set of slides titled Quarterly Sales Team Performance Analysis Kpis Slides PDF. The topics addressed in these templates are Above Sales Target, Average Sales Revenue, Average Customer. All the content presented in this PPT design is completely editable. Download it and make adjustments in color, background, font etc. as per your unique business setting.
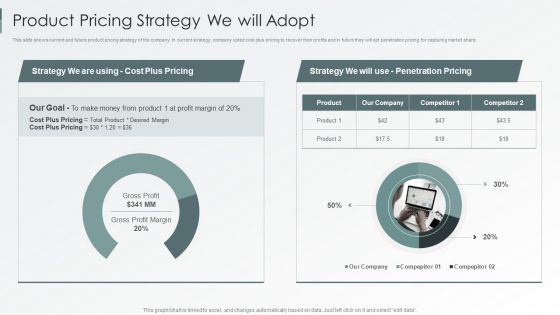
Enterprise Sustainability Performance Metrics Product Pricing Strategy We Will Adopt Brochure PDF
This slide shows current and future product pricing strategy of the company. In current strategy, company opted cost plus pricing to recover their profits and in future they will opt penetration pricing for capturing market share.Deliver and pitch your topic in the best possible manner with this Enterprise Sustainability Performance Metrics Product Pricing Strategy We Will Adopt Brochure PDF. Use them to share invaluable insights on Competitor, Desired Margin, Money Product and impress your audience. This template can be altered and modified as per your expectations. So, grab it now.
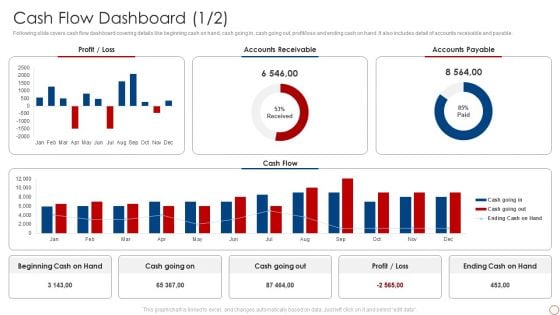
Kpis For Evaluating Business Sustainability Cash Flow Dashboard Background PDF
Following slide covers cash flow dashboard covering details like beginning cash on hand, cash going in, cash going out, profit or loss and ending cash on hand. It also includes detail of accounts receivable and payable. Deliver an awe inspiring pitch with this creative Kpis For Evaluating Business Sustainability Cash Flow Dashboard Background PDF bundle. Topics like Accounts Receivable, Accounts Payable, Cash Flow can be discussed with this completely editable template. It is available for immediate download depending on the needs and requirements of the user.
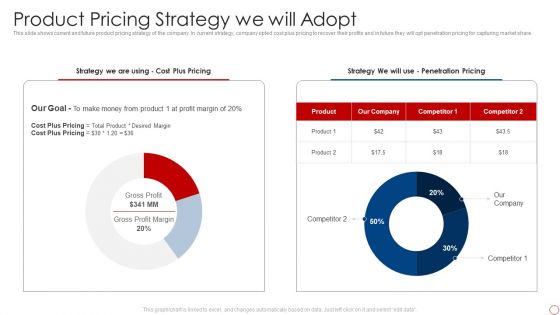
Kpis For Evaluating Business Sustainability Product Pricing Strategy We Will Adopt Slides PDF
This slide shows current and future product pricing strategy of the company. In current strategy, company opted cost plus pricing to recover their profits and in future they will opt penetration pricing for capturing market share. Deliver an awe inspiring pitch with this creative Kpis For Evaluating Business Sustainability Product Pricing Strategy We Will Adopt Slides PDF bundle. Topics like Strategy, Cost Plus Pricing, Penetration Pricing can be discussed with this completely editable template. It is available for immediate download depending on the needs and requirements of the user.
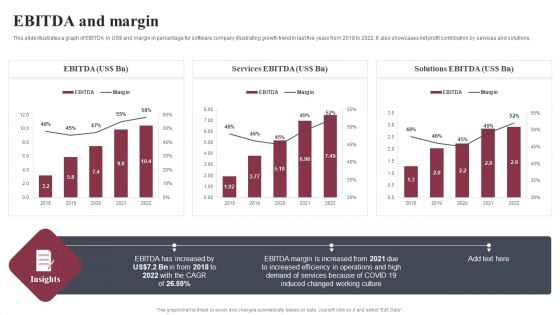
Business Software Development Company Profile EBITDA And Margin Summary PDF
This slide illustrates a graph of EBITDA in US dollar and margin in percentage for software company illustrating growth trend in last five years from 2018 to 2022. It also showcases net profit contribution by services and solutions. Deliver an awe inspiring pitch with this creative Business Software Development Company Profile EBITDA And Margin Summary PDF bundle. Topics like EBITDA, Services EBITDA, Solutions EBITDA can be discussed with this completely editable template. It is available for immediate download depending on the needs and requirements of the user.
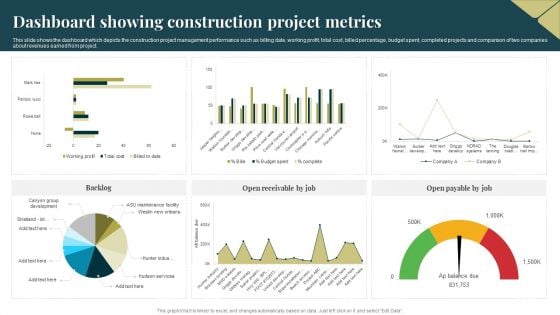
Dashboard Showing Construction Project Metrics Sample PDF
This slide shows the dashboard which depicts the construction project management performance such as billing date, working profit, total cost, billed percentage, budget spent, completed projects and comparison of two companies about revenues earned from project. Showcasing this set of slides titled Dashboard Showing Construction Project Metrics Sample PDF. The topics addressed in these templates are Dashboard, Construction Project Metrics. All the content presented in this PPT design is completely editable. Download it and make adjustments in color, background, font etc. as per your unique business setting.
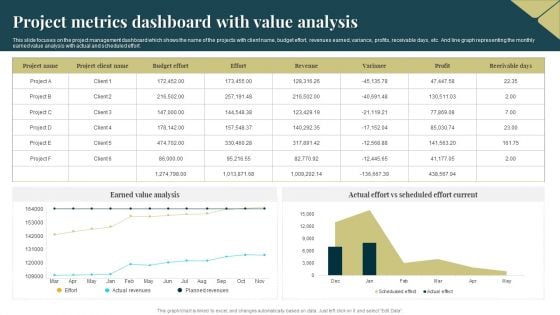
Project Metrics Dashboard With Value Analysis Introduction PDF
This slide focuses on the project management dashboard which shows the name of the projects with client name, budget effort, revenues earned, variance, profits, receivable days, etc. And line graph representing the monthly earned value analysis with actual and scheduled effort. Showcasing this set of slides titled Project Metrics Dashboard With Value Analysis Introduction PDF. The topics addressed in these templates are Budget Effort, Revenues, Earned Value Analysis. All the content presented in this PPT design is completely editable. Download it and make adjustments in color, background, font etc. as per your unique business setting.
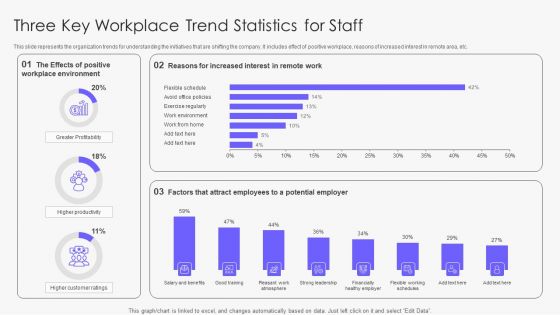
Three Key Workplace Trend Statistics For Staff Slides PDF
This slide represents the organization trends for understanding the initiatives that are shifting the company. It includes effect of positive workplace, reasons of increased interest in remote area, etc. Pitch your topic with ease and precision using this Three Key Workplace Trend Statistics For Staff Slides PDF. This layout presents information on Workplace Environment, Greater Profitability, Customer. It is also available for immediate download and adjustment. So, changes can be made in the color, design, graphics or any other component to create a unique layout.
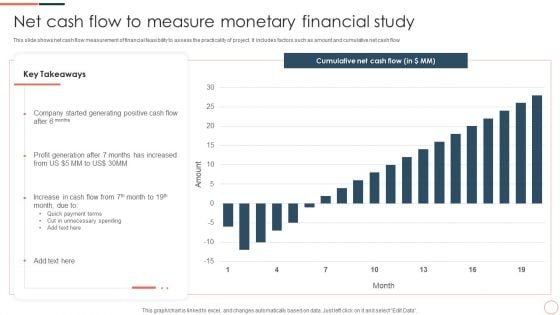
Net Cash Flow To Measure Monetary Financial Study Ppt Layouts Clipart Images PDF
This slide shows net cash flow measurement of financial feasibility to assess the practicality of project. It includes factors such as amount and cumulative net cash flow. Pitch your topic with ease and precision using this Net Cash Flow To Measure Monetary Financial Study Ppt Layouts Clipart Images PDF. This layout presents information on Cash Flow, Profit Generation, Quick Payment Terms. It is also available for immediate download and adjustment. So, changes can be made in the color, design, graphics or any other component to create a unique layout.

Brand Promotion Communication Strategy Dashboard For Analyzing Brand Perception Introduction PDF
This slide covers the dashboard for tracking brand reputation. It also includes metrics such as new customer lifetime value, customer acquisition cost, target met, above sales target, average weekly sales revenue, etc. Deliver an awe inspiring pitch with this creative Brand Promotion Communication Strategy Dashboard For Analyzing Brand Perception Introduction PDF bundle. Topics like New customer YTD, Sales revenue YTD, Profit YTD can be discussed with this completely editable template. It is available for immediate download depending on the needs and requirements of the user.
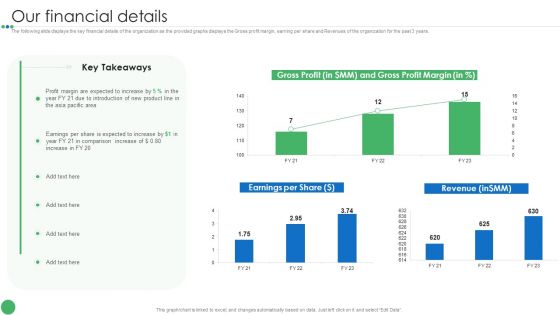
Our Financial Details Guide To Enhance Organic Growth By Advancing Business Procedures Demonstration PDF
The following slide displays the key financial details of the organization as the provided graphs displays the Gross profit margin, earning per share and Revenues of the organization for the past 3 years. Deliver and pitch your topic in the best possible manner with this Our Financial Details Guide To Enhance Organic Growth By Advancing Business Procedures Demonstration PDF. Use them to share invaluable insights on Key Activities, Value Propositions, Customer Relationships and impress your audience. This template can be altered and modified as per your expectations. So, grab it now.
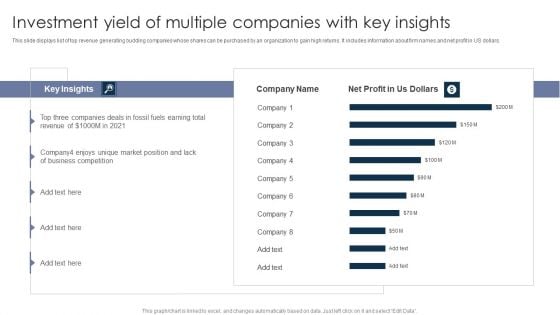
Investment Yield Of Multiple Companies With Key Insights Ppt PowerPoint Presentation Layouts Display
This slide displays list of top revenue generating budding companies whose shares can be purchased by an organization to gain high returns. It includes information about firm names and net profit in US dollars. Showcasing this set of slides titled Investment Yield Of Multiple Companies With Key Insights Ppt PowerPoint Presentation Layouts Display. The topics addressed in these templates are Three Companies, Business Competition, Fuels Earning. All the content presented in this PPT design is completely editable. Download it and make adjustments in color, background, font etc. as per your unique business setting.
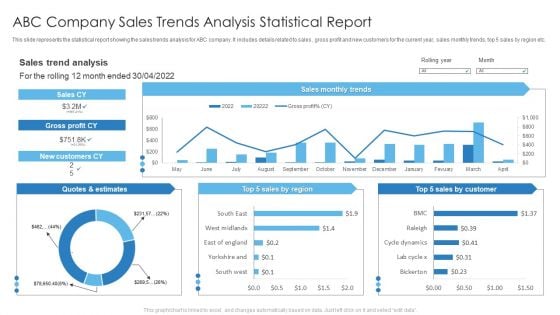
Abc Company Sales Trends Analysis Statistical Report Slides PDF
This slide represents the statistical report showing the sales trends analysis for ABC company. It includes details related to sales , gross profit and new customers for the current year, sales monthly trends, top 5 sales by region etc. Deliver an awe inspiring pitch with this creative Abc Company Sales Trends Analysis Statistical Report Slides PDF bundle. Topics like Abc Company Sales, Trends Analysis Statistical Report can be discussed with this completely editable template. It is available for immediate download depending on the needs and requirements of the user.
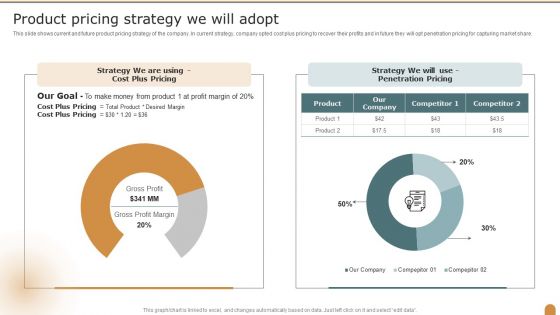
Product Pricing Strategy We Will Adopt Company Performance Evaluation Using KPI Slides PDF
This slide shows current and future product pricing strategy of the company. In current strategy, company opted cost plus pricing to recover their profits and in future they will opt penetration pricing for capturing market share. Deliver an awe inspiring pitch with this creative Product Pricing Strategy We Will Adopt Company Performance Evaluation Using KPI Slides PDF bundle. Topics like Strategy, Penetration Pricing, Our Company can be discussed with this completely editable template. It is available for immediate download depending on the needs and requirements of the user.
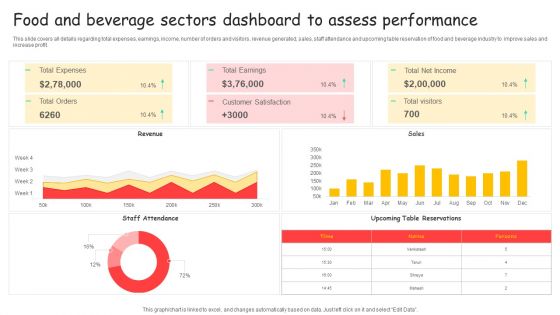
Food And Beverage Sectors Dashboard To Assess Performance Ppt Styles Elements PDF
This slide covers all details regarding total expenses, earnings, income, number of orders and visitors, revenue generated, sales, staff attendance and upcoming table reservation of food and beverage industry to improve sales and increase profit. Showcasing this set of slides titled Food And Beverage Sectors Dashboard To Assess Performance Ppt Styles Elements PDF. The topics addressed in these templates are Total Expenses, Total Earnings, Total Net Income. All the content presented in this PPT design is completely editable. Download it and make adjustments in color, background, font etc. as per your unique business setting.
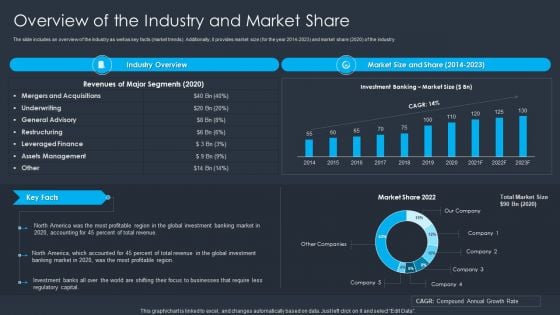
Merger And Acquisition Buying Strategy For Business Growth Overview Of The Industry And Market Share Template PDF
The slide includes an overview of the industry as well as key facts market trends. Additionally, it provides market size for the year 2014 to 2023 and market share 2020 of the industry. Deliver an awe inspiring pitch with this creative Merger And Acquisition Buying Strategy For Business Growth Overview Of The Industry And Market Share Template PDF bundle. Topics like Revenue, Investment Banking Market, Profitable can be discussed with this completely editable template. It is available for immediate download depending on the needs and requirements of the user.
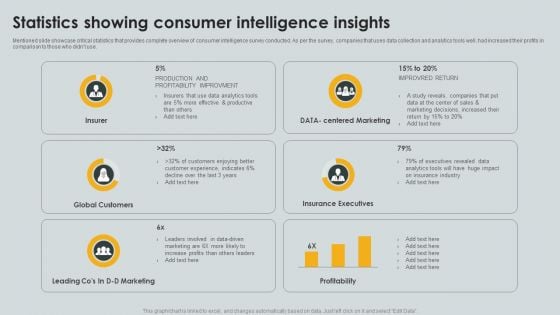
Statistics Showing Consumer Intelligence Insights Ppt PowerPoint Presentation Gallery Information PDF
Mentioned slide showcase critical statistics that provides complete overview of consumer intelligence survey conducted. As per the survey, companies that uses data collection and analytics tools well, had increased their profits in comparison to those who didnt use. Showcasing this set of slides titled Statistics Showing Consumer Intelligence Insights Ppt PowerPoint Presentation Gallery Information PDF. The topics addressed in these templates are Insurer, Global Customers, Insurance Executives. All the content presented in this PPT design is completely editable. Download it and make adjustments in color, background, font etc. as per your unique business setting.
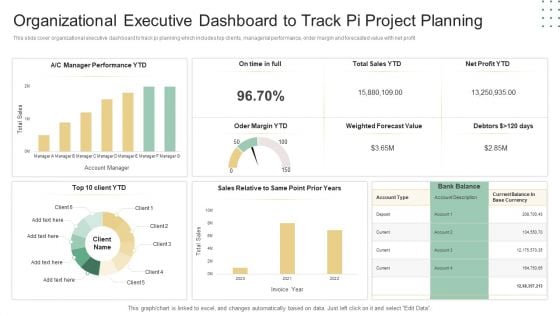
Organizational Executive Dashboard To Track Pi Project Planning Ppt Professional Background PDF
This slide cover organizational executive dashboard to track pi planning which includes top clients, managerial performance, order margin and forecasted value with net profit. Pitch your topic with ease and precision using this Organizational Executive Dashboard To Track Pi Project Planning Ppt Professional Background PDF. This layout presents information on Weighted Forecast Value, Top 10, Client YTD. It is also available for immediate download and adjustment. So, changes can be made in the color, design, graphics or any other component to create a unique layout.
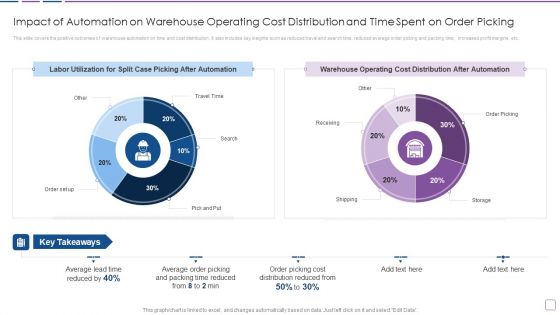
Warehouse Automation Deployment Impact Of Automation On Warehouse Operating Cost Topics PDF
This slide covers the positive outcomes of warehouse automation on time and cost distribution. It also includes key insights such as reduced travel and search time, reduced average order picking and packing time, increased profit margins, etc. Deliver an awe inspiring pitch with this creative Warehouse Automation Deployment Impact Of Automation On Warehouse Operating Cost Topics PDF bundle. Topics like Average Lead Time, Average Order Picking, Time Reduced can be discussed with this completely editable template. It is available for immediate download depending on the needs and requirements of the user.
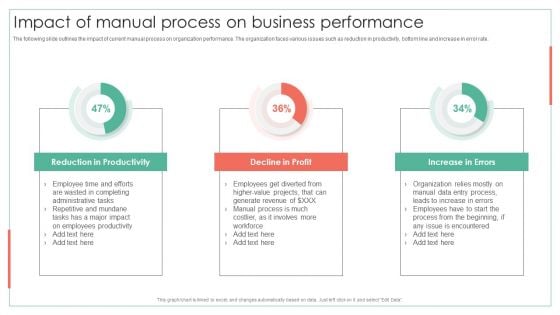
Impact Of Manual Process On Business Performance Achieving Operational Efficiency Guidelines PDF
The following slide outlines the impact of current manual process on organization performance. The organization faces various issues such as reduction in productivity, bottom line and increase in error rate.Deliver and pitch your topic in the best possible manner with this Impact Of Manual Process On Business Performance Achieving Operational Efficiency Guidelines PDF. Use them to share invaluable insights on Reduction Productivity, Increase Errors, Decline Profit and impress your audience. This template can be altered and modified as per your expectations. So, grab it now.
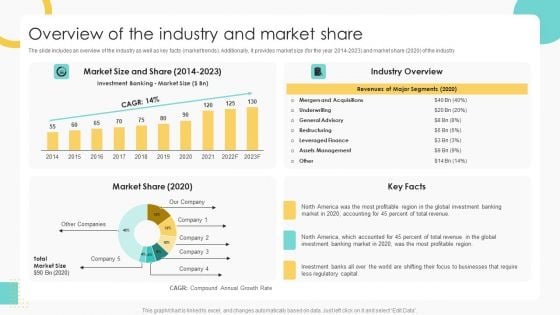
Buy Side Merger And Acquisition Pitch Book Overview Of The Industry And Market Share Graphics PDF
The slide includes an overview of the industry as well as key facts market trends. Additionally, it provides market size for the year 2014 to 2023 and market share 2020 of the industry. Deliver an awe inspiring pitch with this creative Buy Side Merger And Acquisition Pitch Book Overview Of The Industry And Market Share Graphics PDF bundle. Topics like Market Share, Industry Overview, Profitable can be discussed with this completely editable template. It is available for immediate download depending on the needs and requirements of the user.
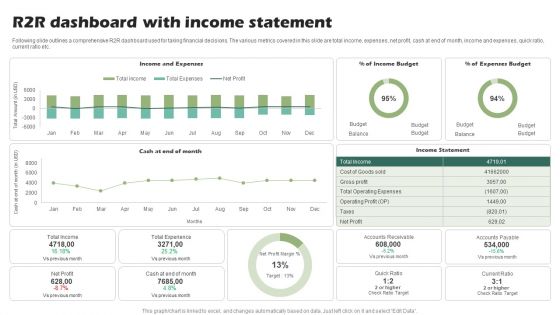
R2R Dashboard With Income Statement Ppt PowerPoint Presentation Show Slide Download PDF
Following slide outlines a comprehensive R2R dashboard used for taking financial decisions. The various metrics covered in this slide are total income, expenses, net profit, cash at end of month, income and expenses, quick ratio, current ratio etc.Showcasing this set of slides titled R2R Dashboard With Income Statement Ppt PowerPoint Presentation Show Slide Download PDF. The topics addressed in these templates are Operating Expenses, Total Experience, Accounts Receivable. All the content presented in this PPT design is completely editable. Download it and make adjustments in color, background, font etc. as per your unique business setting.
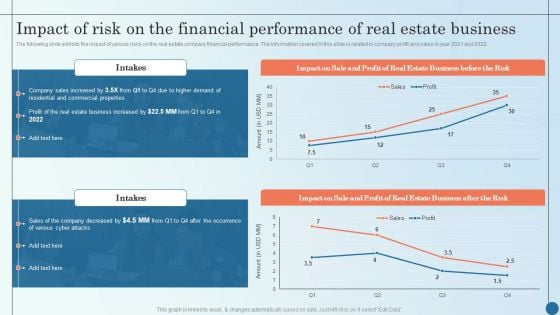
Impact Of Risk On The Financial Performance Of Real Managing Commercial Property Risks Sample PDF
The following slide exhibits the impact of various risks on the real estate company financial performance. The information covered in this slide is related to company profit and sales in year 2021 and 2022. Deliver and pitch your topic in the best possible manner with this Impact Of Risk On The Financial Performance Of Real Managing Commercial Property Risks Sample PDF. Use them to share invaluable insights on Estate Business, Business Increased, Company Decreased and impress your audience. This template can be altered and modified as per your expectations. So, grab it now.
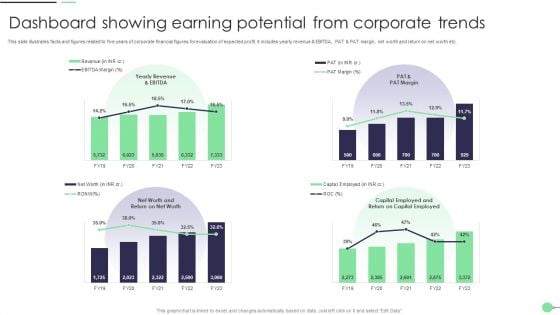
Dashboard Showing Earning Potential From Corporate Trends Demonstration PDF
This slide illustrates facts and figures related to five years of corporate financial figures for evaluation of expected profit. It includes yearly revenue and EBITDA, PAT and PAT margin, net worth and return on net worth etc. Showcasing this set of slides titled Dashboard Showing Earning Potential From Corporate Trends Demonstration PDF. The topics addressed in these templates are Potential From Corporate Trends, Dashboard Showing Earning. All the content presented in this PPT design is completely editable. Download it and make adjustments in color, background, font etc. as per your unique business setting.
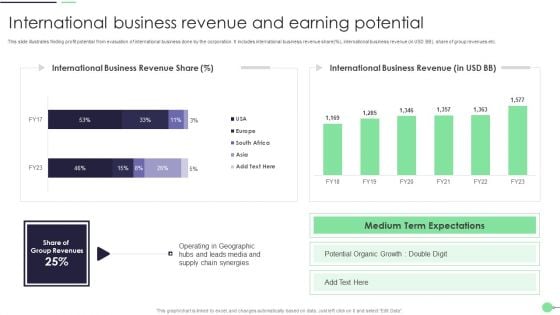
International Business Revenue And Earning Potential Guidelines PDF
This slide illustrates finding profit potential from evaluation of international business done by the corporation. It includes international business revenue share percent, international business revenue in USD BB, share of group revenues etc. Pitch your topic with ease and precision using this International Business Revenue And Earning Potential Guidelines PDF. This layout presents information on Potential Organic Growth, Supply Chain. It is also available for immediate download and adjustment. So, changes can be made in the color, design, graphics or any other component to create a unique layout.
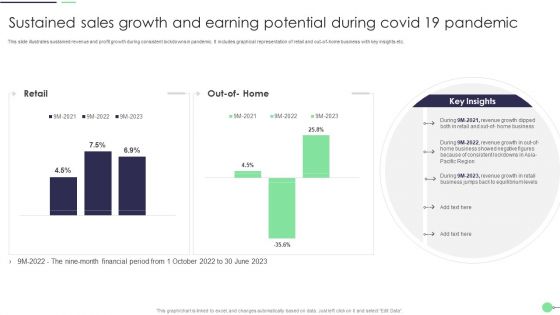
Sustained Sales Growth And Earning Potential During Covid 19 Pandemic Demonstration PDF
This slide illustrates sustained revenue and profit growth during consistent lockdowns in pandemic. It includes graphical representation of retail and out of home business with key insights etc. Pitch your topic with ease and precision using this Sustained Sales Growth And Earning Potential During Covid 19 Pandemic Demonstration PDF. This layout presents information on Revenue Growth, Business, Retail. It is also available for immediate download and adjustment. So, changes can be made in the color, design, graphics or any other component to create a unique layout.
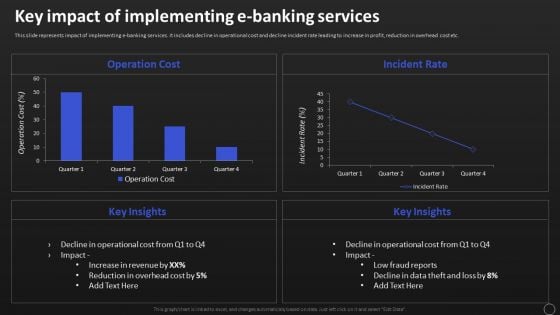
Net Banking Channel And Service Management Key Impact Of Implementing E Banking Services Clipart PDF
This slide represents impact of implementing e banking services. It includes decline in operational cost and decline incident rate leading to increase in profit, reduction in overhead cost etc. Find a pre designed and impeccable Net Banking Channel And Service Management Key Impact Of Implementing E Banking Services Clipart PDF. The templates can ace your presentation without additional effort. You can download these easy to edit presentation templates to make your presentation stand out from others. So, what are you waiting for Download the template from Slidegeeks today and give a unique touch to your presentation.
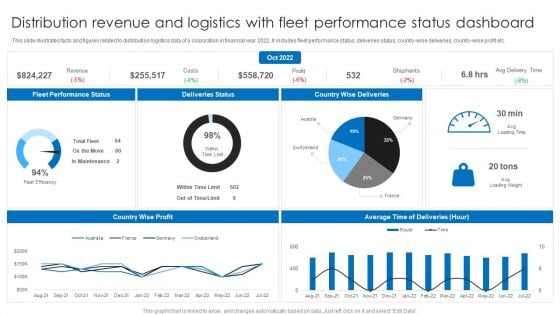
Distribution Revenue And Logistics With Fleet Performance Status Dashboard Ppt Layouts Background PDF
This slide illustrates facts and figures related to distribution logistics data of a corporation in financial year 2022. It includes fleet performance status, deliveries status, country-wise deliveries, country-wise profit etc. Pitch your topic with ease and precision using this Distribution Revenue And Logistics With Fleet Performance Status Dashboard Ppt Layouts Background PDF. This layout presents information on Deliveries Status, Country Wise Deliveries, Fleet Performance Status. It is also available for immediate download and adjustment. So, changes can be made in the color, design, graphics or any other component to create a unique layout.
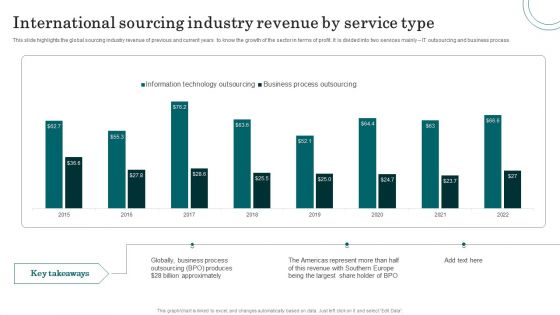
International Sourcing Industry Revenue By Service Type Mockup PDF
This slide highlights the global sourcing industry revenue of previous and current years to know the growth of the sector in terms of profit. It is divided into two services mainly IT outsourcing and business process. Pitch your topic with ease and precision using this International Sourcing Industry Revenue By Service Type Mockup PDF. This layout presents information on Business Process, Revenue, Share Holder. It is also available for immediate download and adjustment. So, changes can be made in the color, design, graphics or any other component to create a unique layout.
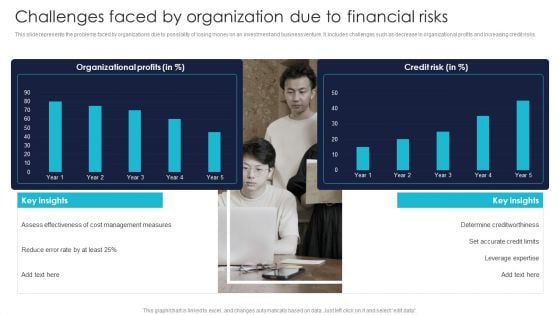
Challenges Faced By Organization Due To Financial Risks Pictures PDF
This slide represents the problems faced by organizations due to possibility of losing money on an investment and business venture. It includes challenges such as decrease in organizational profits and increasing credit risks. Boost your pitch with our creative Challenges Faced By Organization Due To Financial Risks Pictures PDF. Deliver an awe inspiring pitch that will mesmerize everyone. Using these presentation templates you will surely catch everyones attention. You can browse the ppts collection on our website. We have researchers who are experts at creating the right content for the templates. So you do not have to invest time in any additional work. Just grab the template now and use them.
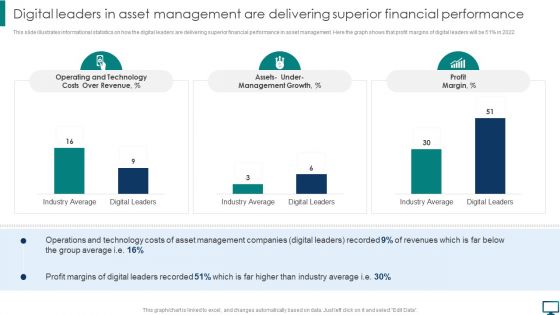
Digital Leaders In Asset Management Are Delivering Superior Financial Performance Topics PDF
This slide illustrates informational statistics on how the digital leaders are delivering superior financial performance in asset management. Here the graph shows that profit margins of digital leaders will be 51 percent in 2022. Take your projects to the next level with our ultimate collection of Digital Leaders In Asset Management Are Delivering Superior Financial Performance Topics PDF. Slidegeeks has designed a range of layouts that are perfect for representing task or activity duration, keeping track of all your deadlines at a glance. Tailor these designs to your exact needs and give them a truly corporate look with your own brand colors they will make your projects stand out from the rest.
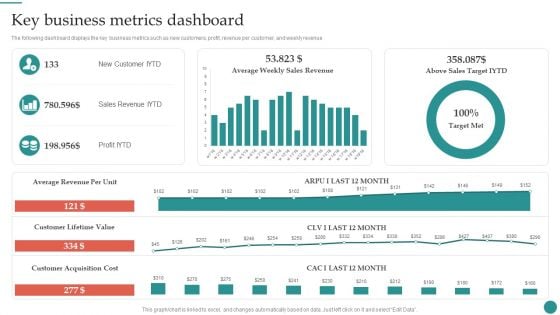
Key Business Metrics Dashboard Company Process Administration And Optimization Playbook Infographics PDF
The following dashboard displays the key business metrics such as new customers, profit, revenue per customer, and weekly revenue. Slidegeeks is here to make your presentations a breeze with Key Business Metrics Dashboard Company Process Administration And Optimization Playbook Infographics PDF With our easy-to-use and customizable templates, you can focus on delivering your ideas rather than worrying about formatting. With a variety of designs to choose from, you are sure to find one that suits your needs. And with animations and unique photos, illustrations, and fonts, you can make your presentation pop. So whether you are giving a sales pitch or presenting to the board, make sure to check out Slidegeeks first.
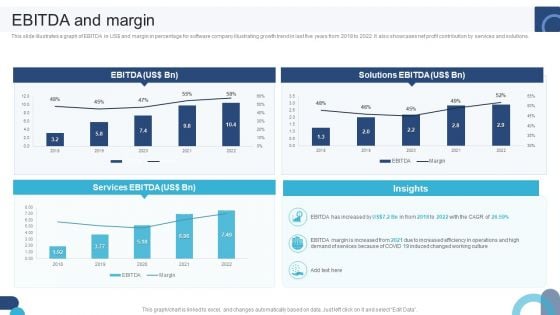
Digital Application Software Development Business Profile EBITDA And Margin Guidelines PDF
This slide illustrates a graph of EBITDA in US dollar and margin in percentage for software company illustrating growth trend in last five years from 2018 to 2022. It also showcases net profit contribution by services and solutions. If your project calls for a presentation, then Slidegeeks is your go-to partner because we have professionally designed, easy-to-edit templates that are perfect for any presentation. After downloading, you can easily edit Digital Application Software Development Business Profile EBITDA And Margin Guidelines PDF and make the changes accordingly. You can rearrange slides or fill them with different images. Check out all the handy templates
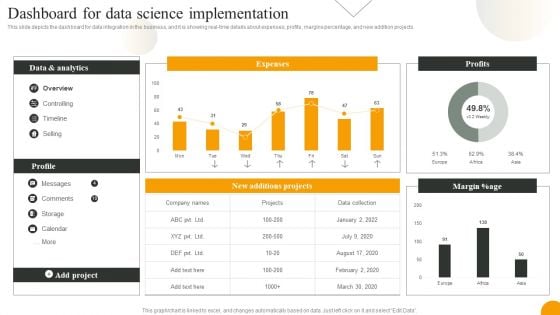
Using Data Science Technologies For Business Transformation Dashboard For Data Science Implementation Portrait PDF
This slide depicts the dashboard for data integration in the business, and it is showing real-time details about expenses, profits, margins percentage, and new addition projects. Take your projects to the next level with our ultimate collection of Using Data Science Technologies For Business Transformation Dashboard For Data Science Implementation Portrait PDF. Slidegeeks has designed a range of layouts that are perfect for representing task or activity duration, keeping track of all your deadlines at a glance. Tailor these designs to your exact needs and give them a truly corporate look with your own brand colors they will make your projects stand out from the rest.

Deploying House Flipping Business Plan Executive Summary For House Flipping Business Formats PDF
This slide represents overview for the house flipping company for building the business plan. It covers business vision, mission, key products and services and 3 year profit forecast for the company. Take your projects to the next level with our ultimate collection of Deploying House Flipping Business Plan Executive Summary For House Flipping Business Formats PDF. Slidegeeks has designed a range of layouts that are perfect for representing task or activity duration, keeping track of all your deadlines at a glance. Tailor these designs to your exact needs and give them a truly corporate look with your own brand colors they will make your projects stand out from the rest.
Corporate Financial Performance Tracking Dashboard Ppt PowerPoint Presentation File Pictures PDF
This slide provides information regarding dashboard utilized by firm to monitor financial performance. The performance is tracked through revenues generated, vendors associated, profit generated, etc. Find a pre designed and impeccable Corporate Financial Performance Tracking Dashboard Ppt PowerPoint Presentation File Pictures PDF. The templates can ace your presentation without additional effort. You can download these easy to edit presentation templates to make your presentation stand out from others. So, what are you waiting for Download the template from Slidegeeks today and give a unique touch to your presentation.

Strategies To Select Effective Impact On Companys Revenues Formats PDF
This template covers the impact of choosing the right price optimization strategy for our company which increases companys sales and profits. The Strategies To Select Effective Impact On Companys Revenues Formats PDF is a compilation of the most recent design trends as a series of slides. It is suitable for any subject or industry presentation, containing attractive visuals and photo spots for businesses to clearly express their messages. This template contains a variety of slides for the user to input data, such as structures to contrast two elements, bullet points, and slides for written information. Slidegeeks is prepared to create an impression.
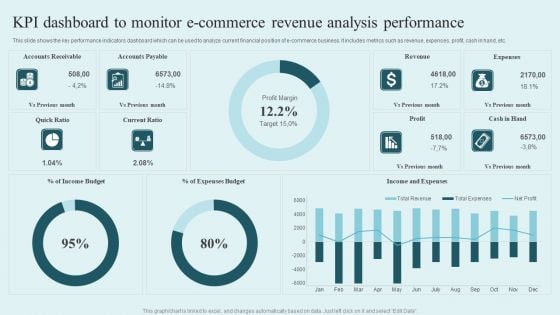
KPI Dashboard To Monitor E Commerce Revenue Analysis Performance Mockup PDF
This slide shows the key performance indicators dashboard which can be used to analyze current financial position of e-commerce business. It includes metrics such as revenue, expenses, profit, cash in hand, etc. Showcasing this set of slides titled KPI Dashboard To Monitor E Commerce Revenue Analysis Performance Mockup PDF. The topics addressed in these templates are Accounts Receivable, Accounts Payable, Revenue, Expenses. All the content presented in this PPT design is completely editable. Download it and make adjustments in color, background, font etc. as per your unique business setting.
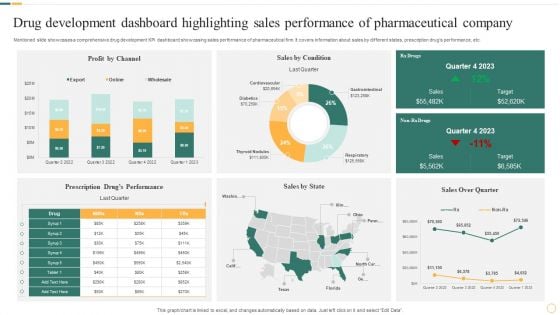
Drug Development Dashboard Highlighting Sales Performance Of Pharmaceutical Company Microsoft PDF
Mentioned slide showcases a comprehensive drug development KPI dashboard showcasing sales performance of pharmaceutical firm. It covers information about sales by different states, prescription drugs performance, etc. Pitch your topic with ease and precision using this Drug Development Dashboard Highlighting Sales Performance Of Pharmaceutical Company Microsoft PDF. This layout presents information on Sales By Condition, Profit By Channel, Sales By State. It is also available for immediate download and adjustment. So, changes can be made in the color, design, graphics or any other component to create a unique layout.
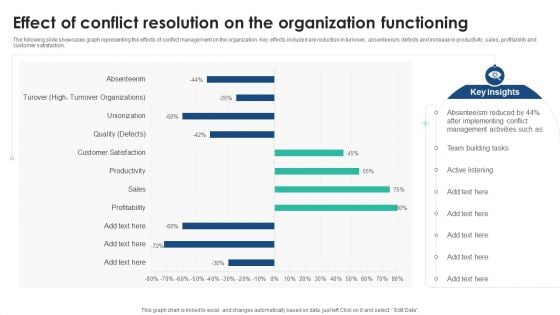
Effect Of Conflict Resolution On The Organization Functioning Pictures PDF
The following slide showcases graph representing the effects of conflict management on the organization. Key effects included are reduction in turnover, absenteeism, defects and increase in productivity, sales, profitability and customer satisfaction. Showcasing this set of slides titled Effect Of Conflict Resolution On The Organization Functioning Topics PDF. The topics addressed in these templates areEffect Of Conflict Resolution On The Organization Functioning Pictures PDF. All the content presented in this PPT design is completely editable. Download it and make adjustments in color, background, font etc. as per your unique business setting.
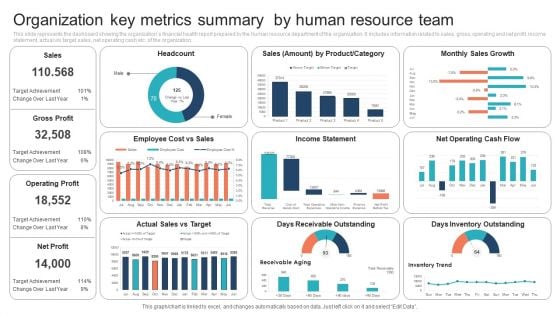
Organization Key Metrics Summary By Human Resource Team Information PDF
This slide represents the dashboard showing the organizations financial health report prepared by the human resource department of the organization. It includes information related to sales, gross, operating and net profit, income statement, actual vs target sales, net operating cash etc. of the organization.Showcasing this set of slides titled Organization Key Metrics Summary By Human Resource Team Information PDF. The topics addressed in these templates are Organization Key Metrics Summary, Human Resource Team. All the content presented in this PPT design is completely editable. Download it and make adjustments in color, background, font etc. as per your unique business setting.
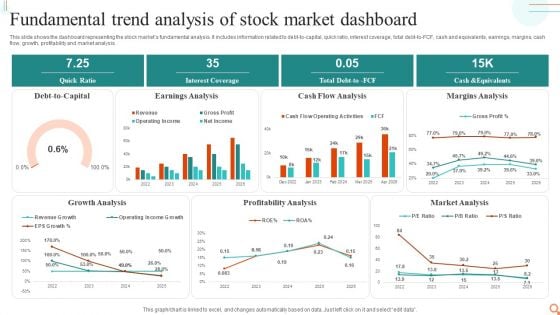
Fundamental Trend Analysis Of Stock Market Dashboard Professional PDF
This slide shows the dashboard representing the stock markets fundamental analysis. It includes information related to debt-to-capital, quick ratio, interest coverage, total debt-to-FCF, cash and equivalents, earnings, margins, cash flow, growth, profitability and market analysis.Showcasing this set of slides titled Fundamental Trend Analysis Of Stock Market Dashboard Professional PDF. The topics addressed in these templates are Earnings Analysis, Cash Flow Analysis, Margins Analysis. All the content presented in this PPT design is completely editable. Download it and make adjustments in color, background, font etc. as per your unique business setting.
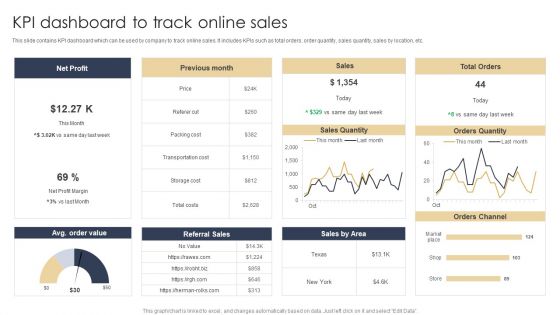
KPI Dashboard To Track Online Sales Structure PDF
This slide contains KPI dashboard which can be used by company to track online sales. It includes KPIs such as total orders, order quantity, sales quantity, sales by location, etc. Pitch your topic with ease and precision using this KPI Dashboard To Track Online Sales Structure PDF. This layout presents information on Net Profit, Sales, Orders Quantity. It is also available for immediate download and adjustment. So, changes can be made in the color, design, graphics or any other component to create a unique layout.


 Continue with Email

 Home
Home


