Benefits Of Coaching

Business Graph Finance PowerPoint Presentation Slides Cc
Microsoft Powerpoint Slides and Backgrounds with graph with arrow showing profits and gains Your thoughts and our Business Graph Finance PowerPoint Presentation Slides Cc will get along famously. They will create an acclaimed team.
Business Graph Finance PowerPoint Presentation Slides F
Microsoft Powerpoint Slides and Backgrounds with graph with arrow showing profits and gains Our Business Graph Finance PowerPoint Presentation Slides F are maintenance free. All they require is a dash of your thoughts.

Business Graph Finance PowerPoint Presentation Slides R
Microsoft Powerpoint Slides and Backgrounds with graph with arrow showing profits and gains Improve the apprearance of your slides with our Business Graph Finance PowerPoint Presentation Slides R. Dont waste time struggling with PowerPoint. Let us do it for you.
Business Graph Finance PowerPoint Presentation Slides S
Microsoft Powerpoint Slides and Backgrounds with graph with arrow showing profits and gains Create a business with our Business Graph Finance PowerPoint Presentation Slides S. Just download, type and present.

Business Planning Strategy 3d Man Stops With Hands Basic Concepts
Rake In The Dough With Your Ideas. Profits Will Rise With Our Business Planning Strategy 3d Man Stops With Hands Basic Concepts Powerpoint Templates. Dowse The Flames With Our People Powerpoint Templates. Put Out The Fire Before It Starts.

Business Strategy Examples 3d Man Saving Money Piggy Bank Character Modeling
Rake In The Dough With Your Ideas. Profits Will Rise With Our Business Strategy Examples 3d Man Saving Money Piggy Bank Character Modeling Powerpoint Templates. Dowse The Flames With Our Money Powerpoint Templates. Put Out The Fire Before It Starts.
Stock Photo Business Strategy Execution Illustration Of Car With Globe
Rake In The Dough With Your Ideas. Profits Will Rise With Our Stock Photo Business Strategy Execution Illustration Of Car With Globe Powerpoint Templates. Dowse The Flames With Our Globe Powerpoint Templates. Put Out The Fire Before It Starts.

Stock Photo Business Strategy Consulting Follow The Path Of Goal Clipart
Rake In The Dough With Your Ideas. Profits Will Rise With Our Stock Photo Business Strategy Consulting Follow The Path Of Goal Clipart Powerpoint Templates. Dowse The Flames With Our people Powerpoint Templates. Put Out The Fire Before It Starts.
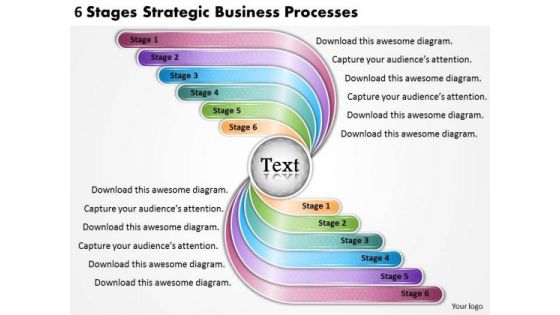
Timeline PowerPoint Template 6 Stages Strategic Business Processes
Rake In The Dough With Your Ideas. Profits Will Rise With Our Timeline 6 Stages Strategic Business Processes Powerpoint Templates. Dowse The Flames With Our Leadership Powerpoint Templates. Put Out The Fire Before It Starts.
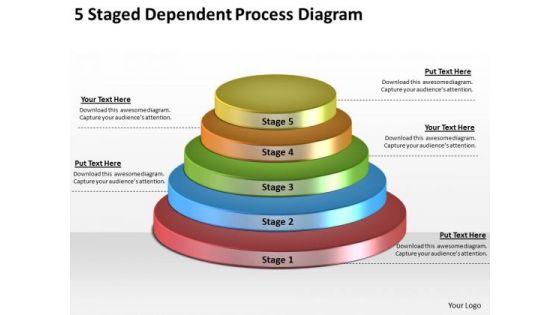
Timeline Ppt Template 5 Staged Dependent Process Diagram
Rake In The Dough With Your Ideas. Profits Will Rise With Our Timeline Ppt Template 5 Staged Dependent Process Diagram Powerpoint Templates. Dowse The Flames With Our Business Powerpoint Templates. Put Out The Fire Before It Starts.

Stock Photo Dollar Symbol Bar Graph With Cubes PowerPoint Slide
This image slide contains bar graph of cubes with dollar symbol. This image is designed with dollar growth graph. Use this slide to display growth of profit in business presentations. Make an impressive presentation by using this image.
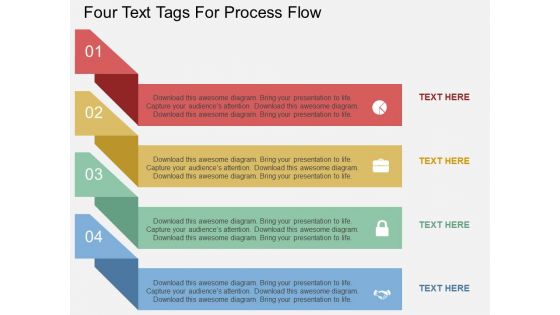
Four Text Tags For Process Flow Powerpoint Template
This PPT slide contains four text tags with business icons. This PPT diagram is suitable to present concept of profit growth value analysis. Enlighten others on the process with this innovative PowerPoint template.
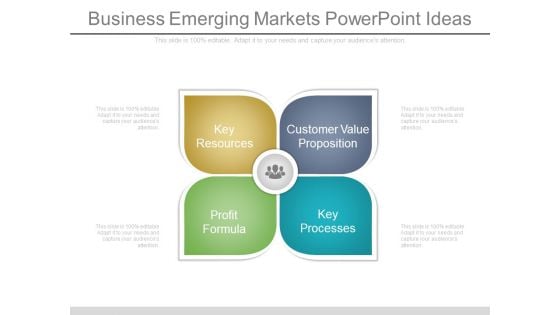
Business Emerging Markets Powerpoint Ideas
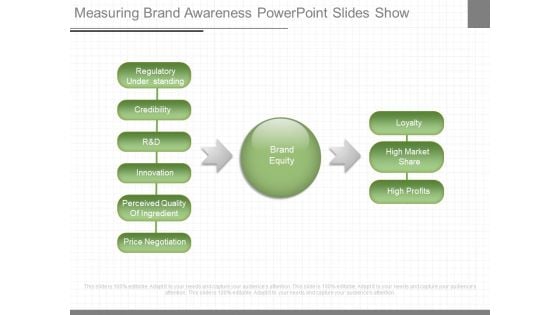
Measuring Brand Awareness Powerpoint Slides Show
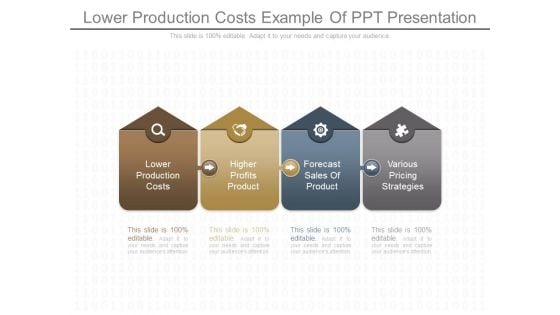
Lower Production Costs Example Of Ppt Presentation
This is a lower production costs example of ppt presentation. This is a four stage process. The stages in this process are lower production costs, higher profits product, forecast sales of product, various pricing strategies.
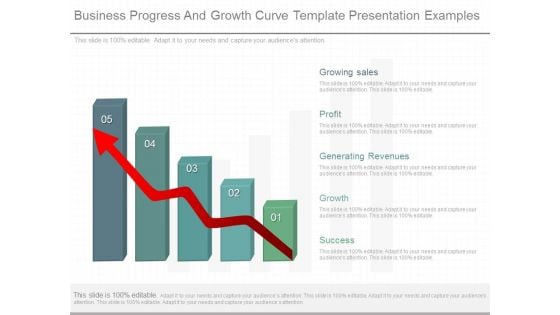
Business Progress And Growth Curve Template Presentation Examples
This is a business progress and growth curve template presentation examples. This is a five stage process. The stages in this process are growing sales, profit, generating revenues, growth, success.
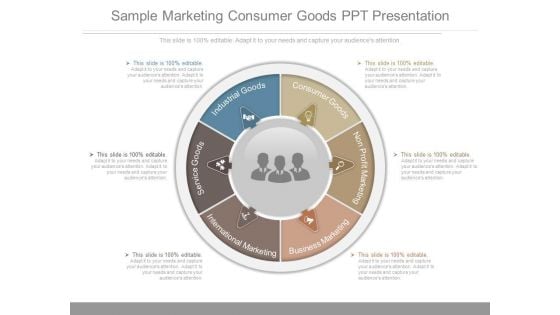
Sample Marketing Consumer Goods Ppt Presentation
This is a sample marketing consumer goods ppt presentation. This is a six stage process. The stages in this process are industrial goods, service goods, international marketing, business marketing, non profit marketing, consumer goods.

Offshore Outsourcing Powerpoint Presentation Examples
This is a offshore outsourcing powerpoint presentation examples. This is a five stage process. The stages in this process are dedicated team, smart work environment, quality performance, growth and profitability, reduced time to market.
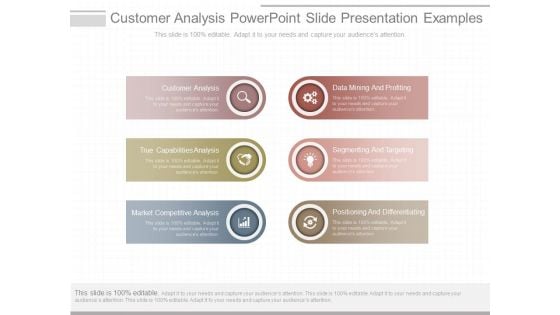
Customer Analysis Powerpoint Slide Presentation Examples
This is a customer analysis powerpoint slide presentation examples. This is a six stage process. The stages in this process are customer analysis, true capabilities analysis, market competitive analysis, data mining and profiting, segmenting and targeting, positioning and differentiating.
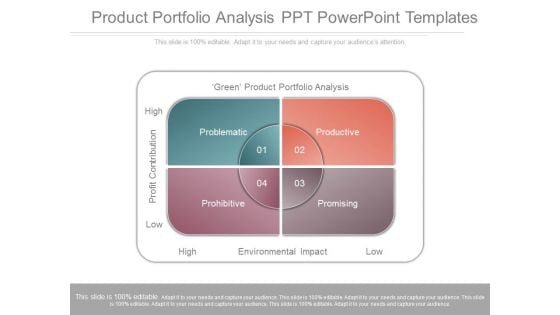
Product Portfolio Analysis Ppt Powerpoint Templates
This is a product portfolio analysis ppt powerpoint templates. This is a four stage process. The stages in this process are green product portfolio analysis, profit contribution, low, high, problematic, productive, prohibitive, promising, environmental impact.
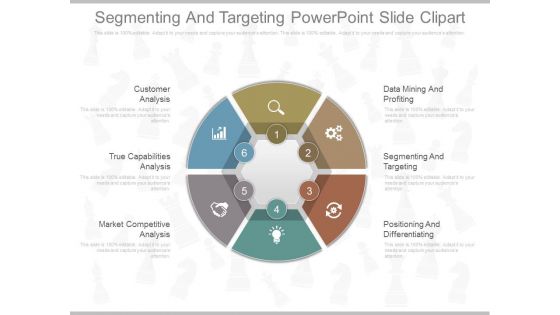
Segmenting And Targeting Powerpoint Slide Clipart
This is a segmenting and targeting powerpoint slide clipart. This is a six stage process. The stages in this process are data mining and profiting, segmenting and targeting, positioning and differentiating, market competitive analysis, true capabilities analysis, customer analysis.
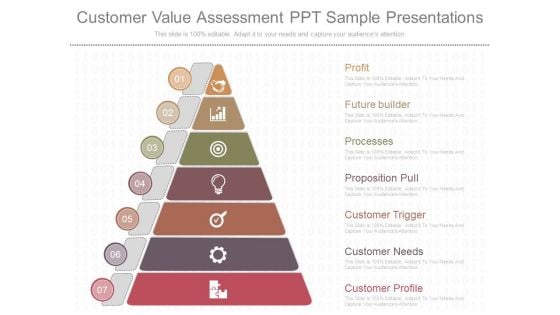
Customer Value Assessment Ppt Sample Presentations
This is a customer value assessment ppt sample presentations. This is a seven stage process. The stages in this process are customer profile, customer needs, customer trigger, proposition pull, processes, future builder, profit.
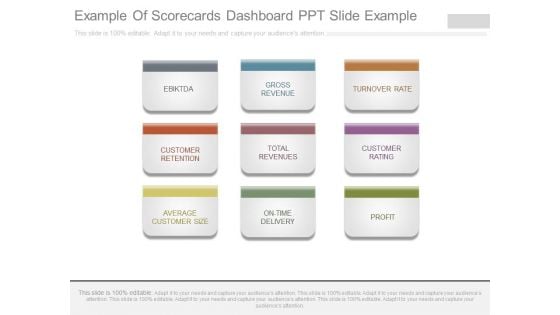
Example Of Scorecards Dashboard Ppt Slide Example
This is a example of scorecards dashboard ppt slide example. This is a nine stage process. The stages in this process are ebiktda, gross revenue, turnover rate, customer retention, total revenues, customer rating, average customer size, on time delivery, profit.
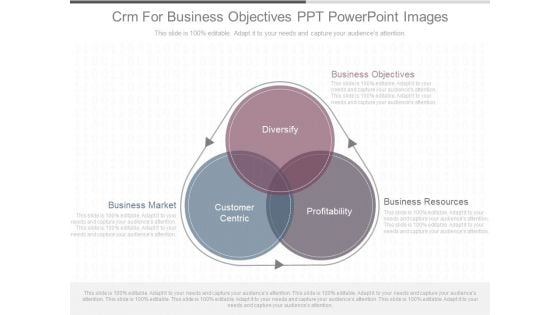
Crm For Business Objectives Ppt Powerpoint Images
This is a crm for business objectives ppt powerpoint images. This is a three stage process. The stages in this process are business market, business objectives, business resources, customer centric, diversify, profitability.
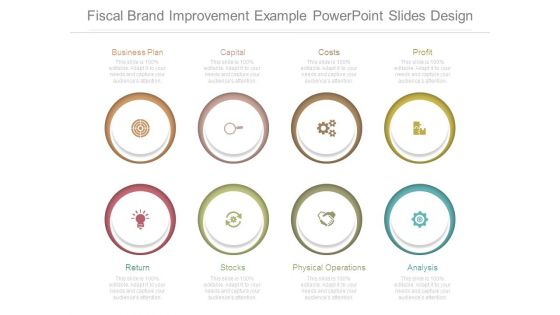
Fiscal Brand Improvement Example Powerpoint Slides Design
This is a fiscal brand improvement example powerpoint slides design. This is a eight stage process. The stages in this process are business plan, capital, costs, profit, return, stocks, physical operations, analysis.
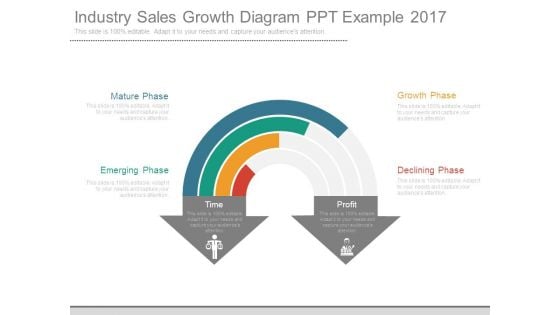
Industry Sales Growth Diagram Ppt Example 2017
This is a industry sales growth diagram ppt example 2017. This is a four stage process. The stages in this process are emerging phase, mature phase, growth phase, declining phase, time, profit.
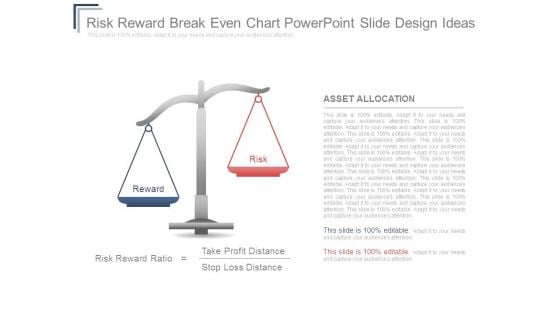
Risk Reward Breakeven Chart Powerpoint Slide Design Ideas
This is a risk reward breakeven chart powerpoint slide design ideas. This is a two stage process. The stages in this process are reward, risk, asset allocation, risk reward ratio, take profit distance, stop loss distance.
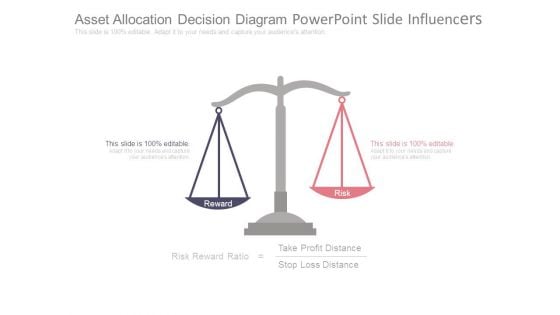
Asset Allocation Decision Diagram Powerpoint Slide Influencers
This is a asset allocation decision diagram powerpoint slide influencers. This is a two stage process. The stages in this process are risk reward ratio, take profit distance, stop loss distance, reward, risk.

Criteria Based Competition Comparison Table Powerpoint Slides
This is a criteria based competition comparison table powerpoint slides. This is a seven stage process. The stages in this process are revenue, profit, market share, main activity, number of employee, product quality.
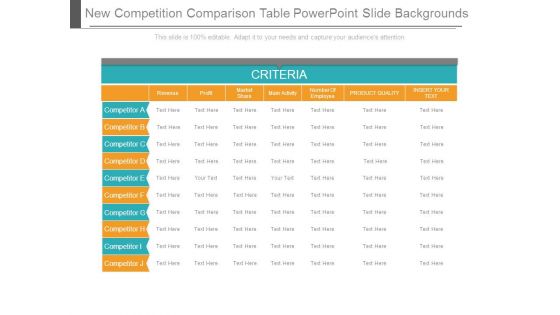
New Competition Comparison Table Powerpoint Slide Backgrounds
This is a new competition comparison table powerpoint slide backgrounds. This is a seven stage process. The stages in this process are revenue, profit, market share, main activity, number of employee, product quality, insert your text.
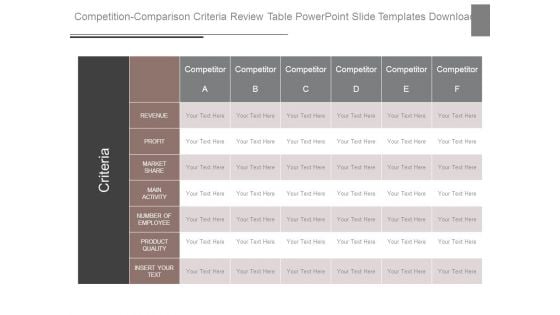
Competition Comparison Criteria Review Table Powerpoint Slide Templates Download
This is a competition comparison criteria review table powerpoint slide templates download. This is a six stage process. The stages in this process are criteria, competitor revenue, profit, market share, main activity, number of employee, product quality, insert your text.
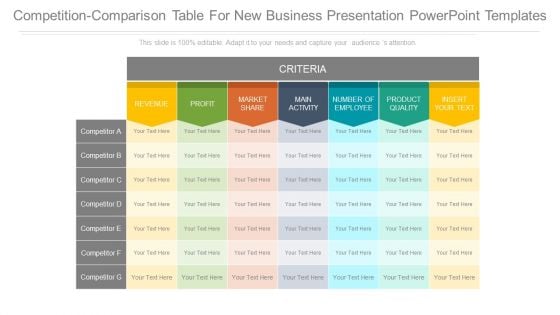
Competition Comparison Table For New Business Presentation Powerpoint Templates
This is a competition comparison table for new business presentation powerpoint templates. This is a seven stage process. The stages in this process are criteria, revenue, profit, market share, main activity, number of employee, product quality, insert your text.
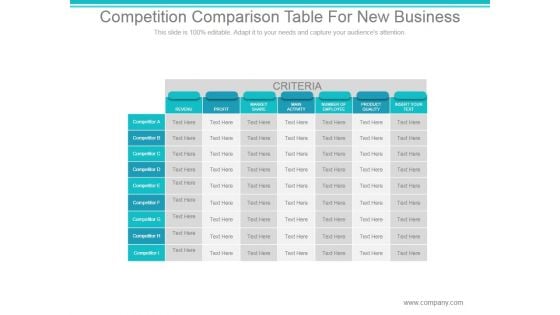
Competition Comparison Table For New Business Ppt PowerPoint Presentation Slides
This is a competition comparison table for new business ppt powerpoint presentation slides. This is a seven stage process. The stages in this process are criteria, revenue, profit, market share, main activity, number of employee, product quality, competitor.
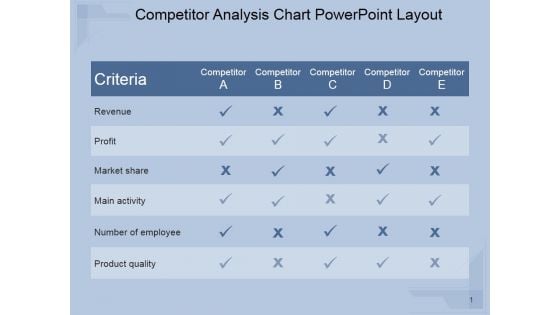
Competitor Analysis Chart Ppt PowerPoint Presentation Visuals
This is a competitor analysis chart ppt powerpoint presentation visuals. This is a five stage process. The stages in this process are revenue, profit, market share, main activity, number of employee, product quality.

Asset Allocation Ppt PowerPoint Presentation Backgrounds
This is a asset allocation ppt powerpoint presentation backgrounds. This is a two stage process. The stages in this process are reward, risk, risk reward ratio, take profit distance, stop loss distance.
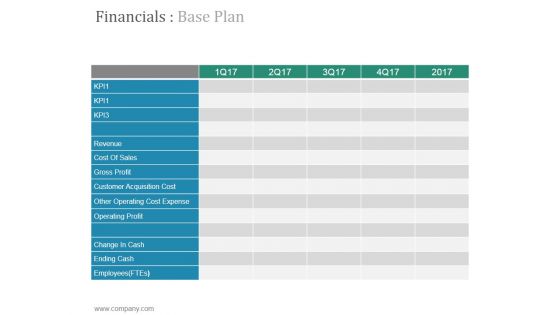
Financials Base Plan Ppt PowerPoint Presentation Portfolio
This is a financials base plan ppt powerpoint presentation portfolio. This is a five stage process. The stages in this process are revenue, cost of sales, gross profit, customer acquisition cost, other operating cost expense.
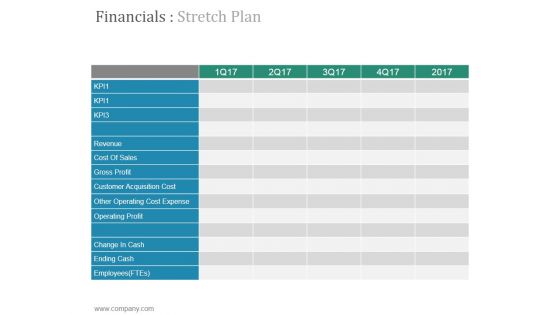
Financials Stretch Plan Ppt PowerPoint Presentation Designs
This is a financials stretch plan ppt powerpoint presentation designs. This is a five stage process. The stages in this process are revenue, cost of sales, gross profit, customer acquisition cost, other operating cost expense.
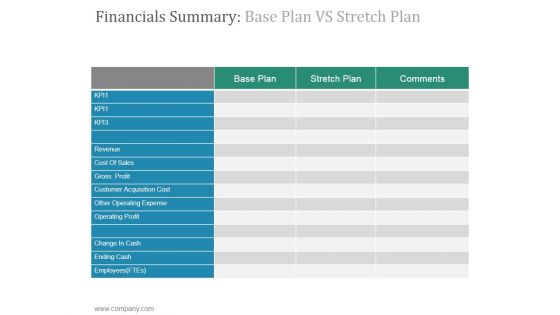
Financials Summary Base Plan VS Stretch Plan Ppt PowerPoint Presentation Design Ideas
This is a financials summary base plan vs stretch plan ppt powerpoint presentation design ideas. This is a three stage process. The stages in this process are ending cash, change in cash, operating profit, other operating expense.
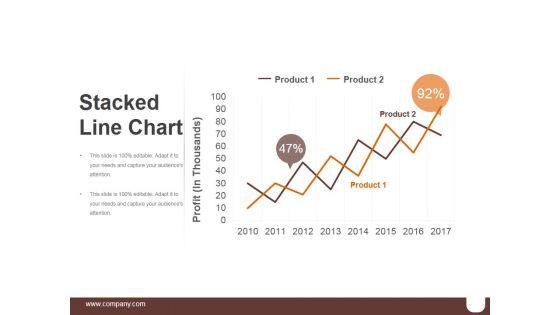
Stacked Line Chart Ppt PowerPoint Presentation Shapes
This is a stacked line chart ppt powerpoint presentation shapes. This is a two stage process. The stages in this process are product, profit in thousands, finance, analysis, growth.

Internet Marketing Concepts And Strategies Ppt PowerPoint Presentation Complete Deck With Slides
This is a internet marketing concepts and strategies ppt powerpoint presentation complete deck with slides. This is a one stage process. The stages in this process are marketing, profit, social, digital marketing, business.
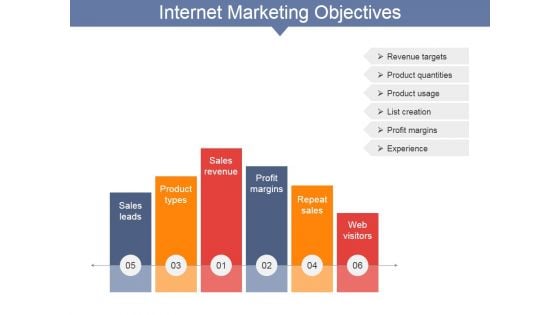
Internet Marketing Objectives Ppt PowerPoint Presentation Layouts Smartart
This is a internet marketing objectives ppt powerpoint presentation layouts smartart. This is a six stage process. The stages in this process are sales leads, product types, sales revenue, profit margins, repeat sales, web visitors.
Calculating Customer Lifetime Value Clv Ppt PowerPoint Presentation Show Icon
This is a calculating customer lifetime value clv ppt powerpoint presentation show icon. This is a five stage process. The stages in this process are average acquisition cost, average customer revenue, average customer costs, average customer profit, customer retention rate.
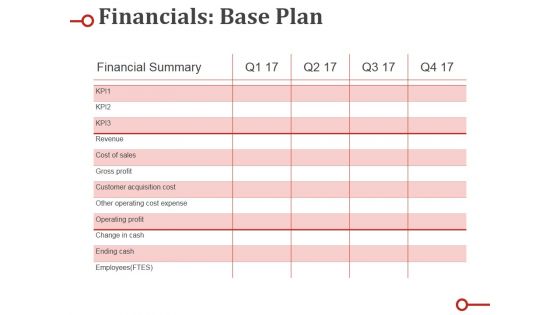
Financials Base Plan Ppt PowerPoint Presentation Portfolio Background Designs
This is a financials base plan ppt powerpoint presentation portfolio background designs. This is a four stage process. The stages in this process are revenue, cost of sales, gross profit, customer acquisition cost, other operating cost expense.
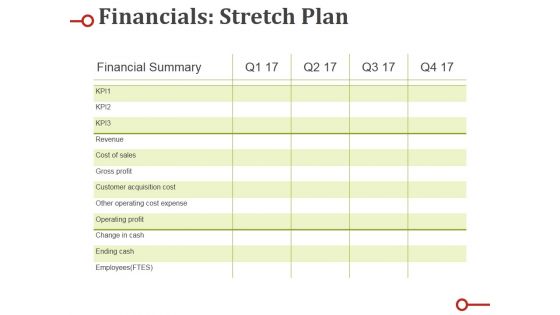
Financials Stretch Plan Ppt PowerPoint Presentation Show Designs Download
This is a financials stretch plan ppt powerpoint presentation show designs download. This is a four stage process. The stages in this process are revenue, cost of sales, gross profit, customer acquisition cost, other operating cost expense.
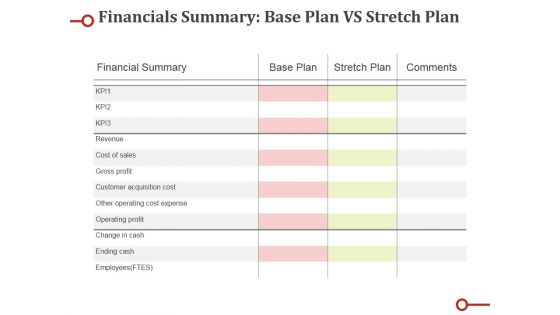
Financials Summary Base Plan Vs Stretch Plan Ppt PowerPoint Presentation Microsoft
This is a financials summary base plan vs stretch plan ppt powerpoint presentation microsoft. This is a three stage process. The stages in this process are revenue, cost of sales, gross profit, customer acquisition cost, other operating cost expense.

Summary Financials Revenue Ebitda Pat Ppt PowerPoint Presentation Model Clipart Images
This is a summary financials revenue ebitda pat ppt powerpoint presentation model clipart images. This is a three stage process. The stages in this process are revenue and gross profit, ebitda and ebitda margin, pat and pat margin.
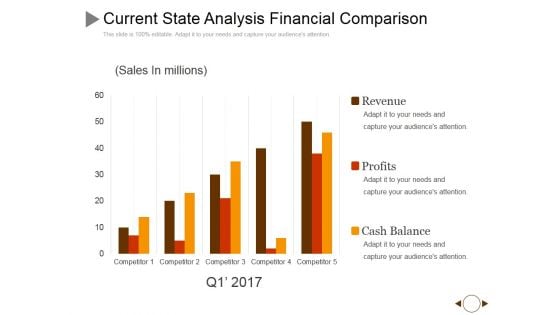
Current State Analysis Financial Comparison Ppt PowerPoint Presentation Inspiration Good
This is a current state analysis financial comparison ppt powerpoint presentation inspiration good. This is a five stage process. The stages in this process are revenue, profits, cash balance, competitor.
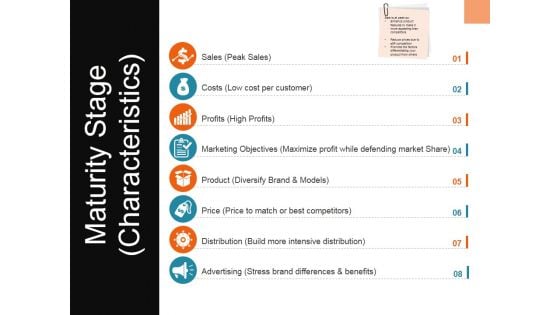
Maturity Stage Characteristics Ppt PowerPoint Presentation Slides Show
This is a maturity stage characteristics ppt powerpoint presentation slides show. This is a eight stage process. The stages in this process are sales, costs, profits, marketing objectives, product.
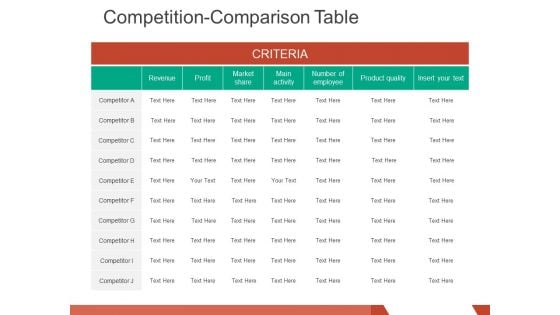
competition comparison table ppt powerpoint presentation infographics design inspiration
This is a competition comparison table ppt powerpoint presentation infographics design inspiration. This is a seven stage process. The stages in this process are revenue, profit, market share, main activity, number of employee.
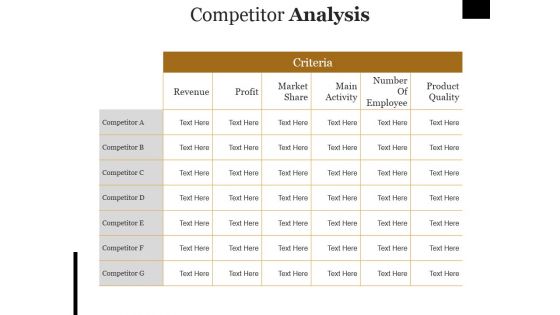
Competitor Analysis Ppt PowerPoint Presentation Outline Rules
This is a competitor analysis ppt powerpoint presentation outline rules. This is a seven stage process. The stages in this process are revenue, profit, market share, main activity, number of employee.
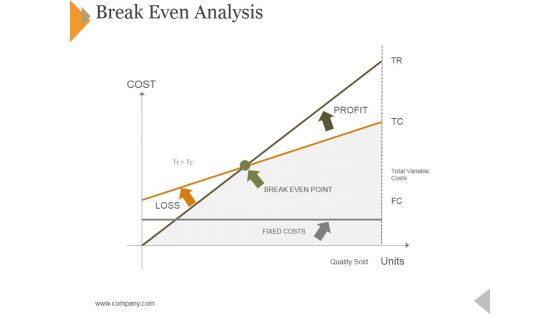
Break Even Analysis Ppt PowerPoint Presentation Model File Formats
This is a break even analysis ppt powerpoint presentation model file formats. This is a two stage process. The stages in this process are cost, loss, break even point, profit, fixed costs.
Competitor Analysis Ppt PowerPoint Presentation Ideas Icons
This is a competitor analysis ppt powerpoint presentation ideas icons. This is a seven stage process. The stages in this process are revenue, profit, market share, main activity, number of employee.
Scatter Chart Ppt PowerPoint Presentation Icon Example Introduction
This is a scatter chart ppt powerpoint presentation icon example introduction. This is a two stage process. The stages in this process are product, profit, in percentage, growth, scattered chart.
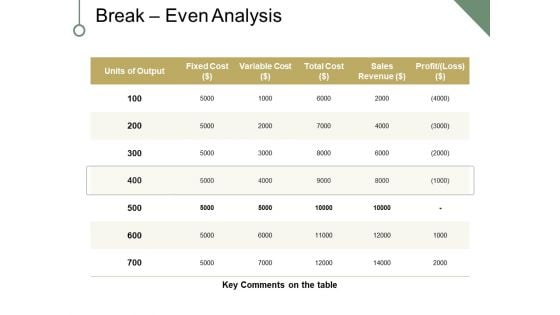
Break Even Analysis Ppt PowerPoint Presentation Portfolio Clipart
This is a break even analysis ppt powerpoint presentation portfolio clipart. This is a five stage process. The stages in this process are fixed cost, variable cost, sales revenue, profit, key comments on the table, units of output.
Comparison Based On Criteria Ppt PowerPoint Presentation Show Icon
This is a comparison based on criteria ppt powerpoint presentation show icon. This is a six stage process. The stages in this process are revenue, profit, market share, main activity, number of employee.
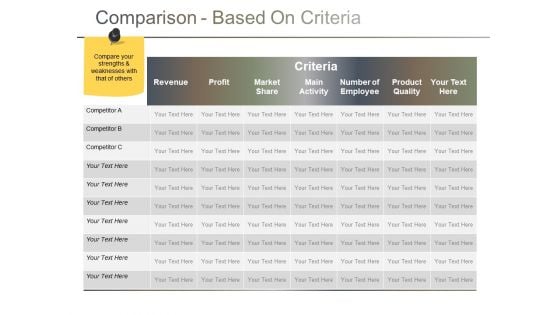
Comparison Based On Criteria Ppt PowerPoint Presentation Gallery Themes
This is a comparison based on criteria ppt powerpoint presentation gallery themes. This is a seven stage process. The stages in this process are revenue, profit, market share, main activity, product quality.

Comparison Based On Criteria Ppt PowerPoint Presentation Gallery Sample
This is a comparison based on criteria ppt powerpoint presentation gallery sample. This is a six stage process. The stages in this process are revenue, profit, market share, main activity, number of employee.

Area Chart Ppt PowerPoint Presentation Infographic Template Layout
This is a area chart ppt powerpoint presentation infographic template layout. This is a two stage process. The stages in this process are product, profit, area chart, growth, success.

Comparison Based On Criteria Ppt PowerPoint Presentation Show File Formats
This is a comparison based on criteria ppt powerpoint presentation show file formats. This is a six stage process. The stages in this process are revenue, profit, market share, main activity, number of employee.
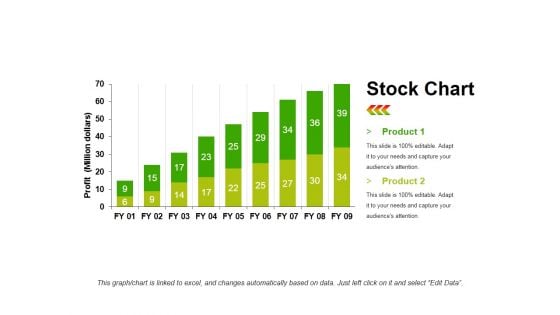
Stock Chart Template 1 Ppt PowerPoint Presentation Infographic Template Objects
This is a stock chart template 1 ppt powerpoint presentation infographic template objects. This is a two stage process. The stages in this process are product, profit, bar graph, growth, success.


 Continue with Email

 Home
Home


