Budget Calendar
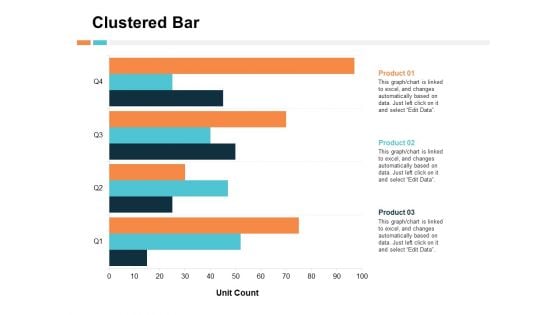
Clustered Bar Financial Ppt PowerPoint Presentation Gallery Designs Download
This is a clustered bar financial ppt powerpoint presentation gallery designs download. This is a three stage process. The stages in this process are percentage, product, business, management, marketing.
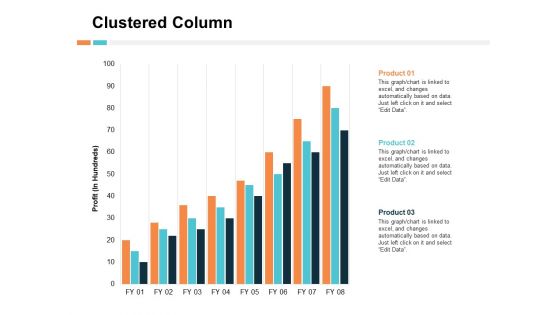
Clustered Column Product Ppt PowerPoint Presentation Outline Infographic Template
This is a clustered column product ppt powerpoint presentation outline infographic template. This is a three stage process. The stages in this process are product, percentage, business, management, marketing.
Case Studies Management Ppt Powerpoint Presentation Show Layouts Cpb
This is a case studies management ppt powerpoint presentation show layouts cpb. This is a two stage process. The stages in this process are case studies management.
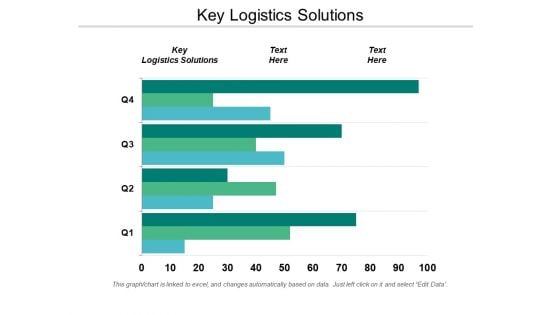
Key Logistics Solutions Ppt Powerpoint Presentation Layouts Background Images Cpb
This is a key logistics solutions ppt powerpoint presentation layouts background images cpb. This is a three stage process. The stages in this process are key logistics solutions.
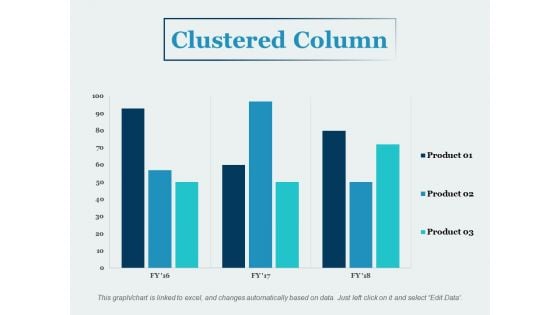
Clustered Column Financial Ppt PowerPoint Presentation Summary Information
This is a clustered column financial ppt powerpoint presentation summary information. This is a three stage process. The stages in this process are business, management, marketing, percentage, product.
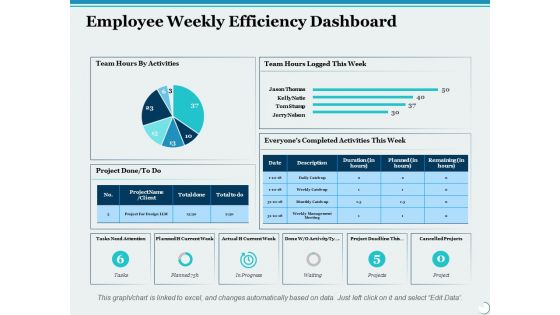
Employee Weekly Efficiency Dashboard Ppt PowerPoint Presentation Infographic Template Graphic Images
This is a employee weekly efficiency dashboard ppt powerpoint presentation infographic template graphic images. This is a six stage process. The stages in this process are percentage, product, business, management, marketing.
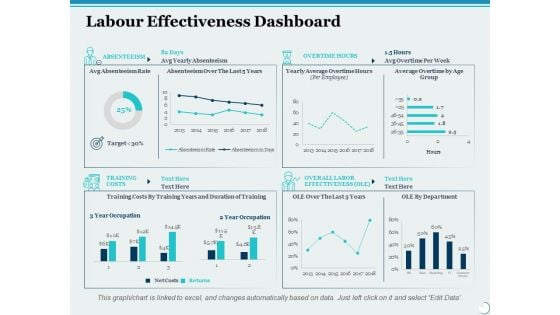
Labour Effectiveness Dashboard Ppt PowerPoint Presentation Slides File Formats
This is a labour effectiveness dashboard ppt powerpoint presentation slides file formats. This is a four stage process. The stages in this process are percentage, product, management, marketing, business.

Negative Impacts Of Workplace Stress Ppt PowerPoint Presentation Outline Slide Download
This is a negative impacts of workplace stress ppt powerpoint presentation outline slide download. This is a five stage process. The stages in this process are percentage, product, management, marketing, business.
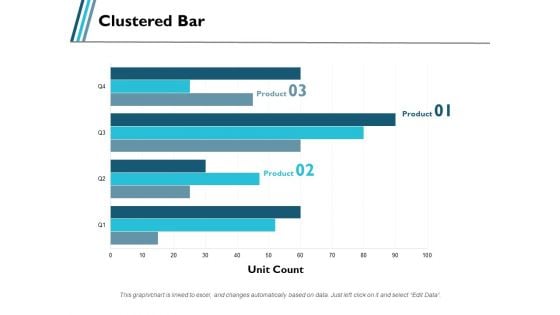
Clustered Bar Business Product Ppt PowerPoint Presentation Gallery Background
This is a clustered bar business product ppt powerpoint presentation gallery background. This is a three stage process. The stages in this process are business, management, marketing, percentage, product.
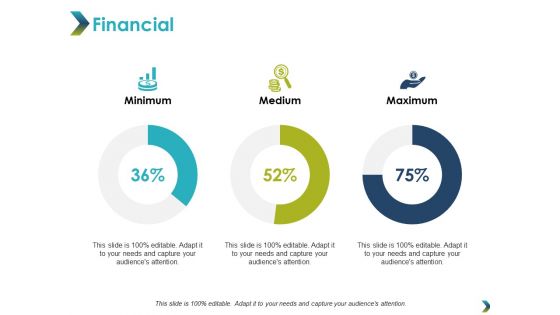
Financial Minimum Maximum Ppt PowerPoint Presentation Infographic Template Picture
This is a financial minimum maximum ppt powerpoint presentation infographic template picture. This is a three stage process. The stages in this process are financial, minimum, maximum, marketing, strategy.
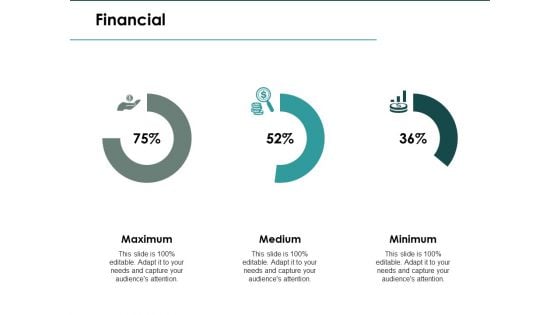
Financial Maximum Ppt PowerPoint Presentation Model Master Slide
This is a financial maximum ppt powerpoint presentation model master slide. This is a three stage process. The stages in this process are financial, maximum, medium, minimum, marketing.
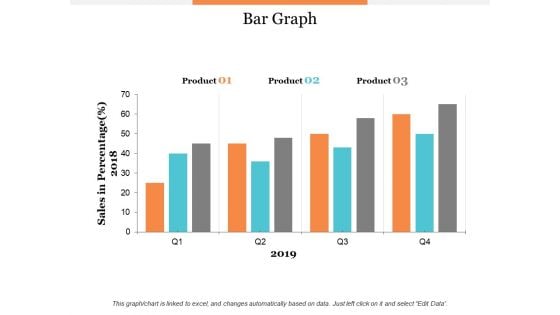
Bar Graph Product Ppt PowerPoint Presentation Model Graphic Tips
This is a bar graph product ppt powerpoint presentation model graphic tips. This is a three stage process. The stages in this process are product, percentage, business, management, marketing.
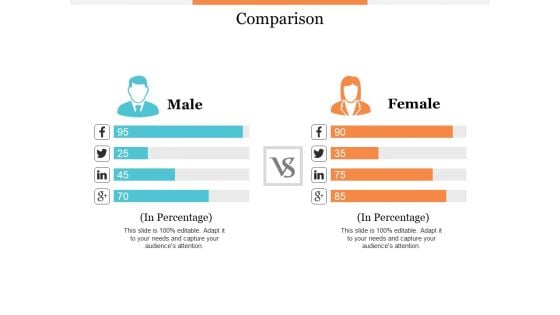
Comparison Male And Female Ppt PowerPoint Presentation Professional Skills
This is a comparison male and female ppt powerpoint presentation professional skills. This is a two stage process. The stages in this process are product, percentage, business, management, marketing.
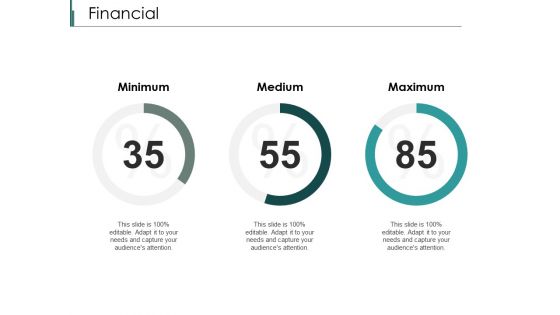
Financial Minimum Medium Ppt PowerPoint Presentation Summary Themes
This is a financial minimum medium ppt powerpoint presentation summary themes. This is a three stage process. The stages in this process are financial, maximum, medium, minimum, marketing.
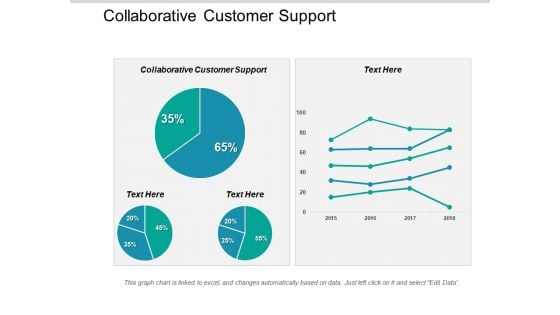
Collaborative Customer Support Ppt PowerPoint Presentation Inspiration Slides Cpb
This is a collaborative customer support ppt powerpoint presentation inspiration slides cpb. This is a two stage process. The stages in this process are collaborative customer support.
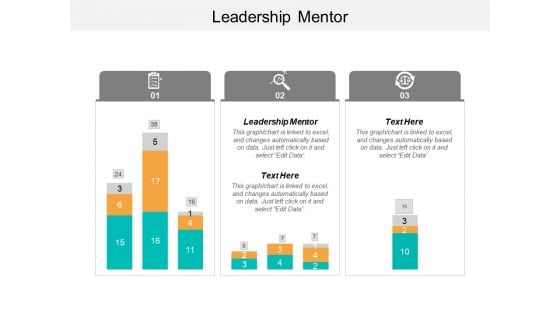
Leadership Mentor Ppt PowerPoint Presentation Diagram Ppt Cpb
This is a leadership mentor ppt powerpoint presentation diagram ppt cpb. This is a three stage process. The stages in this process are leadership mentor.
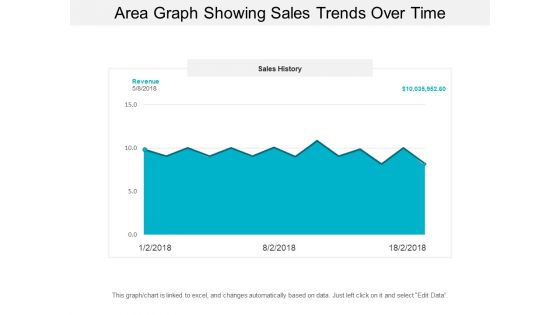
Area Graph Showing Sales Trends Over Time Ppt PowerPoint Presentation Model Background Designs
This is a area graph showing sales trends over time ppt powerpoint presentation model background designs. This is a three stage process. The stages in this process are financial analysis, quantitative, statistical modelling.
Bar Graph Icon For Data Analysis Ppt PowerPoint Presentation Pictures Ideas
This is a bar graph icon for data analysis ppt powerpoint presentation pictures ideas. This is a four stage process. The stages in this process are financial analysis, quantitative, statistical modelling.
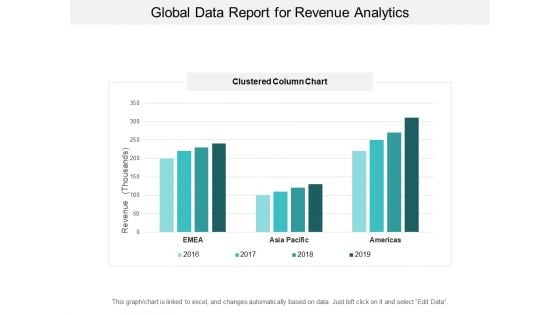
Global Data Report For Revenue Analytics Ppt PowerPoint Presentation Inspiration Visuals
This is a global data report for revenue analytics ppt powerpoint presentation inspiration visuals. This is a four stage process. The stages in this process are financial analysis, quantitative, statistical modelling.
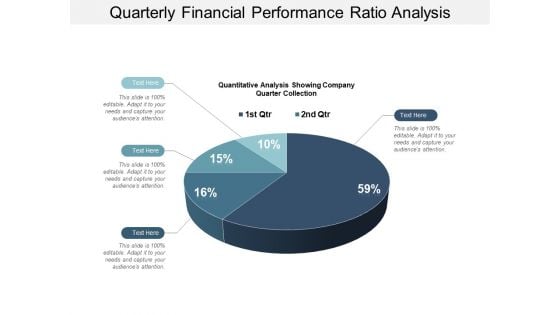
Quarterly Financial Performance Ratio Analysis Ppt PowerPoint Presentation Model Format Ideas
This is a quarterly financial performance ratio analysis ppt powerpoint presentation model format ideas. This is a four stage process. The stages in this process are financial analysis, quantitative, statistical modelling.

Industry Market Share Ppt PowerPoint Presentation Pictures Format
This is a industry market share ppt powerpoint presentation pictures format. This is a six stage process. The stages in this process are percentage, product, management, marketing, business.
Market Potential Ppt PowerPoint Presentation Icon Influencers
This is a market potential ppt powerpoint presentation icon influencers. This is a six stage process. The stages in this process are percentage, product, management, marketing, business.
Financial Percentage Ppt PowerPoint Presentation Icon Templates
This is a financial percentage ppt powerpoint presentation icon templates. This is a three stage process. The stages in this process are business, marketing, management, financial.
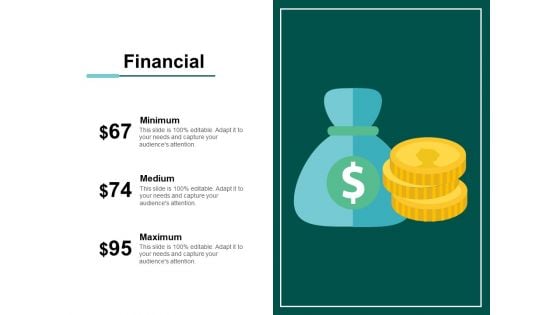
Financial Percentage Ppt PowerPoint Presentation Model Design Templates
This is a financial percentage ppt powerpoint presentation model design templates. This is a three stage process. The stages in this process are financial, minimum, maximum, marketing, strategy.
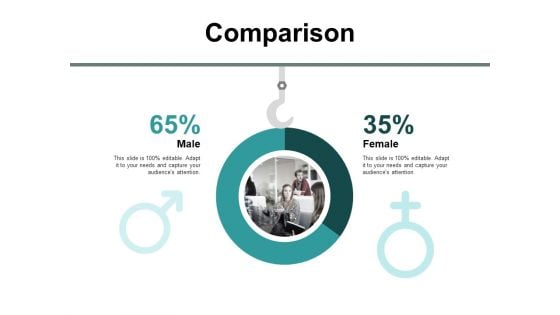
Comparison Male Female Ppt PowerPoint Presentation Show Influencers
This is a comparison male female ppt powerpoint presentation show influencers. This is a two stage process. The stages in this process are comparison, male, female, marketing, management.

Comparison Minimum Ppt PowerPoint Presentation File Visual Aids
This is a comparison minimum ppt powerpoint presentation file visual aids. This is a three stage process. The stages in this process are financial, maximum, medium, minimum, marketing.
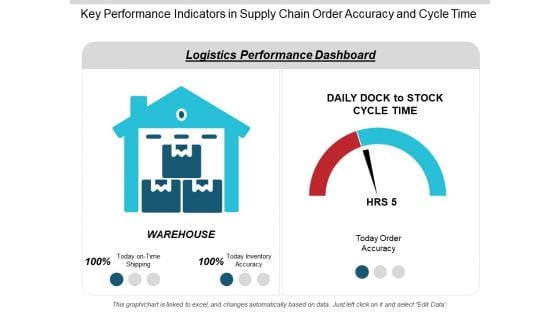
Key Performance Indicators In Supply Chain Order Accuracy And Cycle Time Ppt PowerPoint Presentation Infographics Slideshow
This is a key performance indicators in supply chain order accuracy and cycle time ppt powerpoint presentation infographics slideshow. This is a two stage process. The stages in this process are logistics performance, logistics dashboard, logistics kpis.

Kpis In Shipping Perfect Order Rate And On Time Shipment Ppt PowerPoint Presentation Show Guide
This is a kpis in shipping perfect order rate and on time shipment ppt powerpoint presentation show guide. This is a six stage process. The stages in this process are logistics performance, logistics dashboard, logistics kpis.
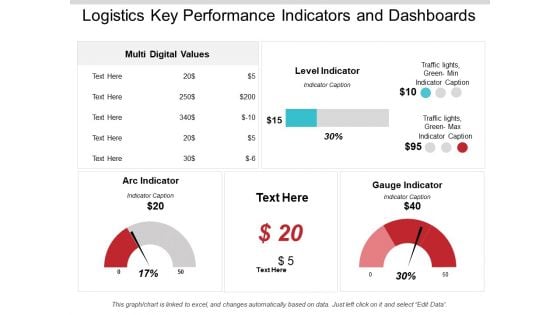
Logistics Key Performance Indicators And Dashboards Ppt PowerPoint Presentation Infographics Background Image
This is a logistics key performance indicators and dashboards ppt powerpoint presentation infographics background image. This is a three stage process. The stages in this process are logistics performance, logistics dashboard, logistics kpis.
Logistics Kpis And Metrics Percentage Of Orders Delivered Ppt PowerPoint Presentation Icon
This is a logistics kpis and metrics percentage of orders delivered ppt powerpoint presentation icon. This is a five stage process. The stages in this process are logistics performance, logistics dashboard, logistics kpis.
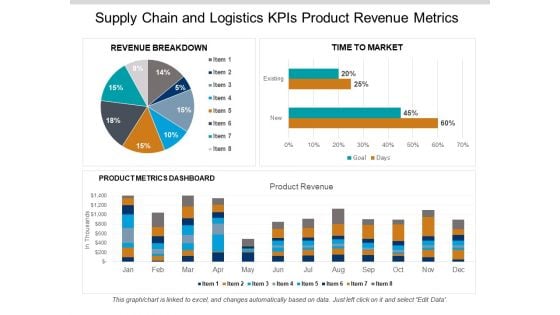
Supply Chain And Logistics Kpis Product Revenue Metrics Ppt PowerPoint Presentation Gallery Aids
This is a supply chain and logistics kpis product revenue metrics ppt powerpoint presentation gallery aids. This is a three stage process. The stages in this process are logistics performance, logistics dashboard, logistics kpis.
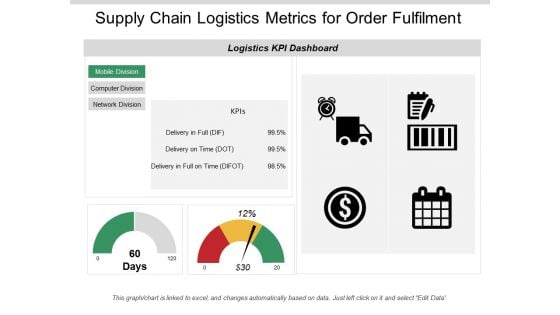
Supply Chain Logistics Metrics For Order Fulfilment Ppt PowerPoint Presentation Infographic Template Information
This is a supply chain logistics metrics for order fulfilment ppt powerpoint presentation infographic template information. This is a two stage process. The stages in this process are logistics performance, logistics dashboard, logistics kpis.

Supply Chain Metrics Fleet Efficiency Loading Time And Weight Ppt PowerPoint Presentation Portfolio Guidelines
This is a supply chain metrics fleet efficiency loading time and weight ppt powerpoint presentation portfolio guidelines. This is a four stage process. The stages in this process are logistics performance, logistics dashboard, logistics kpis.
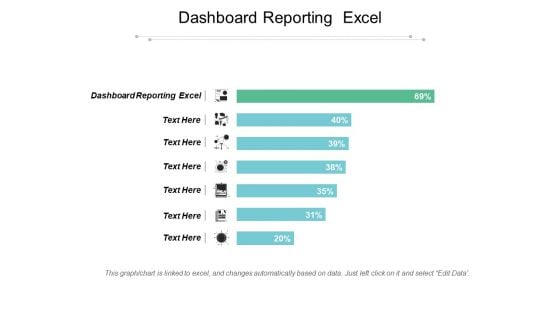
Dashboard Reporting Excel Ppt PowerPoint Presentation Layouts Templates Cpb
This is a dashboard reporting excel ppt powerpoint presentation layouts templates cpb. This is a seven stage process. The stages in this process are dashboard reporting excel.
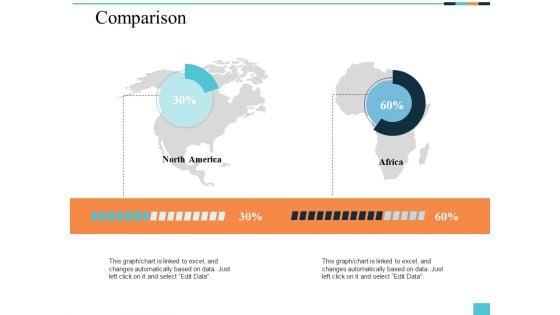
Comparison Male And Female Ppt PowerPoint Presentation Slides Designs
This is a comparison male and female ppt powerpoint presentation slides designs. This is a two stage process. The stages in this process are marketing, management, comparison, product.
Retail Competition Ppt PowerPoint Presentation Icon Microsoft
This is a retail competition ppt powerpoint presentation icon microsoft. This is a six stage process. The stages in this process are customer service, shipping speed, product quality, price, product fidelity.
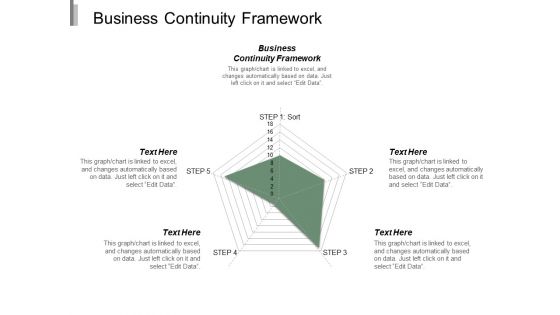
Business Continuity Framework Ppt PowerPoint Presentation Gallery Design Templates Cpb
This is a business continuity framework ppt powerpoint presentation gallery design templates cpb. This is a five stage process. The stages in this process are business continuity framework.
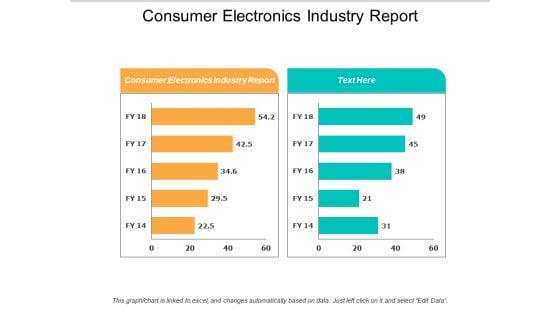
Consumer Electronics Industry Report Ppt PowerPoint Presentation Model Elements Cpb
This is a consumer electronics industry report ppt powerpoint presentation model elements cpb. This is a two stage process. The stages in this process are consumer electronics industry report.
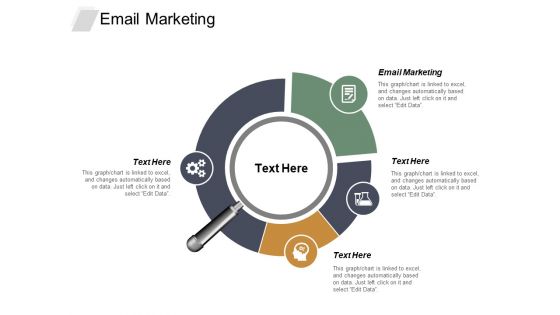
Email Marketing Ppt PowerPoint Presentation Styles Slide Cpb
This is a email marketing ppt powerpoint presentation styles slide cpb. This is a four stage process. The stages in this process are email marketing.
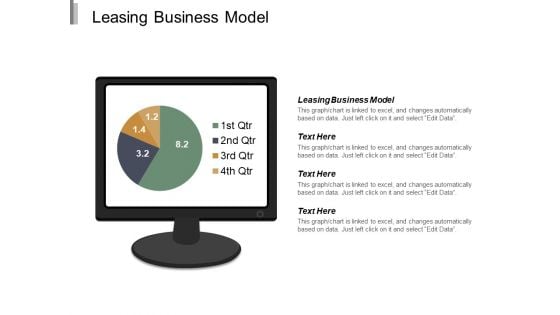
Leasing Business Model Ppt PowerPoint Presentation Professional Demonstration Cpb
This is a leasing business model ppt powerpoint presentation professional demonstration cpb. This is a four stage process. The stages in this process are leasing business model.
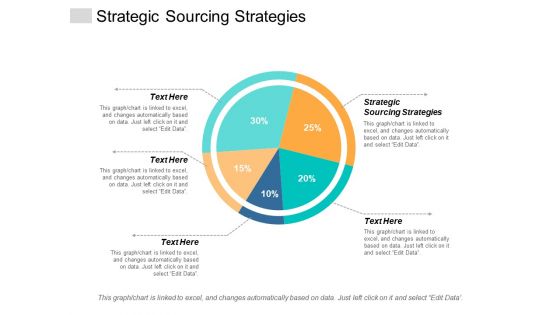
Strategic Sourcing Strategies Ppt PowerPoint Presentation Gallery Inspiration Cpb
This is a strategic sourcing strategies ppt powerpoint presentation gallery inspiration cpb. This is a five stage process. The stages in this process are strategic sourcing strategies.
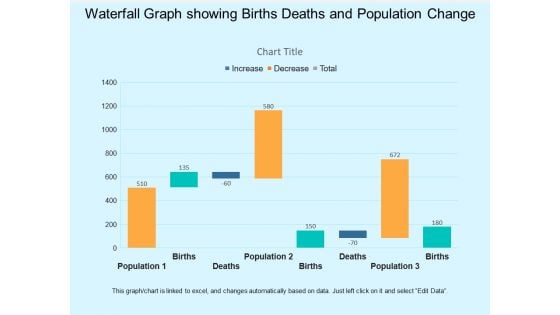
Waterfall Graph Showing Births Deaths And Population Change Ppt PowerPoint Presentation Infographic Template Visual Aids
This is a waterfall graph showing births deaths and population change ppt powerpoint presentation infographic template visual aids. This is a three stage process. The stages in this process are profit and loss, balance sheet, income statement, benefit and loss.
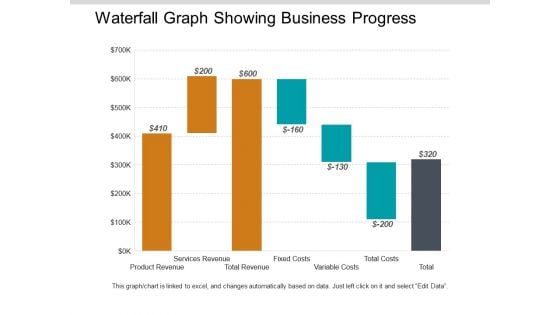
Waterfall Graph Showing Business Progress Ppt PowerPoint Presentation Styles Model
This is a waterfall graph showing business progress ppt powerpoint presentation styles model. This is a three stage process. The stages in this process are profit and loss, balance sheet, income statement, benefit and loss.
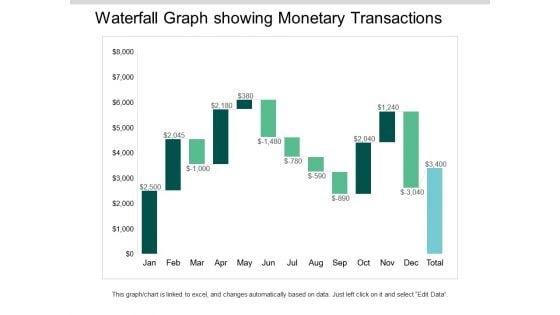
Waterfall Graph Showing Monetary Transactions Ppt PowerPoint Presentation Ideas Visuals
This is a waterfall graph showing monetary transactions ppt powerpoint presentation ideas visuals. This is a three stage process. The stages in this process are profit and loss, balance sheet, income statement, benefit and loss.
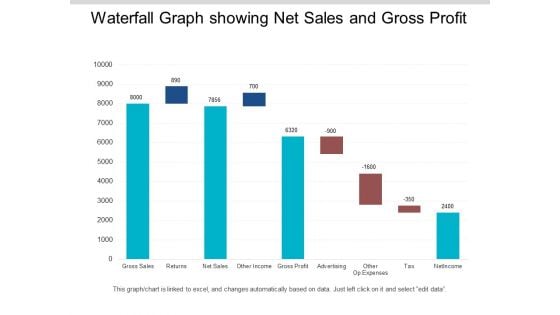
Waterfall Graph Showing Net Sales And Gross Profit Ppt PowerPoint Presentation Infographics Format
This is a waterfall graph showing net sales and gross profit ppt powerpoint presentation infographics format. This is a three stage process. The stages in this process are profit and loss, balance sheet, income statement, benefit and loss.
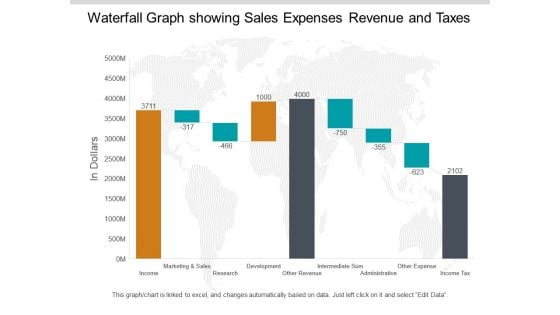
Waterfall Graph Showing Sales Expenses Revenue And Taxes Ppt PowerPoint Presentation Pictures Summary
This is a waterfall graph showing sales expenses revenue and taxes ppt powerpoint presentation pictures summary. This is a three stage process. The stages in this process are profit and loss, balance sheet, income statement, benefit and loss.
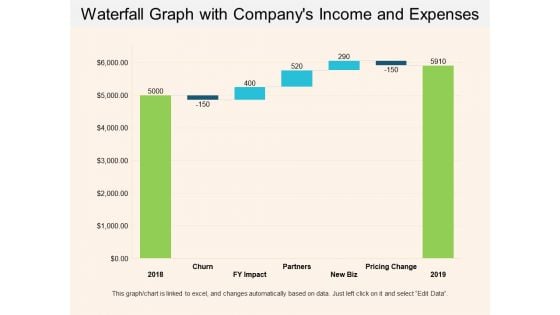
Waterfall Graph With Companys Income And Expenses Ppt PowerPoint Presentation Show Example Introduction
This is a waterfall graph with companys income and expenses ppt powerpoint presentation show example introduction. This is a three stage process. The stages in this process are profit and loss, balance sheet, income statement, benefit and loss.
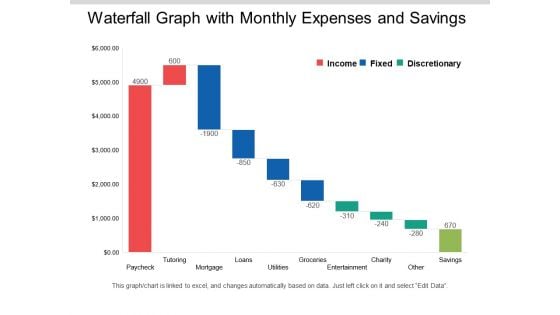
Waterfall Graph With Monthly Expenses And Savings Ppt PowerPoint Presentation Layouts Clipart Images
This is a waterfall graph with monthly expenses and savings ppt powerpoint presentation layouts clipart images. This is a three stage process. The stages in this process are profit and loss, balance sheet, income statement, benefit and loss.
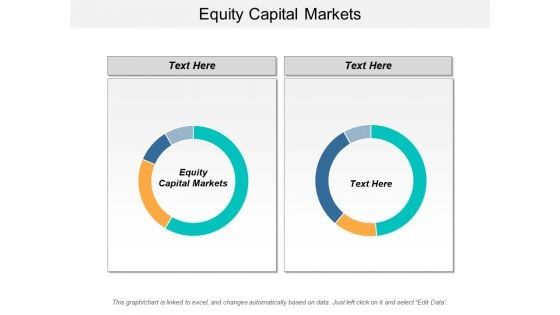
Equity Capital Markets Ppt PowerPoint Presentation Outline Picture Cpb
This is a equity capital markets ppt powerpoint presentation outline picture cpb. This is a two stage process. The stages in this process are equity capital markets.
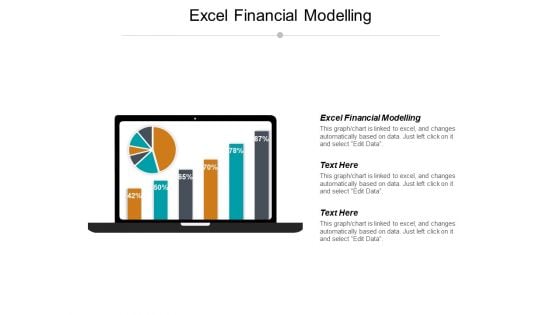
Excel Financial Modelling Ppt PowerPoint Presentation Show Graphic Tips Cpb
This is a excel financial modelling ppt powerpoint presentation show graphic tips cpb. This is a three stage process. The stages in this process are excel financial modelling.
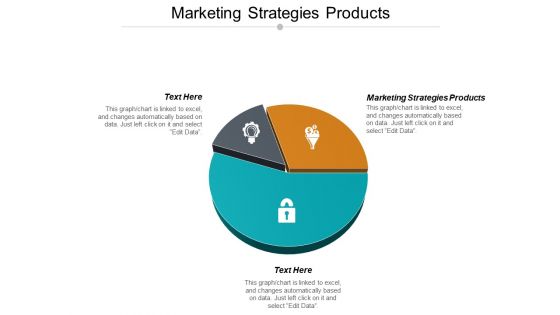
Marketing Strategies Products Ppt PowerPoint Presentation Pictures Maker Cpb
This is a marketing strategies products ppt powerpoint presentation pictures maker cpb. This is a three stage process. The stages in this process are marketing strategies products.
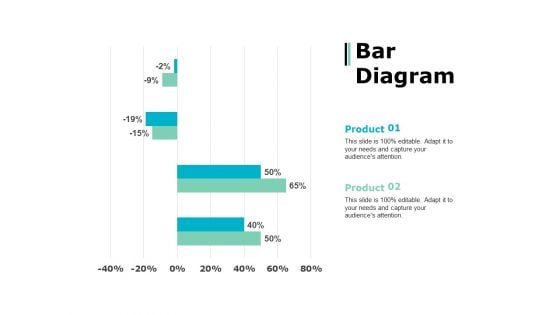
Bar Diagram Percentage Product Ppt PowerPoint Presentation Show Topics
This is a bar diagram percentage product ppt powerpoint presentation show topics. This is a two stage process. The stages in this process are percentage, product, business, management, marketing.
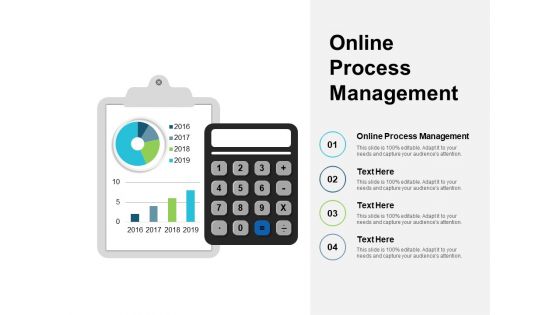
Online Process Management Ppt PowerPoint Presentation Summary Example Introduction Cpb
This is a online process management ppt powerpoint presentation summary example introduction cpb. This is a four stage process. The stages in this process are online process management.
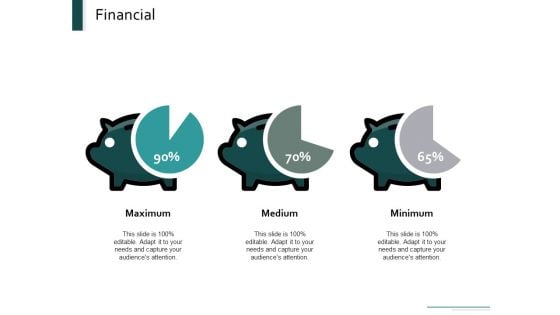
Financial Maximum Medium Minimum Ppt Powerpoint Presentation Portfolio Master Slide
This is a financial maximum medium minimum ppt powerpoint presentation portfolio master slide.This is a three stage process. The stages in this process are financial, maximum, medium, minimum, management.
Venn Management Ppt PowerPoint Presentation Infographics Graphic Images
Presenting this set of slides with name venn management ppt powerpoint presentation infographics graphic images. This is a two stage process. The stages in this process are venn. This is a completely editable PowerPoint presentation and is available for immediate download. Download now and impress your audience.
Corporate Employee Engagement Celebrate Achievements Ppt Icon Ideas PDF
Presenting this set of slides with name corporate employee engagement celebrate achievements ppt icon ideas pdf. This is a three stage process. The stages in this process are celebrate achievements. This is a completely editable PowerPoint presentation and is available for immediate download. Download now and impress your audience.
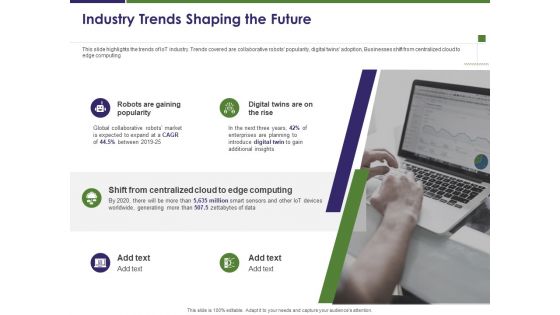
Business Intelligence Report Industry Trends Shaping The Future Ppt Show Gallery PDF
Presenting this set of slides with name business intelligence report industry trends shaping the future ppt show gallery pdf. This is a five stage process. The stages in this process are robots are gaining popularity, digital twins are on the rise, shift from centralized cloud to edge computing. This is a completely editable PowerPoint presentation and is available for immediate download. Download now and impress your audience.
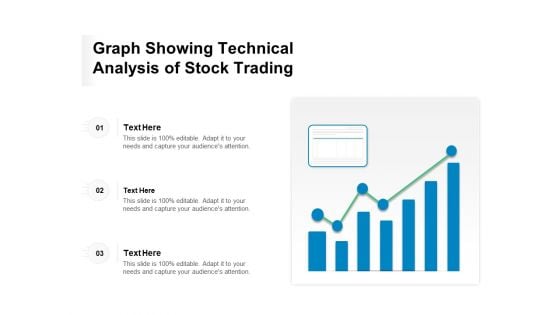
Graph Showing Technical Analysis Of Stock Trading Ppt PowerPoint Presentation Infographic Template Portrait PDF
Presenting this set of slides with name graph showing technical analysis of stock trading ppt powerpoint presentation infographic template portrait pdf. This is a three stage process. The stages in this process are graph showing technical analysis of stock trading. This is a completely editable PowerPoint presentation and is available for immediate download. Download now and impress your audience.
API Integration Software Development Circular Diagram Ppt Icon Clipart Images PDF
Presenting this set of slides with name api integration software development circular diagram ppt icon clipart images pdf. This is a six stage process. The stages in this process are circular diagram. This is a completely editable PowerPoint presentation and is available for immediate download. Download now and impress your audience.
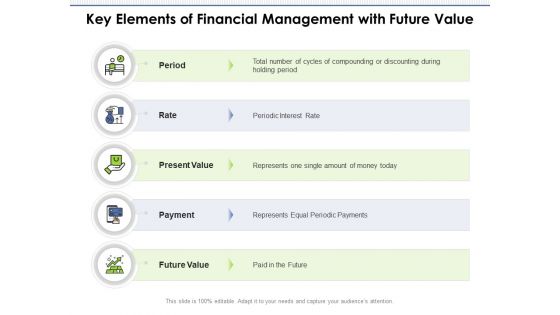
Key Elements Of Financial Management With Future Value Ppt PowerPoint Presentation Gallery Portfolio PDF
Presenting this set of slides with name key elements of financial management with future value ppt powerpoint presentation gallery portfolio pdf. This is a five stage process. The stages in this process are present value, payment, rate. This is a completely editable PowerPoint presentation and is available for immediate download. Download now and impress your audience.


 Continue with Email

 Home
Home


