Budget Graph
Doughnut Graph Icon Highlighting IT Team Structure Structure PDF
Presenting Doughnut Graph Icon Highlighting IT Team Structure Structure PDF to dispense important information. This template comprises four stages. It also presents valuable insights into the topics including Doughnut Graph, Icon Highlighting, IT Team Structure. This is a completely customizable PowerPoint theme that can be put to use immediately. So, download it and address the topic impactfully.
Doughnut Graph Icon With Dollar Symbol Topics PDF
Persuade your audience using this Doughnut Graph Icon With Dollar Symbol Topics PDF. This PPT design covers four stages, thus making it a great tool to use. It also caters to a variety of topics including Doughnut Graph, Icon, Dollar Symbol. Download this PPT design now to present a convincing pitch that not only emphasizes the topic but also showcases your presentation skills.
Graph Comparison Icon For Liquidity Financial Ratios Analysis Summary PDF
Presenting Graph Comparison Icon For Liquidity Financial Ratios Analysis Summary PDF to dispense important information. This template comprises Three stages. It also presents valuable insights into the topics including Graph Comparison, Icon For Liquidity, Financial Ratios Analysis. This is a completely customizable PowerPoint theme that can be put to use immediately. So, download it and address the topic impactfully.
Gross Revenue Margin Comparison Graph Icon Clipart PDF
Persuade your audience using this Gross Revenue Margin Comparison Graph Icon Clipart PDF. This PPT design covers three stages, thus making it a great tool to use. It also caters to a variety of topics including Gross Revenue Margin, Comparison Graph Icon. Download this PPT design now to present a convincing pitch that not only emphasizes the topic but also showcases your presentation skills.
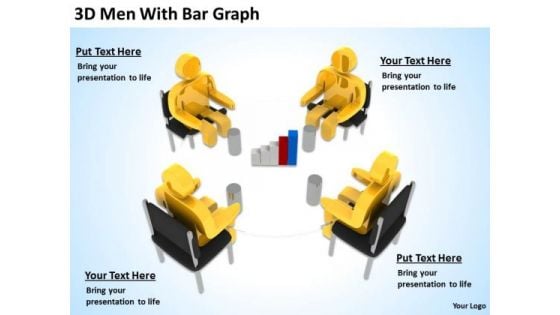
Business People Vector 3d Men With Bar Graph PowerPoint Slides
We present our business people vector 3d men with bar graph PowerPoint Slides.Use our People PowerPoint Templates because Our PowerPoint Templates and Slides are a sure bet. Gauranteed to win against all odds. Download and present our Business PowerPoint Templates because Our PowerPoint Templates and Slides will bullet point your ideas. See them fall into place one by one. Download and present our Flow Charts PowerPoint Templates because Our PowerPoint Templates and Slides are created by a hardworking bunch of busybees. Always flitting around with solutions gauranteed to please. Download our Marketing PowerPoint Templates because It can Bubble and burst with your ideas. Use our Shapes PowerPoint Templates because Our PowerPoint Templates and Slides will let you Leave a lasting impression to your audiences. They possess an inherent longstanding recall factor.Use these PowerPoint slides for presentations relating to 3d, accounting, analysis, bar, business, cartoon,cash, character, chart, clipart, committee, company, concept, corporate,council, directors, display, document, economics, executive, figure, finance,financial, goal, graph, group, growth, guy, human, humanoid, man, management,market, meeting, money, office, percentage, performance, pie, presentation, report,room, statistics, table, team. The prominent colors used in the PowerPoint template are Yellow, Black, Gray. Professionals tell us our business people vector 3d men with bar graph PowerPoint Slides have awesome images to get your point across. Professionals tell us our analysis PowerPoint templates and PPT Slides will help you be quick off the draw. Just enter your specific text and see your points hit home. People tell us our business people vector 3d men with bar graph PowerPoint Slides effectively help you save your valuable time. Customers tell us our bar PowerPoint templates and PPT Slides are effectively colour coded to prioritise your plans They automatically highlight the sequence of events you desire. The feedback we get is that our business people vector 3d men with bar graph PowerPoint Slides will generate and maintain the level of interest you desire. They will create the impression you want to imprint on your audience. Use our business PowerPoint templates and PPT Slides have awesome images to get your point across. Upgrade your presentation with our Business People Vector 3d Men With Bar Graph PowerPoint Slides. Download without worries with our money back guaranteee.
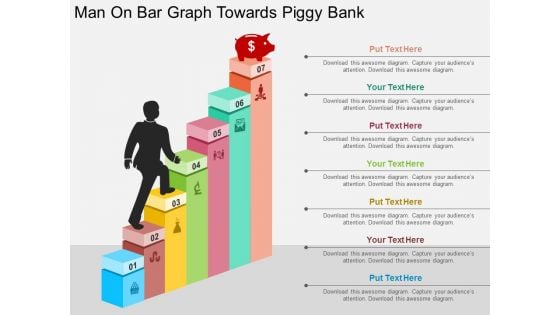
Man On Bar Graph Towards Piggy Bank Powerpoint Templates
Our above business slide contains graphics of man on bar graph towards piggy bank. This slide may be used to exhibit finance planning and saving. Capture the attention of your audience with this slide.
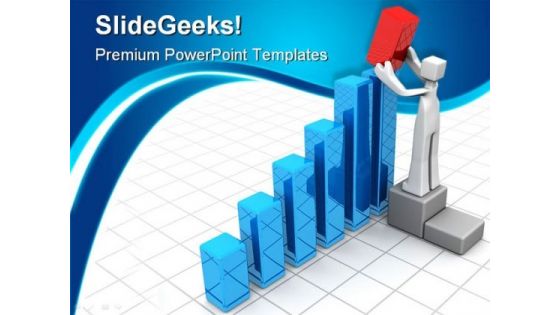
Growth Graph Finance PowerPoint Templates And PowerPoint Backgrounds 0511
Microsoft PowerPoint Template and Background with businessman adding a red bar chart to increase financial growth Transition to a better presentation with our Growth Graph Finance PowerPoint Templates And PowerPoint Backgrounds 0511. Download without worries with our money back guaranteee.
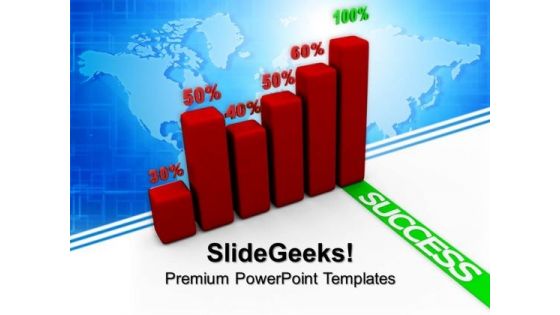
Success Graph Finance PowerPoint Templates And PowerPoint Themes 1012
Success Graph Finance PowerPoint Templates And PowerPoint Themes 1012-The Above PowerPoint Template shows the Bar graph of Several Components showing the Percentage of each component. It signifies the Concept of Growth, Finance, Investment etc. Prove how they mesh to motivate the company team and provide the steam to activate the composite machine. You have noted down some very fruitful ideas that have occurred to you at random moments. Organize them all and prioritize them effectively.-Success Graph Finance PowerPoint Templates And PowerPoint Themes 1012-This PowerPoint template can be used for presentations relating to-Business growth, Business, Finance, Marketing, Success, Symbol Bounce back with our Success Graph Finance PowerPoint Templates And PowerPoint Themes 1012. You will come out on top.
Business Graph Marketing PowerPoint Templates And PowerPoint Themes 0212
Microsoft Powerpoint Templates and Background with three dimensional diagram Our Business Graph Marketing PowerPoint Templates And PowerPoint Themes 0212 come at a comfortable cost. They are definitely an economical choice.
Dollar And Graph Business PowerPoint Templates And PowerPoint Themes 1112
We present our Dollar And Graph Business PowerPoint Templates And PowerPoint Themes 1112.Use our Signs PowerPoint Templates because, This business powerpoint template helps expound on the logic of your detailed thought process to take your company forward. Use our Money PowerPoint Templates because, Churn the wheels of the brains of your colleagues. Use our Finance PowerPoint Templates because,Educate your team and the attention you have paid. Use our Business PowerPoint Templates because, It is also a time to bond with family, friends, colleagues and any other group of your choice. Use our Success PowerPoint Templates because, Explain thecontribution of each of the elements and how they provide impetus to the next phase.Use these PowerPoint slides for presentations relating to Business graph, signs, success, money, finance, business . The prominent colors used in the PowerPoint template are Yellow, Orange, Black Adopt adventure with our Dollar And Graph Business PowerPoint Templates And PowerPoint Themes 1112. Discover new avenues for your thoughts.
Map Diagram With Bar Graph And Icons Powerpoint Slides
This PowerPoint template displays graphics of map diagram with bar graph and icons. This Map template can be used in business presentations to depict economic analysis. This slide can also be used by school students for educational projects.
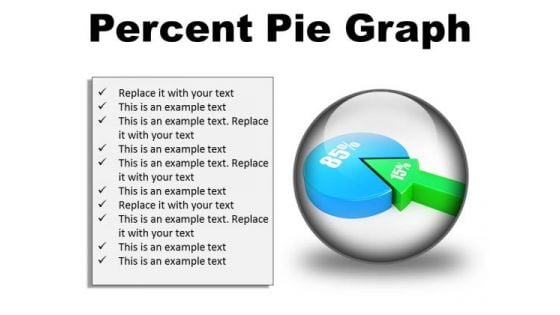
Percent Pie Graph Business PowerPoint Presentation Slides C
Microsoft PowerPoint Slides and Backgrounds with fifteen and eighty five percent proportion pie chart Figure out the finances with our Percent Pie Graph Business PowerPoint Presentation Slides C. They help you get the calculations correct.
Growth Graph Finance PowerPoint Themes And PowerPoint Slides 0511
Microsoft PowerPoint Theme and Slide with businessman adding a red bar chart to increase financial growth Our Growth Graph Finance PowerPoint Themes And PowerPoint Slides 0511 empower educators. Conveying concepts and ideas becomes easier.
Human Resource Graph Icon For Workforce Development Brochure PDF
Persuade your audience using this Human Resource Graph Icon For Workforce Development Brochure PDF. This PPT design covers three stages, thus making it a great tool to use. It also caters to a variety of topics including Workforce Development, Graph Icon, Human Resource. Download this PPT design now to present a convincing pitch that not only emphasizes the topic but also showcases your presentation skills.
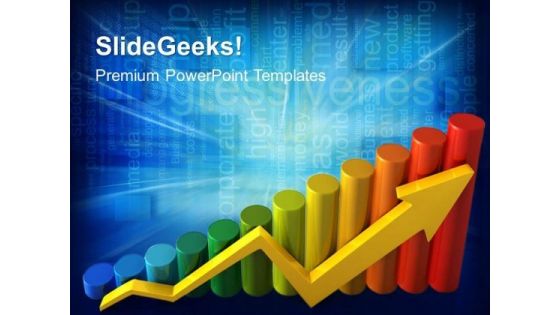
Progress Graph Finance PowerPoint Templates And PowerPoint Themes 0412
Microsoft Powerpoint Templates and Background with bar chart growth Achieve any end with our Progress Graph Finance PowerPoint Templates And PowerPoint Themes 0412. They will carry your thoughts further than you think.
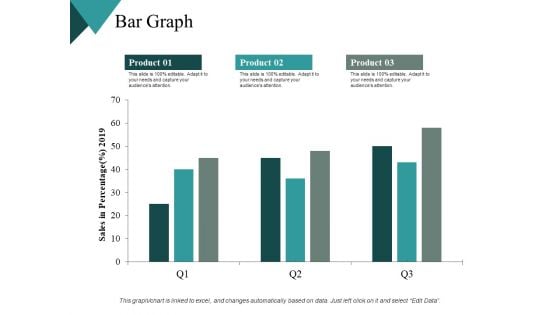
Bar Graph Finance Ppt PowerPoint Presentation Outline Background Designs
This is a bar graph finance ppt powerpoint presentation outline background designs. This is a three stage process. The stages in this process are financial, maximum, medium, minimum, marketing.
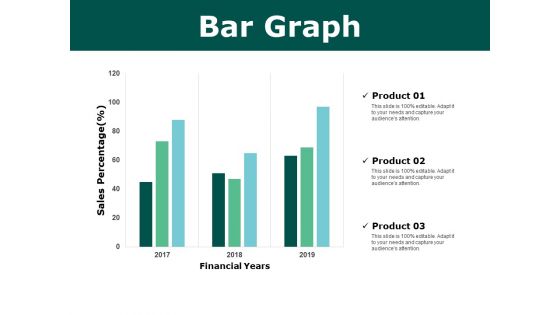
Bar Graph Finance Ppt PowerPoint Presentation Pictures Portrait
This is a bar graph finance ppt powerpoint presentation pictures portrait. The topics discussed in this diagram are marketing, business, management, planning, strategy This is a completely editable PowerPoint presentation, and is available for immediate download.
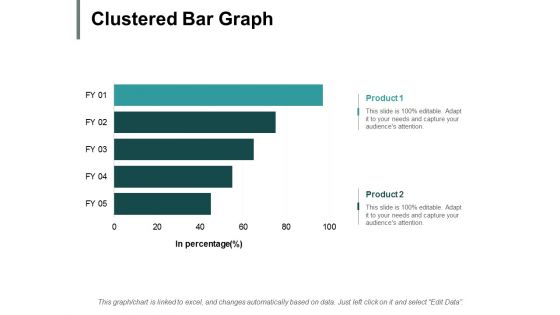
Clustered Bar Graph Ppt PowerPoint Presentation Pictures Example File
This is a clustered bar graph ppt powerpoint presentation pictures example file. This is a two stage process. The stages in this process are finance, marketing, management, investment, analysis.
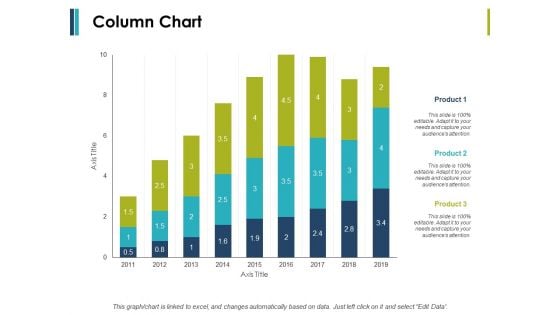
Column Chart And Graph Ppt PowerPoint Presentation File Introduction
This is a column chart and graph ppt powerpoint presentation file introduction. This is a three stage process. The stages in this process are finance, marketing, management, investment, analysis.
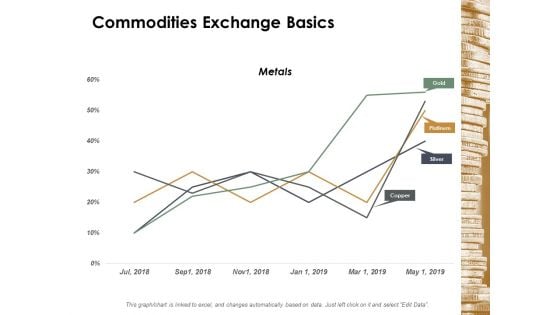
Commodities Exchange Basics Ppt Powerpoint Presentation Diagram Graph Charts
This is a commodities exchange basics ppt powerpoint presentation diagram graph charts. This is a four stage process. The stages in this process are finance, marketing, management, investment, analysis.
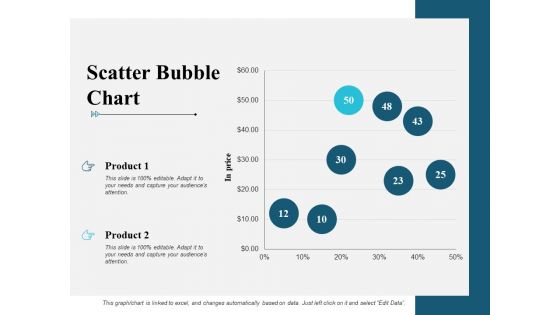
Scatter Bubble Chart Graph Ppt PowerPoint Presentation Infographic Template Maker
This is a scatter bubble chart graph ppt powerpoint presentation infographic template maker. This is a two stage process. The stages in this process are finance, marketing, management, investment, analysis.
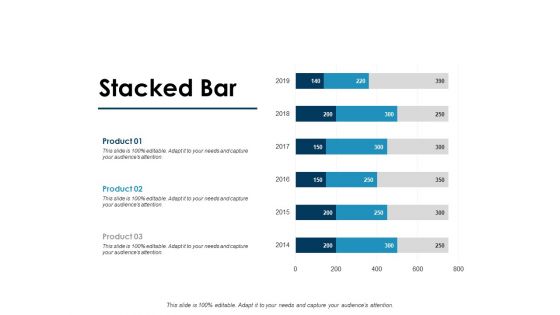
Stacked Bar Graph Ppt PowerPoint Presentation Portfolio Slide Portrait
This is a stacked bar graph ppt powerpoint presentation portfolio slide portrait. This is a three stage process. The stages in this process are finance, marketing, management, investment, analysis.
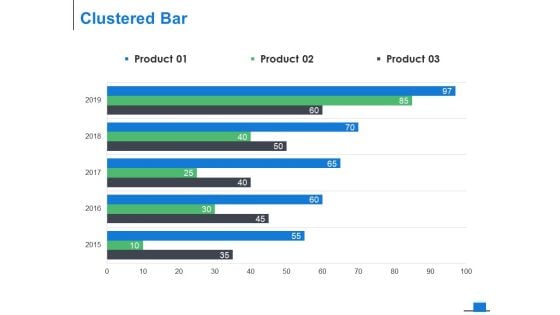
Clustered Bar Graph Ppt PowerPoint Presentation Model Background Designs
This is a clustered bar graph ppt powerpoint presentation model background designs. This is a three stage process. The stages in this process are finance, marketing, management, investment, analysis.
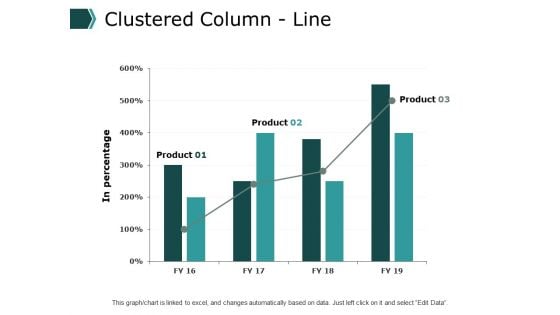
Clustered Column Line Graph Ppt PowerPoint Presentation File Clipart
This is a clustered column line graph ppt powerpoint presentation file clipart. This is a three stage process. The stages in this process are finance, marketing, management, investment, analysis.
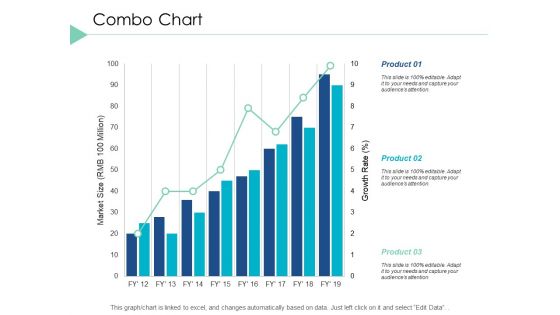
Combo Chart Graph Ppt PowerPoint Presentation Infographic Template Layout Ideas
This is a combo chart graph ppt powerpoint presentation infographic template layout ideas. This is a three stage process. The stages in this process are finance, marketing, analysis, investment, million.
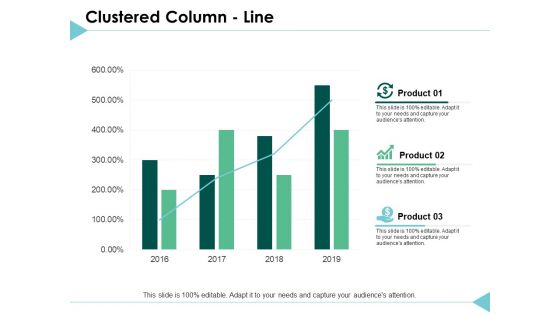
Clustered Column Line Graph Ppt PowerPoint Presentation Inspiration Deck
This is a clustered column line graph ppt powerpoint presentation inspiration deck. This is a three stage process. The stages in this process are finance, marketing, analysis, investment, million.

Donut Pie Chart Graph Ppt PowerPoint Presentation File Styles
This is a donut pie chart graph ppt powerpoint presentation file styles. This is a three stage process. The stages in this process are finance, marketing, management, investment, analysis.
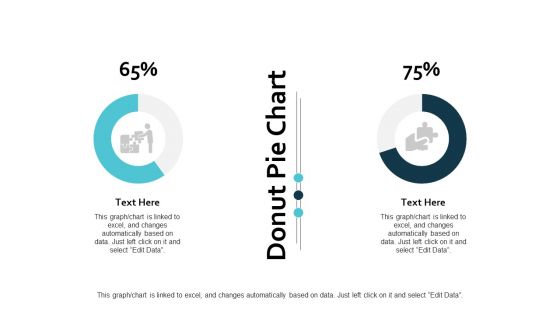
Donut Pie Chart Graph Ppt PowerPoint Presentation Ideas Guidelines
This is a donut pie chart graph ppt powerpoint presentation ideas guidelines. This is a three stage process. The stages in this process are finance, marketing, management, investment, analysis.
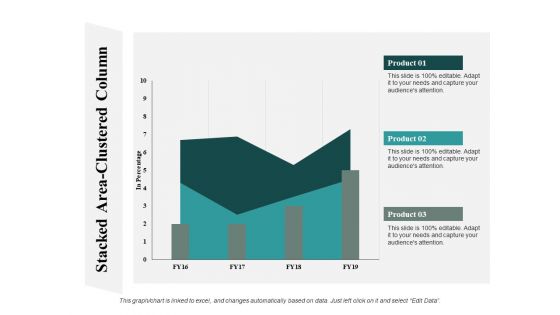
Stacked Area Clustered Column Graph Ppt PowerPoint Presentation Summary Guide
This is a stacked area clustered column graph ppt powerpoint presentation summary guide. This is a three stage process. The stages in this process are finance, marketing, analysis, investment, million.
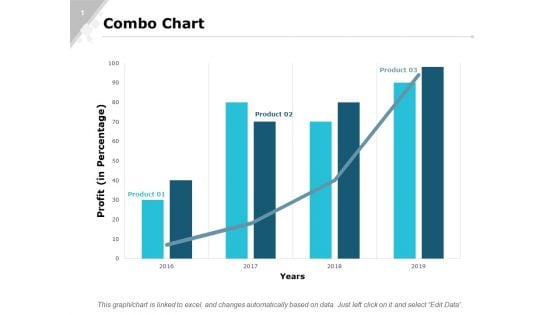
Combo Chart Graph Ppt PowerPoint Presentation Gallery Designs Download
This is a combo chart graph ppt powerpoint presentation gallery designs download. This is a three stage process. The stages in this process are finance, marketing, analysis, investment, million.
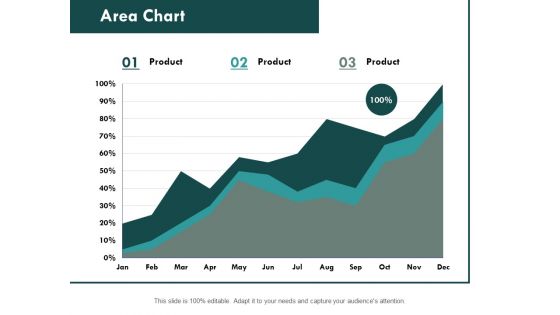
Area Chart Graph Ppt PowerPoint Presentation Professional Format Ideas
This is a column chart graph ppt powerpoint presentation slides file formats. This is a stage three process. The stages in this process are finance, marketing, analysis, investment, million.

Project Performance Bar Graph Ppt PowerPoint Presentation Outline
This is a project performance bar graph ppt powerpoint presentation outline. This is a four stage process. The stages in this process are finance, year, business, marketing, future, marketing.
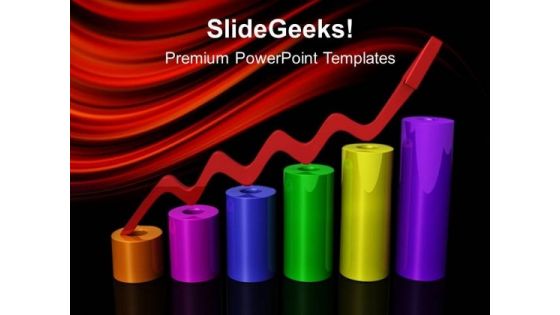
Bar Graph Business PowerPoint Templates And PowerPoint Themes 0512
Bar Graph Business PowerPoint Templates And PowerPoint Themes 0512-Microsoft Powerpoint Templates and Background with graph of business-These high quality PowerPoint templates and PowerPoint images are carefully selected by our team of professionals to convey your ideas in a visually appealing manner. Each download contains a text and print slide. The text and print slides show up automatically when you insert a new slide in the downloaded template Continue growing with our Bar Graph Business PowerPoint Templates And PowerPoint Themes 0512. Download without worries with our money back guaranteee.
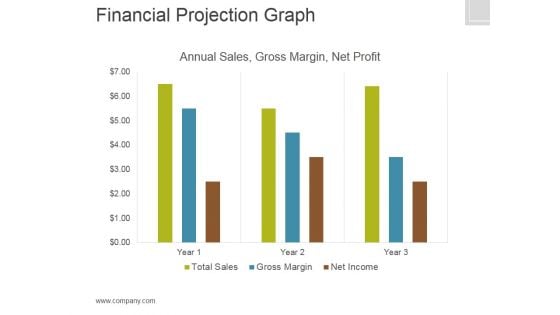
Financial Projection Graph Template 2 Ppt PowerPoint Presentation Graphics
This is a financial projection graph template 2 ppt powerpoint presentation graphics. This is a three stage process. The stages in this process are annual sales, gross margin, net profit, finance.

Stakeholders Fund And Market Analysis Bar Graph Powerpoint Slide Information
This is a stakeholders fund and market analysis bar graph powerpoint slide information. This is a five stage process. The stages in this process are shareholders funds, market capitalization, market capitalization as a percentage of cse market capitalization.
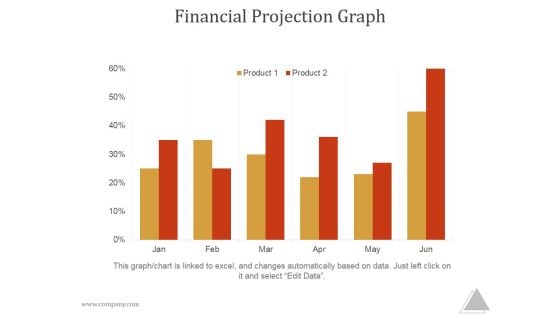
Financial Projection Graph Slide2 Ppt PowerPoint Presentation Themes
This is a financial projection graph slide2 ppt powerpoint presentation themes. This is a five stage process. The stages in this process are year, total sales, gross, margin, net income
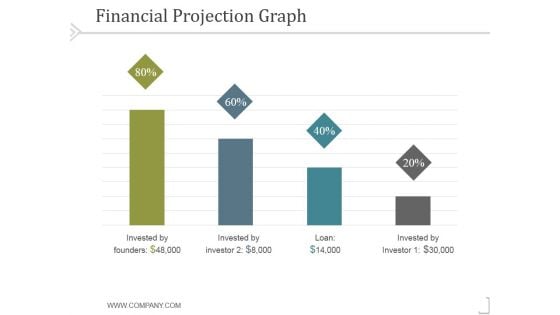
Financial Projection Graph Template 1 Ppt PowerPoint Presentation Model
This is a financial projection graph template 1 ppt powerpoint presentation model. This is a four stage process. The stages in this process are business, strategy, marketing, success, analysis.
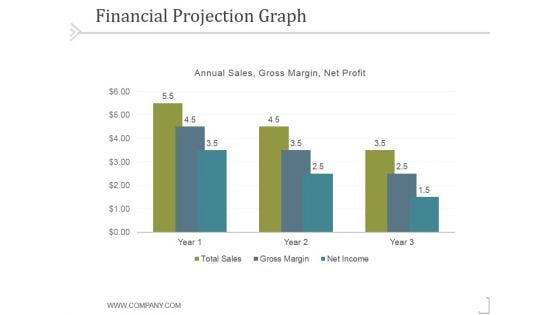
Financial Projection Graph Template 2 Ppt PowerPoint Presentation Template
This is a financial projection graph template 2 ppt powerpoint presentation template. This is a three stage process. The stages in this process are business, strategy, marketing, success, analysis.
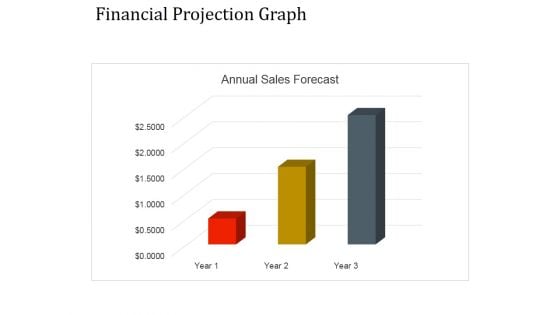
Financial Projection Graph Template 1 Ppt PowerPoint Presentation Graphics
This is a financial projection graph template 1 ppt powerpoint presentation graphics. This is a three stage process. The stages in this process are annual sales, business, management, marketing, strategy.
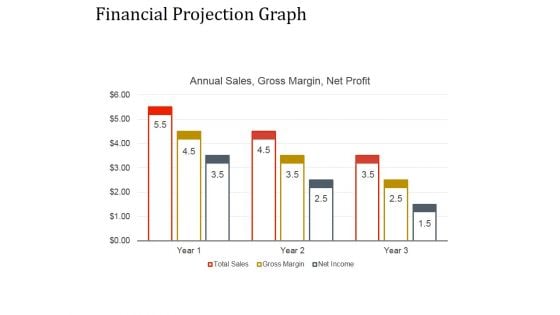
Financial Projection Graph Template 2 Ppt PowerPoint Presentation Ideas
This is a financial projection graph template 2 ppt powerpoint presentation ideas. This is a nine stage process. The stages in this process are annual sales, business, management, marketing, strategy.

Graph Showing Success Business PowerPoint Templates And PowerPoint Backgrounds 0611
Microsoft PowerPoint Template and Background with the colour schedule with a red arrow rising upwards Capture success with our Graph Showing Success Business PowerPoint Templates And PowerPoint Backgrounds 0611. Download without worries with our money back guaranteee.
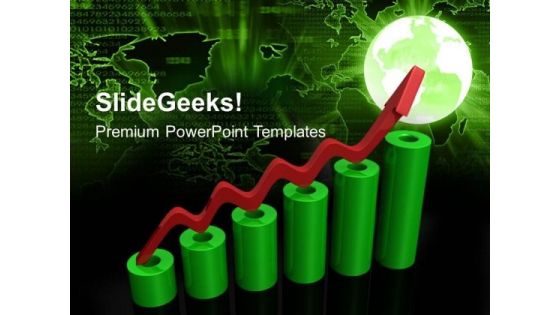
Bar Graph Success PowerPoint Templates And PowerPoint Themes 0512
Bar Graph Success PowerPoint Templates And PowerPoint Themes 0512-Microsoft Powerpoint Templates and Background with graph of business-These high quality PowerPoint templates and PowerPoint images are carefully selected by our team of professionals to convey your ideas in a visually appealing manner. Each download contains a text and print slide. The text and print slides show up automatically when you insert a new slide in the downloaded template Our Bar Graph Success PowerPoint Templates And PowerPoint Themes 0512 will blow your ideas. They will fan out across the audience.
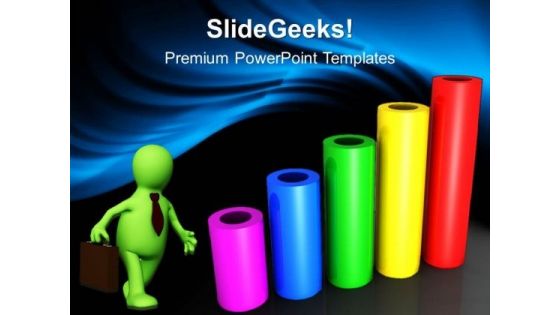
Cylinderical Bar Graph Business PowerPoint Templates And PowerPoint Themes 0512
Cylinderical Bar Graph Business PowerPoint Templates And PowerPoint Themes 0512-Microsoft Powerpoint Templates and Background with bar graph-These high quality PowerPoint templates and PowerPoint images are carefully selected by our team of professionals to convey your ideas in a visually appealing manner. Each download contains a text and print slide. The text and print slides show up automatically when you insert a new slide in the downloaded template Our Cylinderical Bar Graph Business PowerPoint Templates And PowerPoint Themes 0512 put in an earnest attempt. They put in hard hours to assist you.
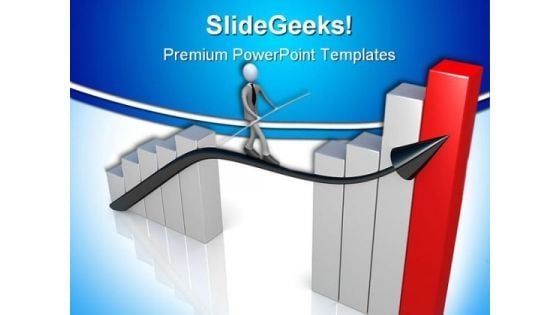
Success Graph Business PowerPoint Background And Template 1210
Microsoft PowerPoint Template and Background with Computer generated image - Success In Business Save money with our Success Graph Business PowerPoint Background And Template 1210. You will come out on top.
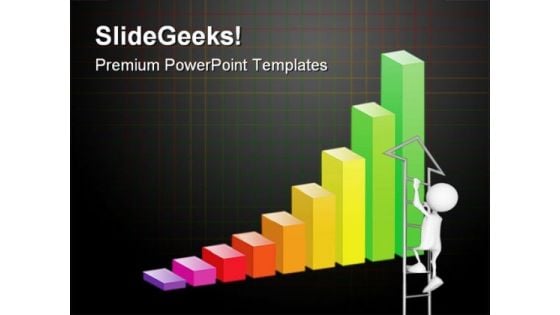
Bar Graph Business PowerPoint Backgrounds And Templates 0111

Statistics Graph Business PowerPoint Templates And PowerPoint Backgrounds 0511
Microsoft PowerPoint Template and Background with business statistics Deliver success with our Statistics Graph Business PowerPoint Templates And PowerPoint Backgrounds 0511. Download without worries with our money back guaranteee.

Business Graph Success PowerPoint Templates And PowerPoint Backgrounds 1011
Microsoft PowerPoint Template and Background with advertising of business Draft your plans with our Business Graph Success PowerPoint Templates And PowerPoint Backgrounds 1011. Download without worries with our money back guaranteee.

Business Graph Success PowerPoint Themes And PowerPoint Slides 0411
Microsoft PowerPoint Theme and Slide with green arrow moving upwards rendering 2011 Motivate teams with our Business Graph Success PowerPoint Themes And PowerPoint Slides 0411. Download without worries with our money back guaranteee.
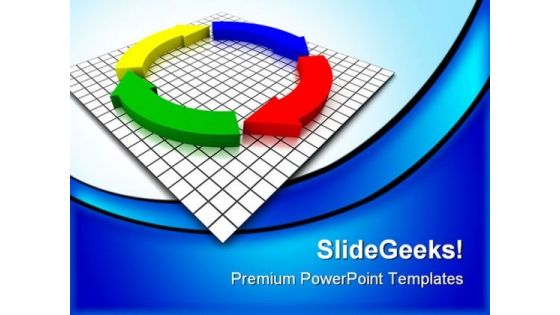
Graph With Arrows Business PowerPoint Themes And PowerPoint Slides 0411
Microsoft PowerPoint Theme and Slide with four arrows completing a circle Train your team with our Graph With Arrows Business PowerPoint Themes And PowerPoint Slides 0411. Download without worries with our money back guaranteee.

Success Graph Business PowerPoint Themes And PowerPoint Slides 0511
Microsoft PowerPoint Theme and Slide with its 3d image about is rivaly anger and superiority Lead teams with our Success Graph Business PowerPoint Themes And PowerPoint Slides 0511. Download without worries with our money back guaranteee.

Success Bar Graph Global PowerPoint Templates And PowerPoint Themes 0512
Microsoft Powerpoint Templates and Background with success Intensify growth with our Success Bar Graph Global PowerPoint Templates And PowerPoint Themes 0512. Download without worries with our money back guaranteee.
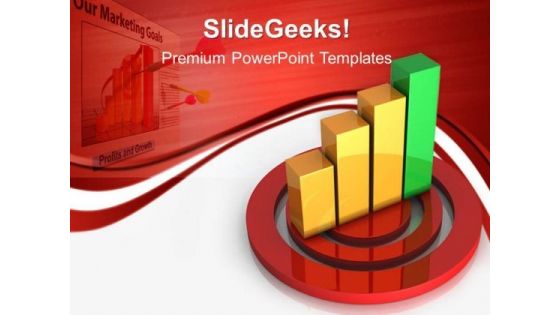
Target Bar Graph Business PowerPoint Templates And PowerPoint Themes 0512
Microsoft Powerpoint Templates and Background with achieving business targets Accelerate success with our Target Bar Graph Business PowerPoint Templates And PowerPoint Themes 0512. Download without worries with our money back guaranteee.
Harvey Ball Graph Ppt PowerPoint Presentation Complete Deck With Slides
If designing a presentation takes a lot of your time and resources and you are looking for a better alternative, then this Harvey Ball Graph Ppt PowerPoint Presentation Complete Deck With Slides is the right fit for you. This is a prefabricated set that can help you deliver a great presentation on the topic. All the Twelve slides included in this sample template can be used to present a birds eye view of the topic. These slides are also fully editable, giving you enough freedom to add specific details to make this layout more suited to your business setting. Apart from the content, all other elements like color, design, theme are also replaceable and editable. This helps in designing a variety of presentations with a single layout. Not only this, you can use this PPT design in formats like PDF, PNG, and JPG once downloaded. Therefore, without any further ado, download and utilize this sample presentation as per your liking.
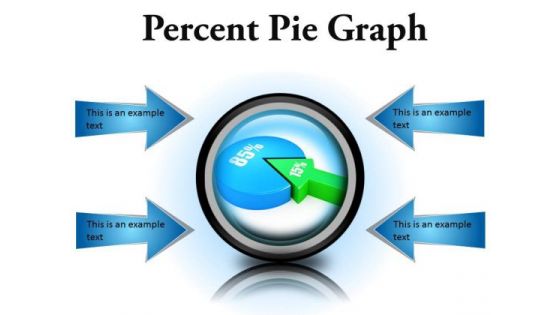
Percent Pie Graph Business PowerPoint Presentation Slides Cc
Microsoft PowerPoint Slides and Backgrounds with fifteen and eighty five percent proportion pie chart Record growth with our Percent Pie Graph Business PowerPoint Presentation Slides Cc. Download without worries with our money back guaranteee.
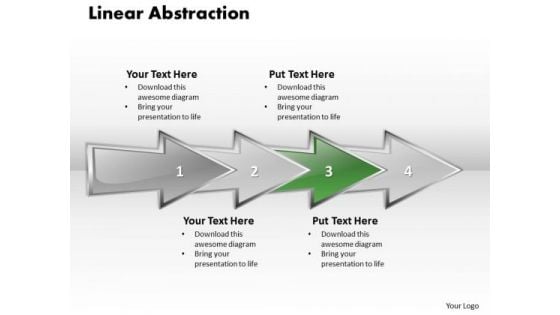
Ppt Linear Abstraction Arrow Animated Graph PowerPoint 2007 Templates
PPT linear abstraction arrow animated graph powerpoint 2007 Templates-Use this diagram to show a progression or sequential steps in a task, process, or workflow. They help to lay the base of your trend of thought and enhance the essence of your viable ideas. Create captivating presentations to deliver comparative and weighted arguments.-PPT linear abstraction arrow animated graph powerpoint 2007 Templates-analysis, arrow, background, business, chart, communication, concept, construction, delivery, design, development, engineering, fabrication, feasibiliti, generated, growth, idea, industry, making, production, products, science, sequence, shape Realign your team with our Ppt Linear Abstraction Arrow Animated Graph PowerPoint 2007 Templates. Download without worries with our money back guaranteee.
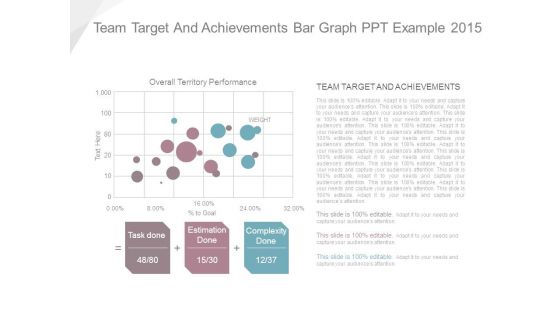
Team Target And Achievements Bar Graph Ppt Example 2015
This is a team target and achievements bar graph ppt example 2015. This is a three stage process. The stages in this process are task done, estimation done, complexity done, overall territory performance, team target and achievements.
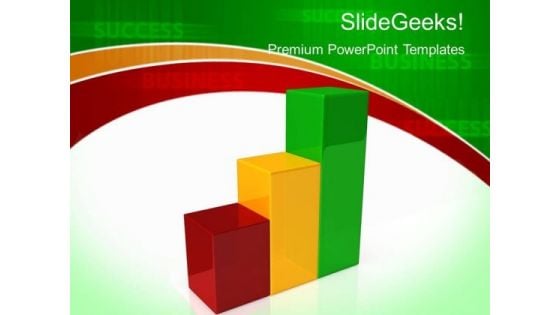
Bar Graph Business PowerPoint Templates And PowerPoint Themes 0212
Microsoft Powerpoint Templates and Background with chart from blocks Illustrate the essential elements of the project. Delve into the basic nature with our Bar Graph Business PowerPoint Templates And PowerPoint Themes 0212.

Up Graph Business PowerPoint Themes And PowerPoint Slides 0711
Microsoft PowerPoint Theme and Slide with concept of business on the rise with man who claims an arrow Our Up Graph Business PowerPoint Themes And PowerPoint Slides 0711 are not a figment of imagination. They actually help in day to day aspects.
End Stage Project Results Icon With Graph Information PDF
Persuade your audience using this end stage project results icon with graph information pdf. This PPT design covers three stages, thus making it a great tool to use. It also caters to a variety of topics including end stage project results icon with graph. Download this PPT design now to present a convincing pitch that not only emphasizes the topic but also showcases your presentation skills.
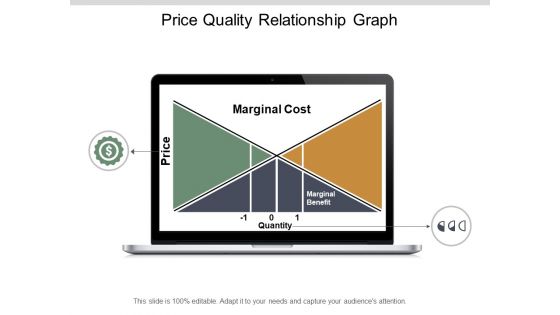
Price Quality Relationship Graph Ppt PowerPoint Presentation Show Design Templates
This is a price quality relationship graph ppt powerpoint presentation show design templates. This is a two stage process. The stages in this process are cost benefit analysis, cost benefit investigation, cost benefit examination.


 Continue with Email

 Home
Home


