Business Analytics Dashboard Diagram
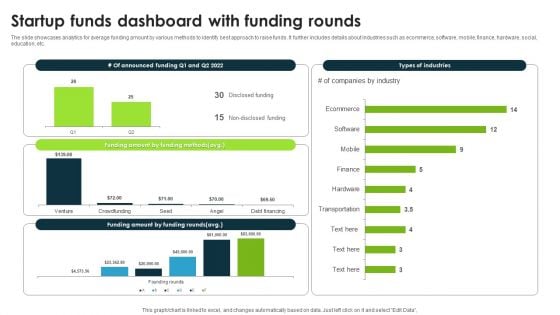
Startup Funds Dashboard With Funding Rounds Summary PDF
The slide showcases analytics for average funding amount by various methods to identify best approach to raise funds. It further includes details about industries such as ecommerce, software, mobile, finance, hardware, social, education, etc. Pitch your topic with ease and precision using this Startup Funds Dashboard With Funding Rounds Summary PDF. This layout presents information on Funding Methods, Industry, Ecommerce. It is also available for immediate download and adjustment. So, changes can be made in the color, design, graphics or any other component to create a unique layout.
Human Augmented Machine Learning IT Augmented Intelligence Information Tracking Dashboard Diagrams PDF
This slide depicts the information tracking dashboard by augmented intelligence model covering the data analysis. Data analysis includes image analysis, storage size, new users on the cloud platform, etc. Get a simple yet stunning designed Human Augmented Machine Learning IT Augmented Intelligence Information Tracking Dashboard Diagrams PDF. It is the best one to establish the tone in your meetings. It is an excellent way to make your presentations highly effective. So, download this PPT today from Slidegeeks and see the positive impacts. Our easy-to-edit Human Augmented Machine Learning IT Augmented Intelligence Information Tracking Dashboard Diagrams PDF can be your go-to option for all upcoming conferences and meetings. So, what are you waiting for. Grab this template today.
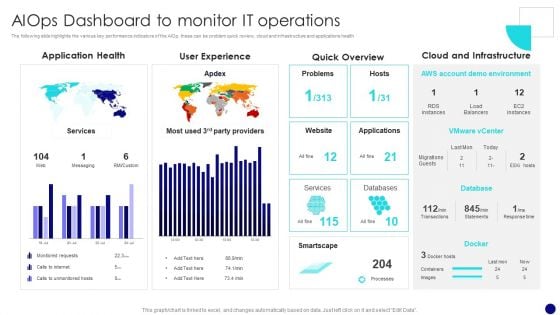
Information Technology Operations Administration With ML Aiops Dashboard To Monitor Diagrams PDF
The following slide highlights the various key performance indicators of the AIOp, these can be problem quick review, cloud and infrastructure and applications health. If you are looking for a format to display your unique thoughts, then the professionally designed Information Technology Operations Administration With ML Aiops Dashboard To Monitor Diagrams PDF is the one for you. You can use it as a Google Slides template or a PowerPoint template. Incorporate impressive visuals, symbols, images, and other charts. Modify or reorganize the text boxes as you desire. Experiment with shade schemes and font pairings. Alter, share or cooperate with other people on your work. Download Information Technology Operations Administration With ML Aiops Dashboard To Monitor Diagrams PDF and find out how to give a successful presentation. Present a perfect display to your team and make your presentation unforgettable.

Operational Strategy For ML In IT Sector Aiops Dashboard To Monitor IT Operations Diagrams PDF
The following slide highlights the various key performance indicators of the AIOps, these can be problem quick review, cloud and infrastructure and applications health If you are looking for a format to display your unique thoughts, then the professionally designed Operational Strategy For ML In IT Sector Aiops Dashboard To Monitor IT Operations Diagrams PDF is the one for you. You can use it as a Google Slides template or a PowerPoint template. Incorporate impressive visuals, symbols, images, and other charts. Modify or reorganize the text boxes as you desire. Experiment with shade schemes and font pairings. Alter, share or cooperate with other people on your work. Download Operational Strategy For ML In IT Sector Aiops Dashboard To Monitor IT Operations Diagrams PDF and find out how to give a successful presentation. Present a perfect display to your team and make your presentation unforgettable.
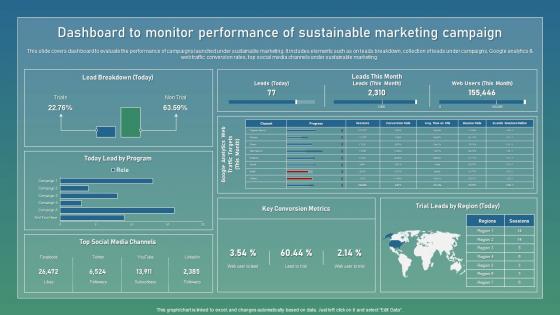
Dashboard To Monitor Performance Strategic Guide For Sustainable Download Pdf
This slide covers dashboard to evaluate the performance of campaigns launched under sustainable marketing. It includes elements such as on leads breakdown, collection of leads under campaigns, Google analytics and web traffic conversion rates, top social media channels under sustainable marketing. Whether you have daily or monthly meetings, a brilliant presentation is necessary. Dashboard To Monitor Performance Strategic Guide For Sustainable Download Pdf can be your best option for delivering a presentation. Represent everything in detail using Dashboard To Monitor Performance Strategic Guide For Sustainable Download Pdf and make yourself stand out in meetings. The template is versatile and follows a structure that will cater to your requirements. All the templates prepared by Slidegeeks are easy to download and edit. Our research experts have taken care of the corporate themes as well. So, give it a try and see the results. This slide covers dashboard to evaluate the performance of campaigns launched under sustainable marketing. It includes elements such as on leads breakdown, collection of leads under campaigns, Google analytics and web traffic conversion rates, top social media channels under sustainable marketing.
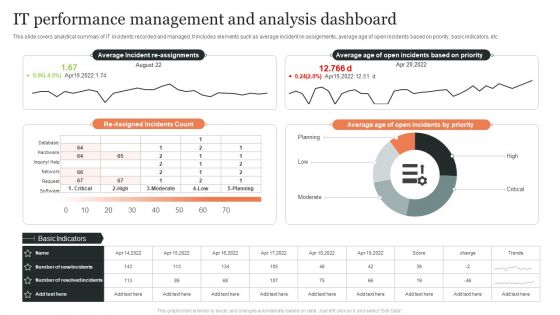
IT Performance Management And Analysis Dashboard Ppt Styles Portrait PDF
This slide covers analytical summary of IT incidents recorded and managed. It includes elements such as average incident re-assignments, average age of open incidents based on priority, basic indicators, etc. Showcasing this set of slides titled IT Performance Management And Analysis Dashboard Ppt Styles Portrait PDF. The topics addressed in these templates are Average Age, Open Incidents Priority, Re Assigned, Incidents Count. All the content presented in this PPT design is completely editable. Download it and make adjustments in color, background, font etc. as per your unique business setting.
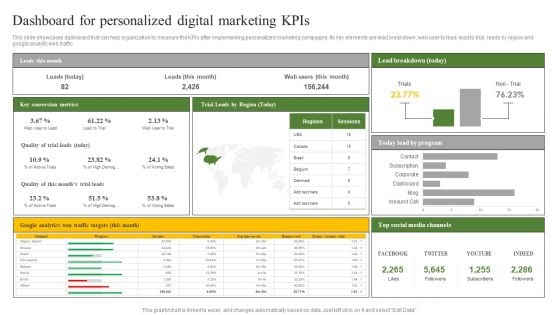
Dashboard For Personalized Digital Marketing Kpis Ppt Background Designs PDF
This slide showcases dashboard that can help organization to measure the KPIs after implementing personalized marketing campaigns. Its key elements are lead breakdown, web user to lead, lead to trial, leads by region and google analytic web traffic. Presenting this PowerPoint presentation, titled Dashboard For Personalized Digital Marketing Kpis Ppt Background Designs PDF, with topics curated by our researchers after extensive research. This editable presentation is available for immediate download and provides attractive features when used. Download now and captivate your audience. Presenting this Dashboard For Personalized Digital Marketing Kpis Ppt Background Designs PDF. Our researchers have carefully researched and created these slides with all aspects taken into consideration. This is a completely customizable Dashboard For Personalized Digital Marketing Kpis Ppt Background Designs PDF that is available for immediate downloading. Download now and make an impact on your audience. Highlight the attractive features available with our PPTs.
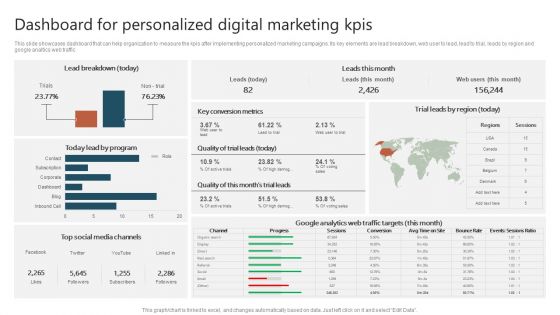
Dashboard For Personalized Digital Marketing Kpis Ppt File Layouts PDF
This slide showcases dashboard that can help organization to measure the KPIs after implementing personalized marketing campaigns. Its key elements are lead breakdown, web user to lead, lead to trial, leads by region and google analytic web traffic. Presenting this PowerPoint presentation, titled Dashboard For Personalized Digital Marketing Kpis Ppt File Layouts PDF, with topics curated by our researchers after extensive research. This editable presentation is available for immediate download and provides attractive features when used. Download now and captivate your audience. Presenting this Dashboard For Personalized Digital Marketing Kpis Ppt File Layouts PDF. Our researchers have carefully researched and created these slides with all aspects taken into consideration. This is a completely customizable Dashboard For Personalized Digital Marketing Kpis Ppt File Layouts PDF that is available for immediate downloading. Download now and make an impact on your audience. Highlight the attractive features available with our PPTs.
Evolving BI Infrastructure Tracking Intelligence Infrastructure Activities Dashboard Demonstration PDF
This slide portrays information regarding tracking essential activities in intelligence infrastructure dashboard in terms of IT operations, security, business analytics, internet of things, etc. Deliver an awe inspiring pitch with this creative evolving bi infrastructure tracking intelligence infrastructure activities dashboard demonstration pdf bundle. Topics like application delivery, business analytics, internet of things, it operations, security can be discussed with this completely editable template. It is available for immediate download depending on the needs and requirements of the user.
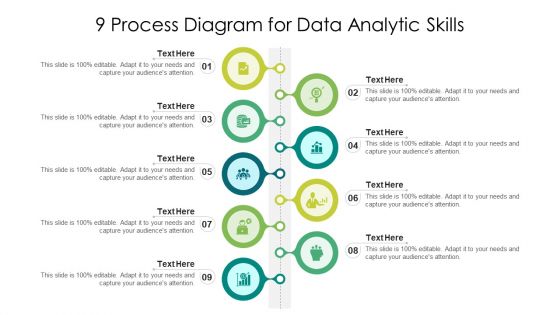
9 Process Diagram For Data Analytic Skills Ppt PowerPoint Presentation Ideas PDF
Persuade your audience using this 9 process diagram for data analytic skills ppt powerpoint presentation ideas pdf. This PPT design covers nine stages, thus making it a great tool to use. It also caters to a variety of topics including 9 process diagram for data analytic skills. Download this PPT design now to present a convincing pitch that not only emphasizes the topic but also showcases your presentation skills.
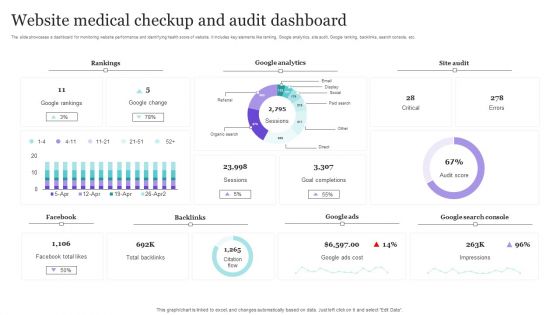
Website Medical Checkup And Audit Dashboard Background PDF
The slide showcases a dashboard for monitoring website performance and identifying health score of website. It includes key elements like ranking, Google analytics, site audit, Google ranking, backlinks, search console, etc. Showcasing this set of slides titled Website Medical Checkup And Audit Dashboard Background PDF. The topics addressed in these templates are Rankings, Google Analytics, Site Audit. All the content presented in this PPT design is completely editable. Download it and make adjustments in color, background, font etc. as per your unique business setting.
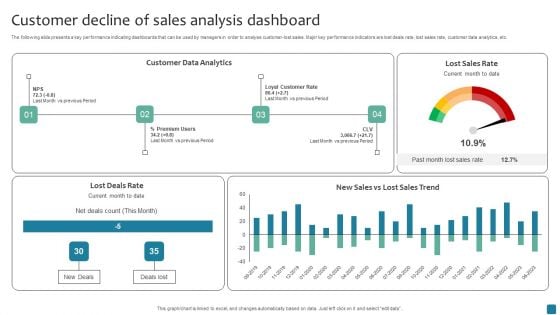
Customer Decline Of Sales Analysis Dashboard Rules PDF
The following slide presents a key performance indicating dashboards that can be used by managers in order to analyse customer-lost sales. Major key performance indicators are lost deals rate, lost sales rate, customer data analytics, etc. Pitch your topic with ease and precision using this Customer Decline Of Sales Analysis Dashboard Rules PDF. This layout presents information on Customer Data Analytics. It is also available for immediate download and adjustment. So, changes can be made in the color, design, graphics or any other component to create a unique layout.

Dashboard For Web Development Project Performance Microsoft PDF
This slide depicts the dashboard for the web development, and it covers the details of yearly turnover, clients information, and revenues, analytics, and statistics of the organization.Deliver an awe inspiring pitch with this creative Dashboard For Web Development Project Performance Microsoft PDF bundle. Topics like Dashboard For Web Development Project Performance can be discussed with this completely editable template. It is available for immediate download depending on the needs and requirements of the user.
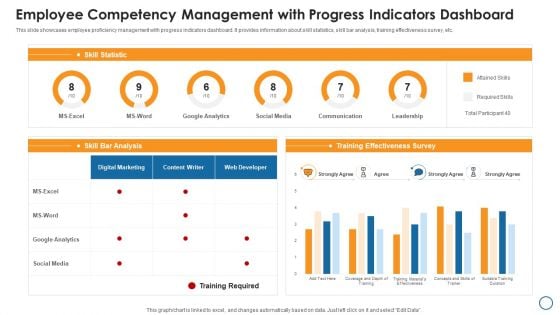
Employee Competency Management With Progress Indicators Dashboard Graphics PDF
This slide showcases employee proficiency management with progress indicators dashboard. It provides information about skill statistics, skill bar analysis, training effectiveness survey, etc. Showcasing this set of slides titled employee competency management with progress indicators dashboard graphics pdf. The topics addressed in these templates are google analytics, social media, survey. All the content presented in this PPT design is completely editable. Download it and make adjustments in color, background, font etc. as per your unique business setting.
Intelligent Infrastructure Tracking Intelligence Infrastructure Activities Dashboard Template PDF
This slide portrays information regarding tracking essential activities in intelligence infrastructure dashboard in terms of IT operations, security, business analytics, internet of things, etc. Deliver and pitch your topic in the best possible manner with this Intelligent Infrastructure Tracking Intelligence Infrastructure Activities Dashboard Template PDF. Use them to share invaluable insights on Application Delivery, IT Operations, Authentication and impress your audience. This template can be altered and modified as per your expectations. So, grab it now.
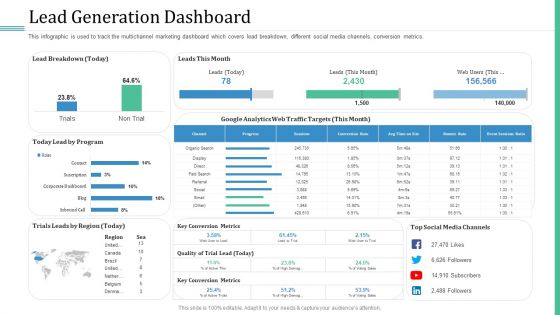
Alternative Distribution Advertising Platform Lead Generation Dashboard Sample PDF
This infographic is used to track the multichannel marketing dashboard which covers lead breakdown, different social media channels, conversion metrics. Deliver and pitch your topic in the best possible manner with this alternative distribution advertising platform lead generation dashboard sample pdf. Use them to share invaluable insights on metrics, traffic, targets, analytics, media channels and impress your audience. This template can be altered and modified as per your expectations. So, grab it now.
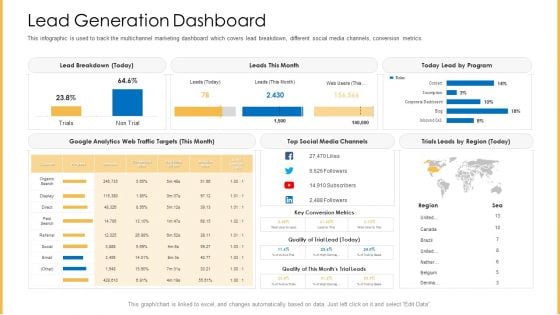
Amalgamation Marketing Pitch Deck Lead Generation Dashboard Professional PDF
This infographic is used to track the multichannel marketing dashboard which covers lead breakdown, different social media channels, conversion metrics. Deliver and pitch your topic in the best possible manner with this amalgamation marketing pitch deck lead generation dashboard professional pdf. Use them to share invaluable insights on metrics, traffic, targets, analytics, media channels and impress your audience. This template can be altered and modified as per your expectations. So, grab it now.
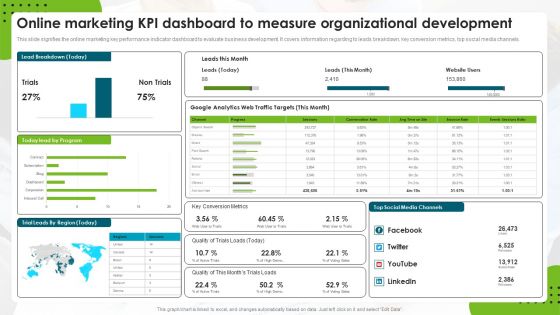
Online Marketing Kpi Dashboard To Measure Organizational Development Rules PDF
This slide signifies the online marketing key performance indicator dashboard to evaluate business development. It covers information regarding to leads breakdown, key conversion metrics, top social media channels. Pitch your topic with ease and precision using this Online Marketing Kpi Dashboard To Measure Organizational Development Rules PDF. This layout presents information on Web Traffic Targets, Google Analytics, Social Media Channels. It is also available for immediate download and adjustment. So, changes can be made in the color, design, graphics or any other component to create a unique layout.
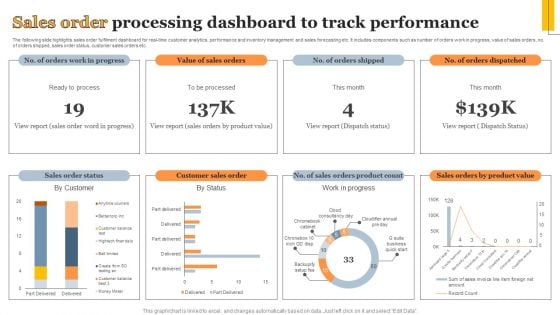
Sales Order Processing Dashboard To Track Performance Information PDF
The following slide highlights sales order fulfilment dashboard for real-time customer analytics, performance and inventory management and sales forecasting etc. It includes components such as number of orders work in progress, value of sales orders, no. of orders shipped, sales order status, customer sales orders etc. Showcasing this set of slides titled Sales Order Processing Dashboard To Track Performance Information PDF. The topics addressed in these templates are Sales Order Status, Customer Sales Order, Work Progress. All the content presented in this PPT design is completely editable. Download it and make adjustments in color, background, font etc. as per your unique business setting.
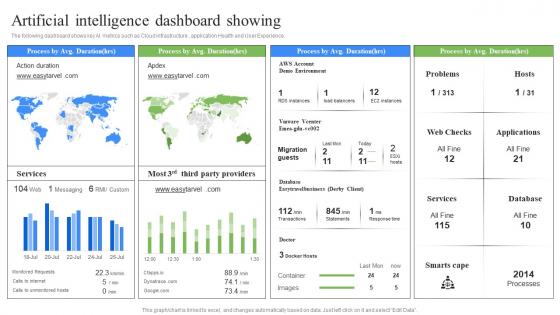
Artificial Intelligence Dashboard Showing RPA Influence On Industries Slides Pdf
The following dashboard shows key AI metrics such as Cloud infrastructure , application Health and User Experience. Create an editable Artificial Intelligence Dashboard Showing RPA Influence On Industries Slides Pdf that communicates your idea and engages your audience. Whether you are presenting a business or an educational presentation, pre-designed presentation templates help save time. Artificial Intelligence Dashboard Showing RPA Influence On Industries Slides Pdf is highly customizable and very easy to edit, covering many different styles from creative to business presentations. Slidegeeks has creative team members who have crafted amazing templates. So, go and get them without any delay. The following dashboard shows key AI metrics such as Cloud infrastructure , application Health and User Experience.
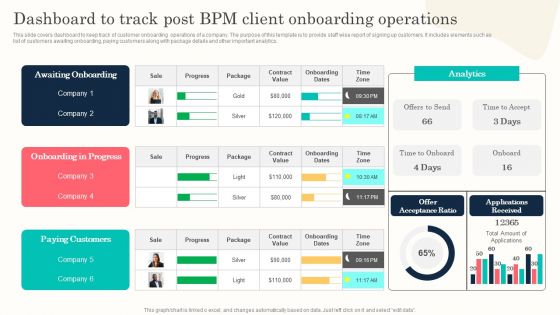
Dashboard To Track Post BPM Client Onboarding Operations Professional PDF
This slide covers dashboard to keep track of customer onboarding operations of a company. The purpose of this template is to provide staff wise report of signing up customers. It includes elements such as list of customers awaiting onboarding, paying customers along with package details and other important analytics. Do you have to make sure that everyone on your team knows about any specific topic I yes, then you should give Dashboard To Track Post BPM Client Onboarding Operations Professional PDF a try. Our experts have put a lot of knowledge and effort into creating this impeccable Dashboard To Track Post BPM Client Onboarding Operations Professional PDF. You can use this template for your upcoming presentations, as the slides are perfect to represent even the tiniest detail. You can download these templates from the Slidegeeks website and these are easy to edit. So grab these today.
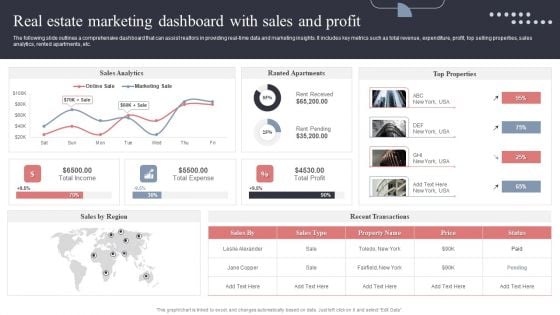
Real Estate Marketing Dashboard With Sales And Profit Formats PDF
The following slide outlines a comprehensive dashboard that can assist realtors in providing real-time data and marketing insights. It includes key metrics such as total revenue, expenditure, profit, top selling properties, sales analytics, rented apartments, etc. This modern and well-arranged Real Estate Marketing Dashboard With Sales And Profit Formats PDF provides lots of creative possibilities. It is very simple to customize and edit with the Powerpoint Software. Just drag and drop your pictures into the shapes. All facets of this template can be edited with Powerpoint, no extra software is necessary. Add your own material, put your images in the places assigned for them, adjust the colors, and then you can show your slides to the world, with an animated slide included.
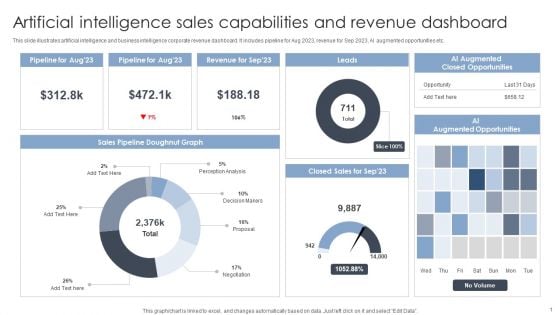
Artificial Intelligence Sales Capabilities And Revenue Dashboard Portrait PDF
This slide illustrates artificial intelligence and business intelligence corporate revenue dashboard. It includes pipeline for Aug 2023, revenue for Sep 2023, AI augmented opportunities etc. Pitch your topic with ease and precision using this Artificial Intelligence Sales Capabilities And Revenue Dashboard Portrait PDF. This layout presents information on Sales Capabilities, Revenue Dashboard. It is also available for immediate download and adjustment. So, changes can be made in the color, design, graphics or any other component to create a unique layout.
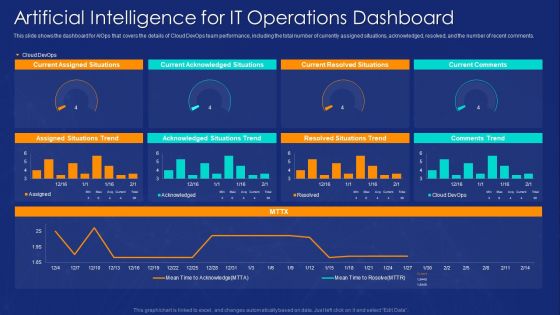
AIOPS Implementation Artificial Intelligence For IT Operations Dashboard Brochure PDF
This slide shows the dashboard for AIOps that covers the details of Cloud DevOps team performance, including the total number of currently assigned situations, acknowledged, resolved, and the number of recent comments. Deliver an awe inspiring pitch with this creative AIOPS Implementation Artificial Intelligence For IT Operations Dashboard Brochure PDF bundle. Topics like Current Assigned Situations. Current Acknowledged Situations, Current Resolved Situations can be discussed with this completely editable template. It is available for immediate download depending on the needs and requirements of the user.
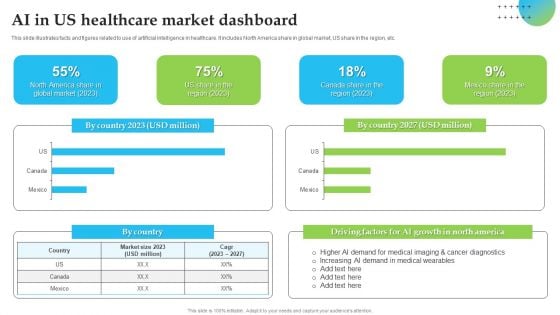
AI In US Healthcare Market Dashboard Brochure PDF
This slide illustrates facts and figures related to use of artificial intelligence in healthcare. It includes North America share in global market, US share in the region, etc. Pitch your topic with ease and precision using this AI In US Healthcare Market Dashboard Brochure PDF. This layout presents information on Driving Factors, AI Growth, Market Dashboard. It is also available for immediate download and adjustment. So, changes can be made in the color, design, graphics or any other component to create a unique layout.
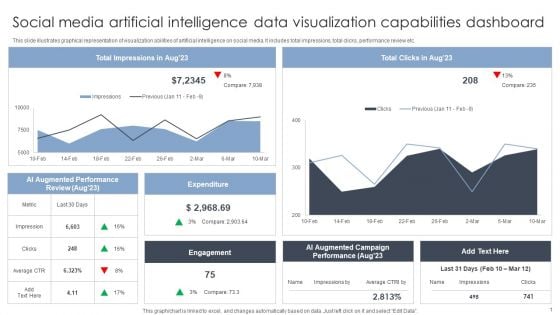
Social Media Artificial Intelligence Data Visualization Capabilities Dashboard Inspiration PDF
This slide illustrates graphical representation of visualization abilities of artificial intelligence on social media. It includes total impressions, total clicks, performance review etc. Pitch your topic with ease and precision using this Social Media Artificial Intelligence Data Visualization Capabilities Dashboard Inspiration PDF. This layout presents information on Artificial Intelligence, Data Visualization Capabilities. It is also available for immediate download and adjustment. So, changes can be made in the color, design, graphics or any other component to create a unique layout.
Administered Data And Analytic Quality Playbook How To Fix The Business Intelligence Problem Icons PDF
This template covers the solution for BI problems such as analytics transformation and business intelligence program. It also depicts that switching to next-generation analytics platform that gives business users data driven insights.This is a Administered Data And Analytic Quality Playbook How To Fix The Business Intelligence Problem Icons PDF template with various stages. Focus and dispense information on six stages using this creative set, that comes with editable features. It contains large content boxes to add your information on topics like Driven Analytics, Automated Discovery, Bridging Business You can also showcase facts, figures, and other relevant content using this PPT layout. Grab it now.
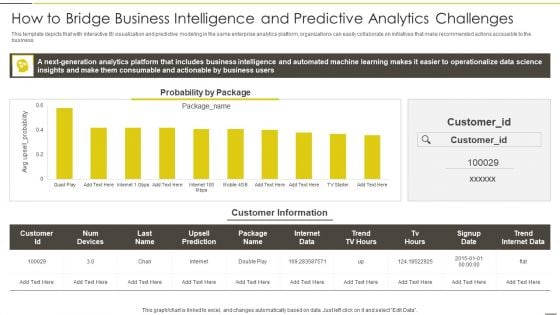
Administered Data And Analytic Quality Playbook How To Bridge Business Intelligence Sample PDF
This template depicts that with interactive BI visualization and predictive modeling in the same enterprise analytics platform, organizations can easily collaborate on initiatives that make recommended actions accessible to the business.Deliver an awe inspiring pitch with this creative Administered Data And Analytic Quality Playbook How To Bridge Business Intelligence Sample PDF bundle. Topics like Generation Analytics, Consumable Actionable, Operationalize Science can be discussed with this completely editable template. It is available for immediate download depending on the needs and requirements of the user.
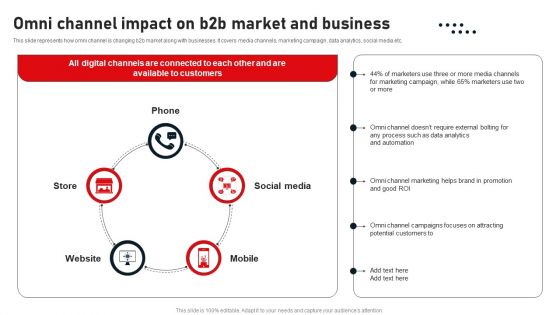
Business To Business Digital Channel Management Omni Channel Impact On B2B Market And Business Diagrams PDF
This slide represents how omni channel is changing b2b market along with businesses. It covers media channels, marketing campaign, data analytics, social media etc. Find highly impressive Business To Business Digital Channel Management Omni Channel Impact On B2B Market And Business Diagrams PDF on Slidegeeks to deliver a meaningful presentation. You can save an ample amount of time using these presentation templates. No need to worry to prepare everything from scratch because Slidegeeks experts have already done a huge research and work for you. You need to download Business To Business Digital Channel Management Omni Channel Impact On B2B Market And Business Diagrams PDF for your upcoming presentation. All the presentation templates are 100 percent editable and you can change the color and personalize the content accordingly. Download now.
Big Data Analysis Icon Data Analytic Business Ppt PowerPoint Presentation Complete Deck
Presenting this set of slides with name big data analysis icon data analytic business ppt powerpoint presentation complete deck. The topics discussed in these slides are data analytic, business, growth, gear, magnifying glass. This is a completely editable PowerPoint presentation and is available for immediate download. Download now and impress your audience.
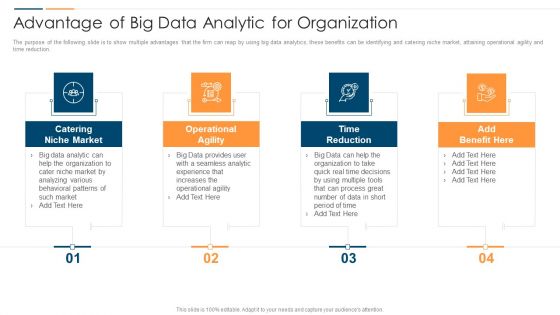
Revolution In Online Business Advantage Of Big Data Analytic For Organization Graphics PDF
The purpose of the following slide is to show multiple advantages that the firm can reap by using big data analytics, these benefits can be identifying and catering niche market, attaining operational agility and time reduction. This is a Revolution In Online Business Advantage Of Big Data Analytic For Organization Graphics PDF template with various stages. Focus and dispense information on four stages using this creative set, that comes with editable features. It contains large content boxes to add your information on topics like Catering Niche Market, Operational Agility Provides, Time Reduction Benefit. You can also showcase facts, figures, and other relevant content using this PPT layout. Grab it now.
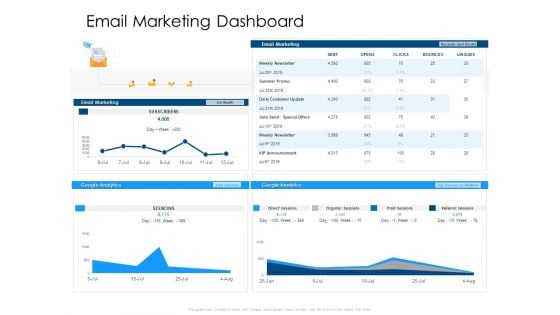
Developing Implementing Organization Marketing Promotional Strategies Email Marketing Dashboard Infographics PDF
Deliver and pitch your topic in the best possible manner with this developing implementing organization marketing promotional strategies email marketing dashboard infographics pdf. Use them to share invaluable insights on email marketing, google analytics and impress your audience. This template can be altered and modified as per your expectations. So, grab it now.
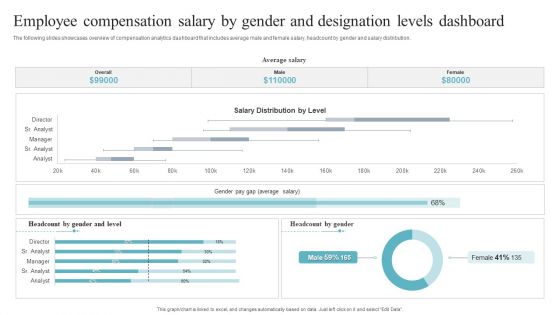
Employee Compensation Salary By Gender And Designation Levels Dashboard Portrait PDF
The following slides showcases overview of compensation analytics dashboard that includes average male and female salary, headcount by gender and salary distribution. Pitch your topic with ease and precision using this Employee Compensation Salary By Gender And Designation Levels Dashboard Portrait PDF. This layout presents information on Employee Compensation Salary, Designation Levels Dashboard. It is also available for immediate download and adjustment. So, changes can be made in the color, design, graphics or any other component to create a unique layout.
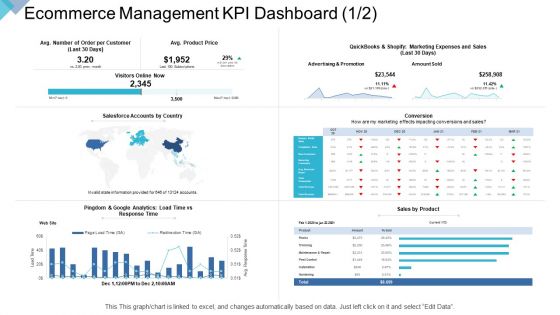
Digital Enterprise Management Ecommerce Management KPI Dashboard Ppt PowerPoint Presentation Outline Clipart PDF
Deliver and pitch your topic in the best possible manner with this digital enterprise management ecommerce management kpi dashboard ppt powerpoint presentation outline clipart pdf. Use them to share invaluable insights on avg product price, advertising and promotion, sales by product, pingdom and google analytics load time vs response time, visitors online now and impress your audience. This template can be altered and modified as per your expectations. So, grab it now.
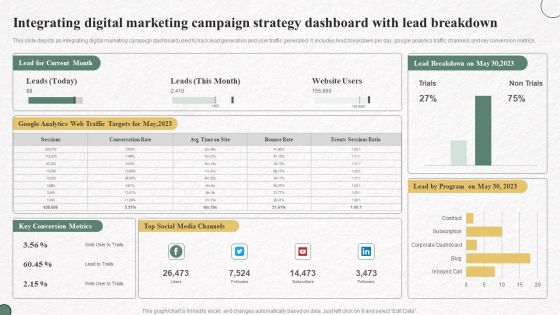
Integrating Digital Marketing Campaign Strategy Dashboard With Lead Breakdown Slides PDF
This slide depicts an integrating digital marketing campaign dashboard used to track lead generation and user traffic generated. It includes lead breakdown per day, google analytics traffic channels and key conversion metrics. Showcasing this set of slides titled Integrating Digital Marketing Campaign Strategy Dashboard With Lead Breakdown Slides PDF. The topics addressed in these templates are Lead Current Month, Website Users, Top Social Media Channels. All the content presented in this PPT design is completely editable. Download it and make adjustments in color, background, font etc. as per your unique business setting.
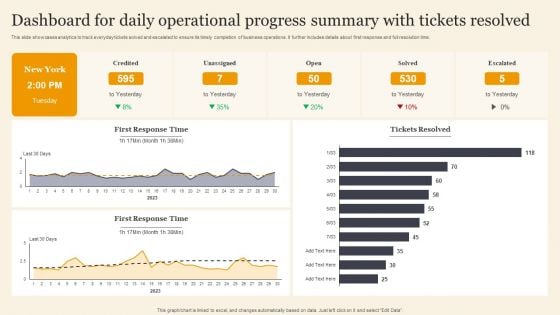
Dashboard For Daily Operational Progress Summary With Tickets Resolved Background PDF
This slide showcases analytics to track everyday tickets solved and escalated to ensure its timely completion of business operations. It further includes details about first response and full resolution time. Pitch your topic with ease and precision using this Dashboard For Daily Operational Progress Summary With Tickets Resolved Background PDF. This layout presents information on Dashboard For Daily Operational, Progress Summary, Tickets Resolved. It is also available for immediate download and adjustment. So, changes can be made in the color, design, graphics or any other component to create a unique layout.
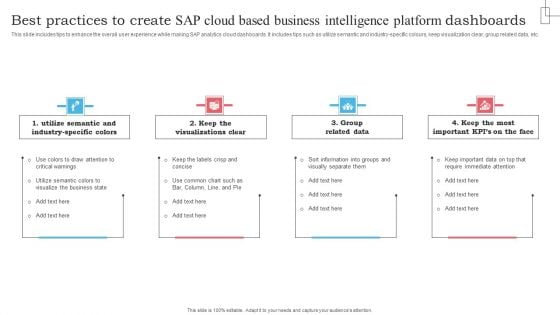
Best Practices To Create SAP Cloud Based Business Intelligence Platform Dashboards Summary PDF
This slide includes tips to enhance the overall user experience while making SAP analytics cloud dashboards. It includes tips such as utilize semantic and industry-specific colours, keep visualization clear, group related data, etc. Presenting Best Practices To Create SAP Cloud Based Business Intelligence Platform Dashboards Summary PDF to dispense important information. This template comprises four stages. It also presents valuable insights into the topics including Utilize Semantic Industry Specific, Keep Visualizations Clear, Group Related Data. This is a completely customizable PowerPoint theme that can be put to use immediately. So, download it and address the topic impactfully.
Optimizing AI Strategies To Improve Financial Services Digital Media Tracking Dashboard Professional PDF
This slide covers the digital marketing dashboard along with the lead breakdown, google analytics traffic, and social media channels. Do you know about Slidesgeeks Optimizing AI Strategies To Improve Financial Services Digital Media Tracking Dashboard Professional PDF These are perfect for delivering any kind od presentation. Using it, create PowerPoint presentations that communicate your ideas and engage audiences. Save time and effort by using our pre designed presentation templates that are perfect for a wide range of topic. Our vast selection of designs covers a range of styles, from creative to business, and are all highly customizable and easy to edit. Download as a PowerPoint template or use them as Google Slides themes.
Forecast Analysis Technique IT Predictive Modeling Model Performance Tracking Dashboard Brochure PDF
This slide represents the predictive analytics model performance tracking dashboard, and it covers the details of total visitors, total buyers, total products added to the cart, filters by date and category, visitors to clients conversion rate, and so on. There are so many reasons you need a Forecast Analysis Technique IT Predictive Modeling Model Performance Tracking Dashboard Brochure PDF. The first reason is you can not spend time making everything from scratch, Thus, Slidegeeks has made presentation templates for you too. You can easily download these templates from our website easily.
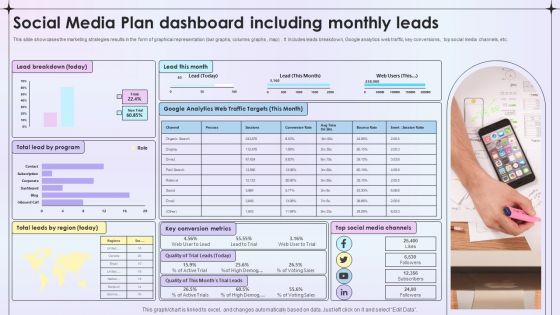
Social Media Plan Dashboard Including Monthly Leads Ppt File Slides PDF
This slide showcases the marketing strategies results in the form of graphical representation bar graphs, columns graphs , map. It includes leads breakdown, Google analytics web traffic, key conversions , top social media channels, etc. Showcasing this set of slides titled Social Media Plan Dashboard Including Monthly Leads Ppt File Slides PDF. The topics addressed in these templates are Lead Breakdown, Key Conversion Metrics, Social Media Channels. All the content presented in this PPT design is completely editable. Download it and make adjustments in color, background, font etc. as per your unique business setting.
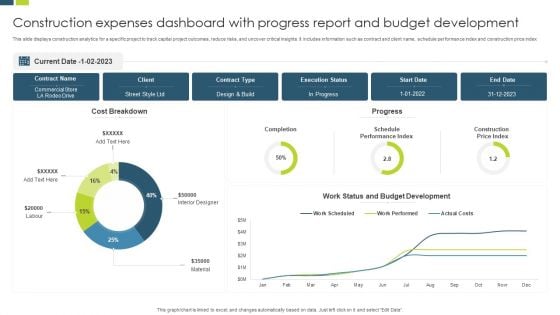
Construction Expenses Dashboard With Progress Report And Budget Development Background PDF
This slide displays construction analytics for a specific project to track capital project outcomes, reduce risks, and uncover critical insights. It includes information such as contract and client name, schedule performance index and construction price index. Showcasing this set of slides titled Construction Expenses Dashboard With Progress Report And Budget Development Background PDF. The topics addressed in these templates are Budget Development, Execution Status, Commercial Store. All the content presented in this PPT design is completely editable. Download it and make adjustments in color, background, font etc. as per your unique business setting.
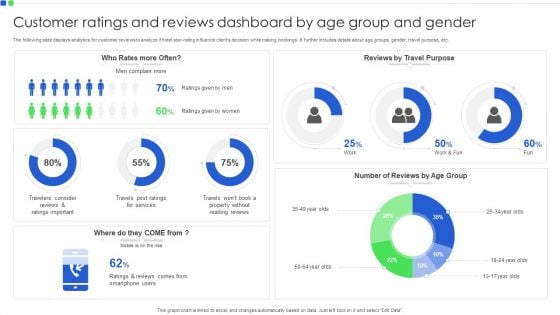
Customer Ratings And Reviews Dashboard By Age Group And Gender Introduction PDF
The following slide displays analytics for customer reviews to analyze if hotel star rating influence clients decision while making bookings. It further includes details about age groups, gender, travel purpose, etc. Pitch your topic with ease and precision using this Customer Ratings And Reviews Dashboard By Age Group And Gender Introduction PDF. This layout presents information on Customer Ratings And Reviews, Age Group And Gender. It is also available for immediate download and adjustment. So, changes can be made in the color, design, graphics or any other component to create a unique layout.
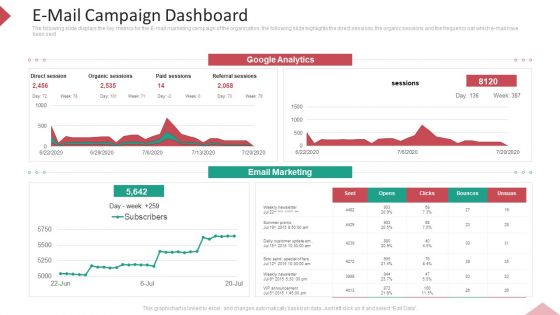
Inbound Interruption Commerce Promotion Practices E Mail Campaign Dashboard Ppt Inspiration Topics PDF
The following slide displays the key metrics for the E-mail marketing campaign of the organization, the following slide highlights the direct sessions, the organic sessions and the frequency oat which e-mail have been sent. Deliver and pitch your topic in the best possible manner with this inbound interruption commerce promotion practices E mail campaign dashboard ppt inspiration topics pdf. Use them to share invaluable insights on organic sessions, email marketing, google analytics and impress your audience. This template can be altered and modified as per your expectations. So, grab it now.
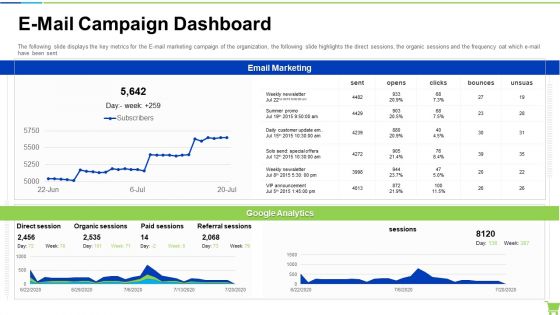
Developing And Controlling B2b Marketing Plan E-Mail Campaign Dashboard Portrait PDF
The following slide displays the key metrics for the E mail marketing campaign of the organization, the following slide highlights the direct sessions, the organic sessions and the frequency oat which e-mail have been sent. Deliver and pitch your topic in the best possible manner with this developing and controlling b2b marketing plan e-mail campaign dashboard portrait pdf. Use them to share invaluable insights on email marketing, google analytics and impress your audience. This template can be altered and modified as per your expectations. So, grab it now.
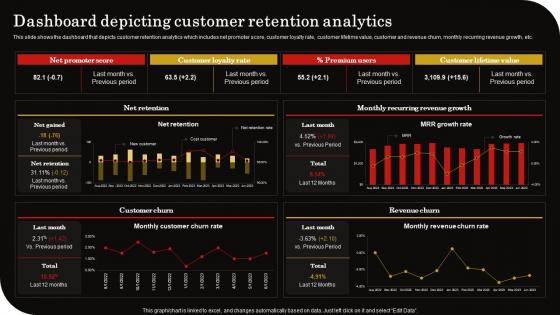
Dashboard Depicting Customer Retention Client Retention Strategy To Reduce Churn Rate Professional Pdf
This slide shows the dashboard that depicts customer retention analytics which includes net promoter score, customer loyalty rate, customer lifetime value, customer and revenue churn, monthly recurring revenue growth, etc. If you are looking for a format to display your unique thoughts, then the professionally designed Dashboard Depicting Customer Retention Client Retention Strategy To Reduce Churn Rate Professional Pdf is the one for you. You can use it as a Google Slides template or a PowerPoint template. Incorporate impressive visuals, symbols, images, and other charts. Modify or reorganize the text boxes as you desire. Experiment with shade schemes and font pairings. Alter, share or cooperate with other people on your work. Download Dashboard Depicting Customer Retention Client Retention Strategy To Reduce Churn Rate Professional Pdf and find out how to give a successful presentation. Present a perfect display to your team and make your presentation unforgettable. This slide shows the dashboard that depicts customer retention analytics which includes net promoter score, customer loyalty rate, customer lifetime value, customer and revenue churn, monthly recurring revenue growth, etc.
Product Business Plan Review Icon With Magnifying Glass Diagrams PDF
Persuade your audience using this Product Business Plan Review Icon With Magnifying Glass Diagrams PDF. This PPT design covers four stages, thus making it a great tool to use. It also caters to a variety of topics including Product Business Plan Review, Icon With Magnifying Glass. Download this PPT design now to present a convincing pitch that not only emphasizes the topic but also showcases your presentation skills.
What Is Our Business Ppt PowerPoint Presentation Diagrams
This is a what is our business ppt powerpoint presentation diagrams. This is a one stage process. The stages in this process are business, magnifier, search, marketing, strategy, success.
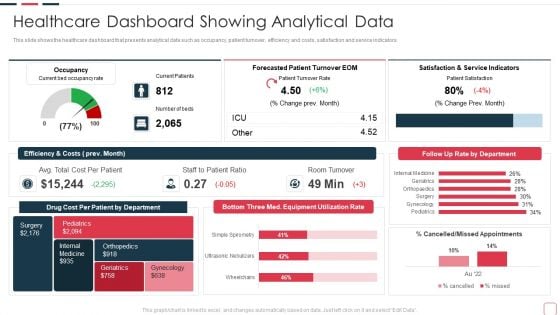
Price Benefit Internet Things Digital Twins Execution After Covid Healthcare Dashboard Designs PDF
This slide shows the healthcare dashboard that presents analytical data such as occupancy, patient turnover, efficiency and costs, satisfaction and service indicators. Deliver an awe inspiring pitch with this creative price benefit internet things digital twins execution after covid healthcare dashboard designs pdf bundle. Topics like healthcare dashboard showing analytical data can be discussed with this completely editable template. It is available for immediate download depending on the needs and requirements of the user.
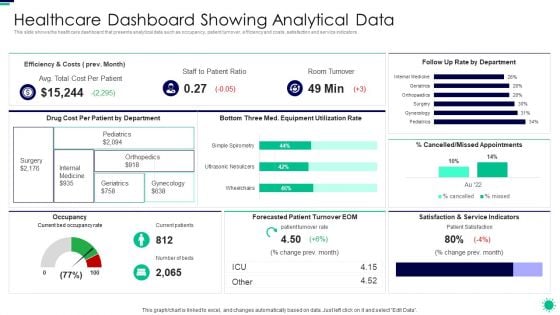
Purpose Digital Twin Internet Things Reducing Costs After COVID Era Healthcare Dashboard Showing Inspiration PDF
This slide shows the healthcare dashboard that presents analytical data such as occupancy, patient turnover, efficiency and costs, satisfaction and service indicators. Deliver an awe inspiring pitch with this creative purpose digital twin internet things reducing costs after covid era healthcare dashboard showing inspiration pdf bundle. Topics like healthcare dashboard showing analytical data can be discussed with this completely editable template. It is available for immediate download depending on the needs and requirements of the user.
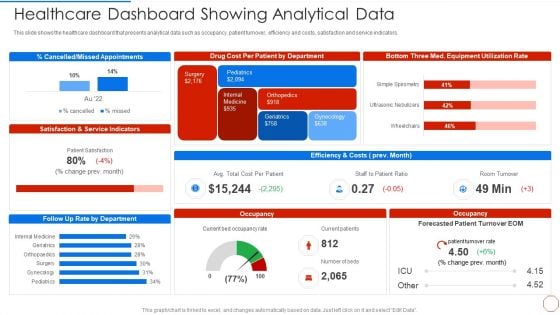
Minimizing Operational Cost Through Iot Virtual Twins Implementation Healthcare Dashboard Showing Sample PDF
This slide shows the healthcare dashboard that presents analytical data such as occupancy, patient turnover, efficiency and costs, satisfaction and service indicators. Deliver an awe inspiring pitch with this creative minimizing operational cost through iot virtual twins implementation healthcare dashboard showing sample pdf bundle. Topics like healthcare dashboard showing analytical data can be discussed with this completely editable template. It is available for immediate download depending on the needs and requirements of the user.
Project Management Dashboard Vector Icon Ppt PowerPoint Presentation Slides Files PDF
Presenting this set of slides with name project management dashboard vector icon ppt powerpoint presentation slides files pdf. This is a one stage process. The stage in this process is project management dashboard vector icon. This is a completely editable PowerPoint presentation and is available for immediate download. Download now and impress your audience.
Monthly Sales Reporting And Projections Dashboard Icon Ppt Icon Clipart Images PDF
Persuade your audience using this Monthly Sales Reporting And Projections Dashboard Icon Ppt Icon Clipart Images PDF. This PPT design covers three stages, thus making it a great tool to use. It also caters to a variety of topics including Monthly Sale,s Reporting And Projections, Dashboard Icon. Download this PPT design now to present a convincing pitch that not only emphasizes the topic but also showcases your presentation skills.
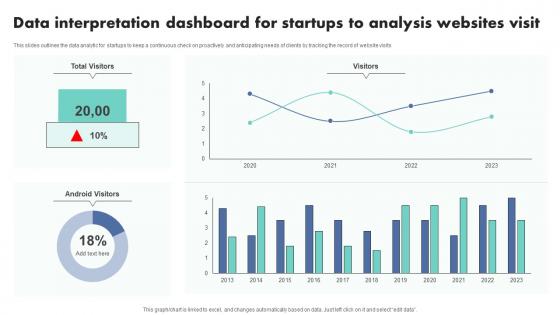
Data Interpretation Dashboard For Startups To Analysis Websites Visit Themes Pdf
This slides outlines the data analytic for startups to keep a continuous check on proactively and anticipating needs of clients by tracking the record of website visits.Showcasing this set of slides titled Data Interpretation Dashboard For Startups To Analysis Websites Visit Themes Pdf The topics addressed in these templates are Data Interpretation, Dashboard Startups, Analysis Websites Visit All the content presented in this PPT design is completely editable. Download it and make adjustments in color, background, font etc. as per your unique business setting. This slides outlines the data analytic for startups to keep a continuous check on proactively and anticipating needs of clients by tracking the record of website visits.
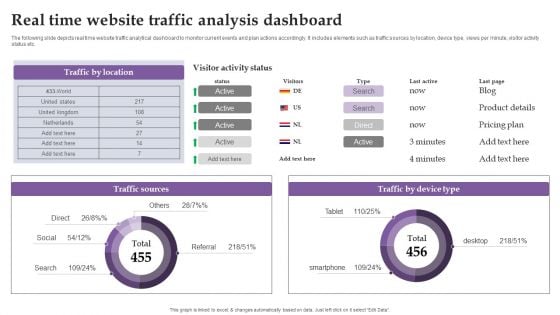
Real Time Website Traffic Analysis Dashboard Ppt Inspiration Graphics Download PDF
The following slide depicts real time website traffic analytical dashboard to monitor current events and plan actions accordingly. It includes elements such as traffic sources by location, device type, views per minute, visitor activity status etc. Are you searching for a Real Time Website Traffic Analysis Dashboard Ppt Inspiration Graphics Download PDF that is uncluttered, straightforward, and original Its easy to edit, and you can change the colors to suit your personal or business branding. For a presentation that expresses how much effort you have put in, this template is ideal With all of its features, including tables, diagrams, statistics, and lists, its perfect for a business plan presentation. Make your ideas more appealing with these professional slides. Download Real Time Website Traffic Analysis Dashboard Ppt Inspiration Graphics Download PDF from Slidegeeks today.
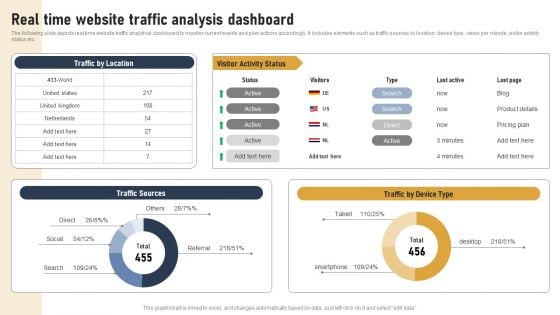
Incorporating Real Time Marketing For Improved Consumer Real Time Website Traffic Analysis Dashboard Elements PDF
The following slide depicts real time website traffic analytical dashboard to monitor current events and plan actions accordingly. It includes elements such as traffic sources by location, device type, views per minute, visitor activity status etc. Explore a selection of the finest Incorporating Real Time Marketing For Improved Consumer Real Time Website Traffic Analysis Dashboard Elements PDF here. With a plethora of professionally designed and pre made slide templates, you can quickly and easily find the right one for your upcoming presentation. You can use our Incorporating Real Time Marketing For Improved Consumer Real Time Website Traffic Analysis Dashboard Elements PDF to effectively convey your message to a wider audience. Slidegeeks has done a lot of research before preparing these presentation templates. The content can be personalized and the slides are highly editable. Grab templates today from Slidegeeks.
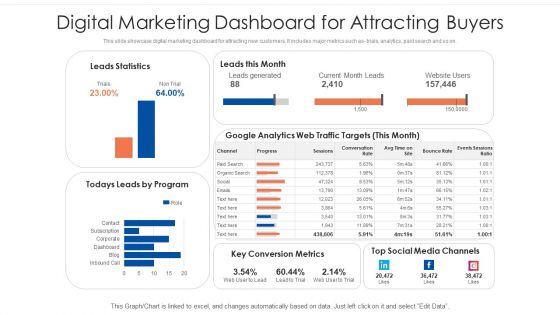
Digital Marketing Dashboard For Attracting Buyers Ppt PowerPoint Presentation Gallery Visuals PDF
This slide showcase digital marketing dashboard for attracting new customers. It includes major metrics such as- trials, analytics, paid search and so on. Showcasing this set of slides titled digital marketing dashboard for attracting buyers ppt powerpoint presentation gallery visuals pdf. The topics addressed in these templates are social media, analytics, targets. All the content presented in this PPT design is completely editable. Download it and make adjustments in color, background, font etc. as per your unique business setting.
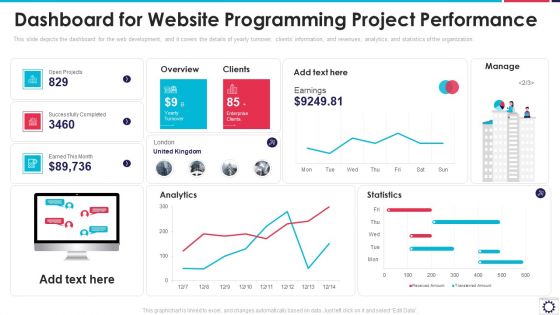
Website Programming IT Dashboard For Website Programming Project Performance Inspiration PDF
This slide depicts the dashboard for the web development, and it covers the details of yearly turnover, clients information, and revenues, analytics, and statistics of the organization. Deliver an awe inspiring pitch with this creative website programming it dashboard for website programming project performance inspiration pdf bundle. Topics like open projects, successfully completed, earned month, analytics, statistics can be discussed with this completely editable template. It is available for immediate download depending on the needs and requirements of the user.
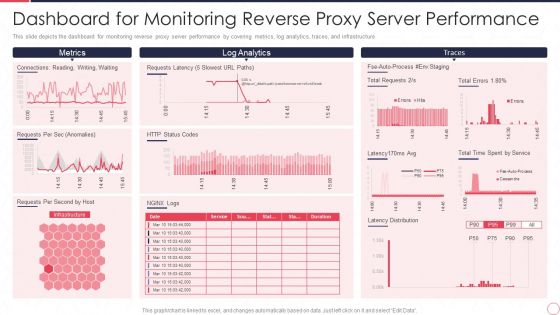
IT Dashboard For Monitoring Reverse Proxy Server Performance Ppt Ideas Example PDF
This slide depicts the dashboard for monitoring reverse proxy server performance by covering metrics, log analytics, traces, and infrastructure. Deliver and pitch your topic in the best possible manner with this it dashboard for monitoring reverse proxy server performance ppt ideas example pdf. Use them to share invaluable insights on metrics, log analytics, traces and impress your audience. This template can be altered and modified as per your expectations. So, grab it now.
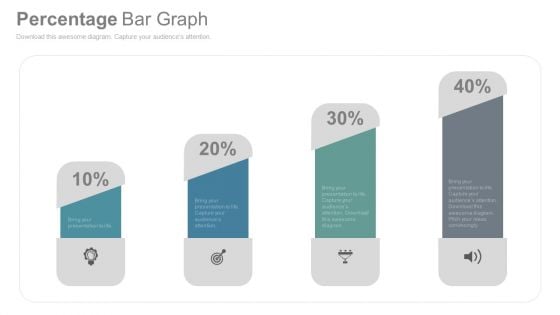
Bar Graph To Compare Business Data PowerPoint Slides
This is the slide which can solve many purposes of yours. Be it growth in your company, need to show your company?s status in the market as compared to others, or how your business has improved so far. An ideal PowerPoint template to display all of these. You can easily use this graph to show the growth of your company using the percentage icons. You can use this visual to show the status of your company in the market in comparison with others. You can edit the icons and replace them with the logo of your company and the others. You can also show it to your colleagues how your company has built its image in the market or how it has improved over the time. A perfect bar graph image which needs to be included in your business PPT presentations.
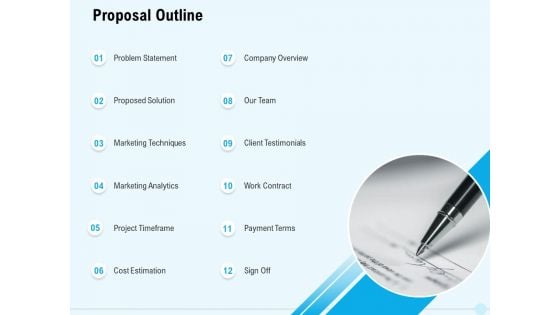
Business Commodity Market KPIS Proposal Proposal Outline Terms Diagrams PDF
Presenting this set of slides with name business commodity market kpis proposal proposal outline terms diagrams pdf. This is a twelve stage process. The stages in this process are problem statement, proposed solution, marketing techniques, marketing analytics, project timeframe. This is a completely editable PowerPoint presentation and is available for immediate download. Download now and impress your audience.


 Continue with Email

 Home
Home


