Business Snapshot
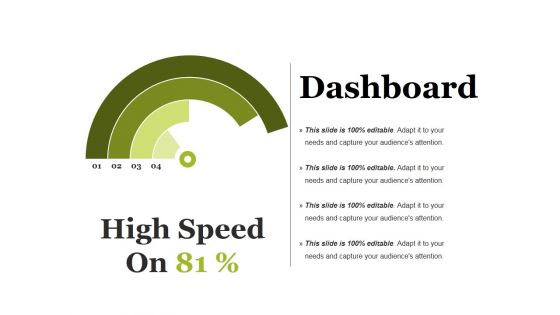
Dashboard Ppt PowerPoint Presentation Infographics Inspiration
This is a dashboard ppt powerpoint presentation infographics inspiration. This is a one stage process. The stages in this process are dashboard, high, low, speed, medium, business.
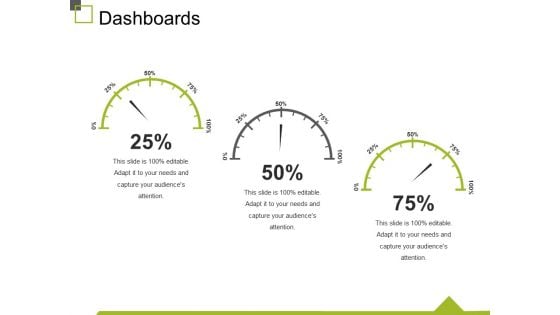
Dashboards Ppt PowerPoint Presentation Slides Layout
This is a dashboards ppt powerpoint presentation slides layout. This is a three stage process. The stages in this process are Dashboards, Percentage, Business, Marketing, Process.
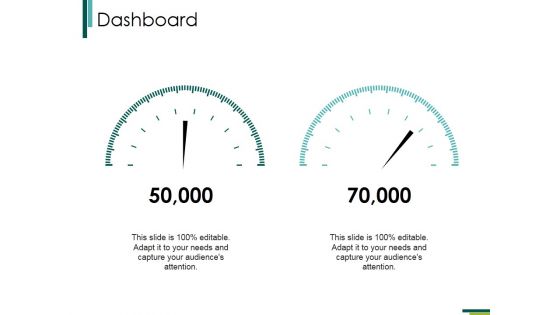
Dashboard Ppt PowerPoint Presentation Portfolio Clipart Images
This is a dashboard ppt powerpoint presentation portfolio clipart images. This is a two stage process. The stages in this process are dashboard, marketing, measure, strategy, business.
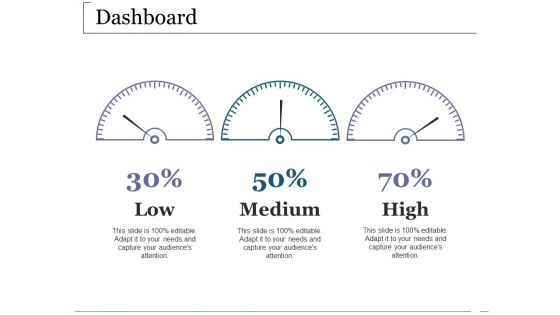
Dashboard Ppt PowerPoint Presentation Styles Structure
This is a dashboard ppt powerpoint presentation styles structure. This is a three stage process. The stages in this process are dashboard, low, medium, high, business.
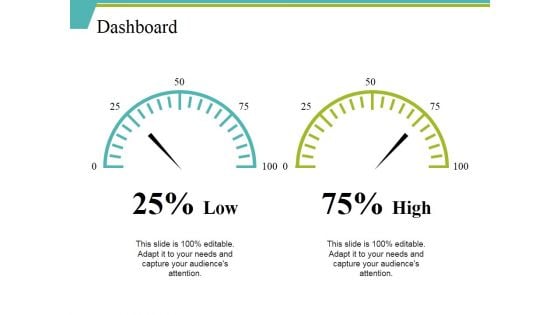
Dashboard Ppt PowerPoint Presentation Portfolio Slides
This is a dashboard ppt powerpoint presentation portfolio slides. This is a two stage process. The stages in this process are high, low, business, measurement, dashboard.
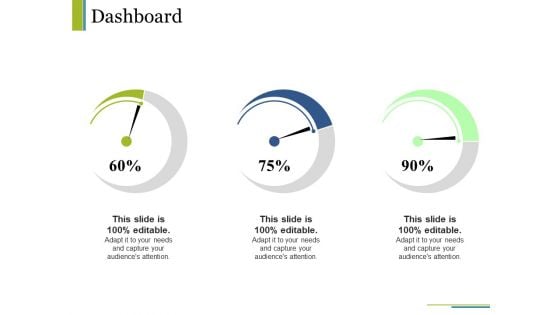
Dashboard Ppt PowerPoint Presentation Summary Ideas
This is a dashboard ppt powerpoint presentation summary ideas. This is a three stage process. The stages in this process are dashboard, percentage, business, marketing, strategy.

Dashboard Ppt PowerPoint Presentation Show Information
This is a dashboard ppt powerpoint presentation show information. This is a three stage process. The stages in this process are business, marketing, percentage, dashboard, process.
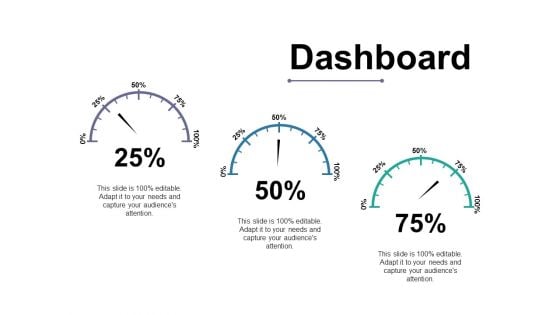
Dashboard Ppt PowerPoint Presentation Styles Themes
This is a dashboard ppt powerpoint presentation styles themes. This is a three stage process. The stages in this process are dashboard, speed, meter, business, marketing.
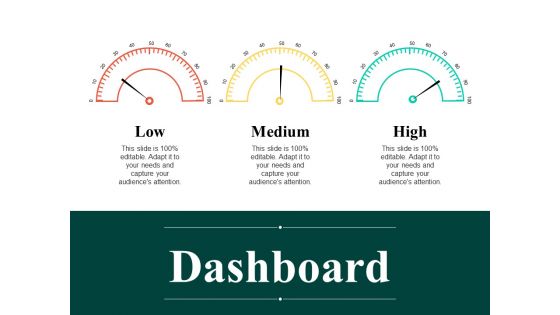
Dashboard Ppt PowerPoint Presentation Styles Guidelines
This is a dashboard ppt powerpoint presentation styles guidelines. This is a three stage process. The stages in this process are low, medium, high, dashboard, business.
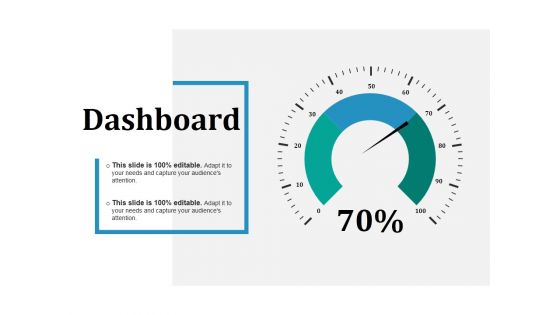
Dashboard Ppt PowerPoint Presentation Professional Ideas
This is a dashboard ppt powerpoint presentation professional ideas. This is a three stage process. The stages in this process are business, dashboard, percentage, marketing, process.
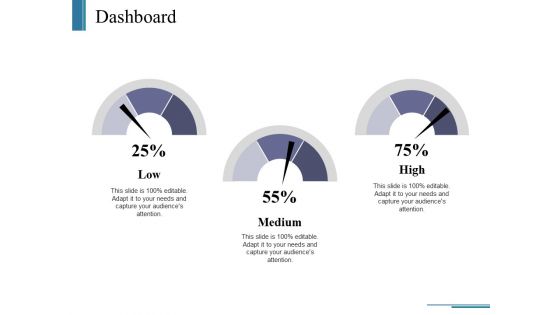
Dashboard Ppt PowerPoint Presentation Infographics Slides
This is a dashboard ppt powerpoint presentation infographics slides. This is a three stage process. The stages in this process are business, marketing, dashboard, process, percentage.
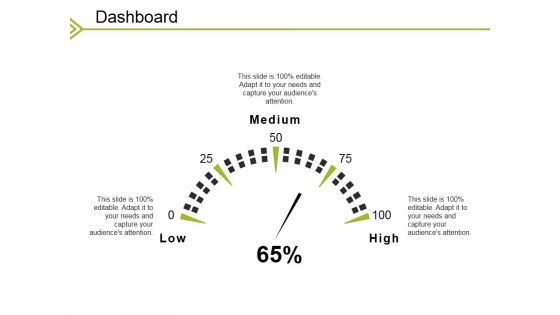
Dashboard Ppt PowerPoint Presentation Layouts Model
This is a dashboard ppt powerpoint presentation layouts model. This is a three stage process. The stages in this process are business, dashboard, low, medium, high.
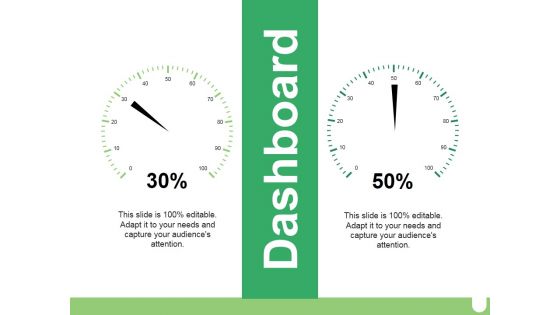
Dashboard Ppt PowerPoint Presentation File Graphic Tips
This is a dashboard ppt powerpoint presentation file graphic tips. This is a two stage process. The stages in this process are business, marketing, percentage, dashboard, process.
Dashboard Ppt PowerPoint Presentation Icon Sample
This is a dashboard ppt powerpoint presentation icon sample. This is a one stage process. The stages in this process are business, marketing, dashboard, high speed, percentage.
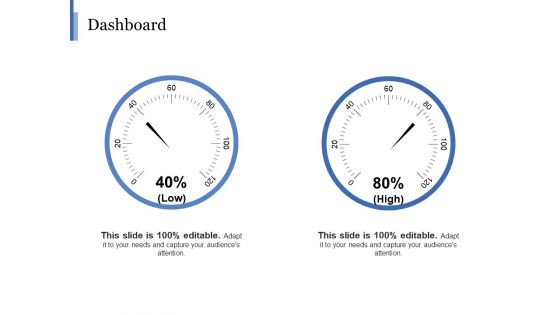
Dashboard Ppt PowerPoint Presentation Visual Aids Inspiration
This is a dashboard ppt powerpoint presentation visual aids inspiration. This is a two stage process. The stages in this process are business, marketing, percentage, dashboard, process.
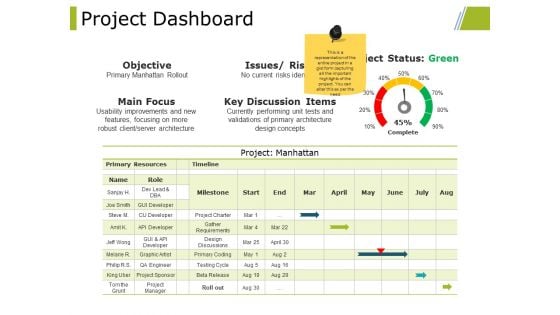
Project Dashboard Ppt PowerPoint Presentation Portfolio Tips
This is a project dashboard ppt powerpoint presentation portfolio tips. This is a five stage process. The stages in this process are project dashboard, measurement, marketing, strategy, business.
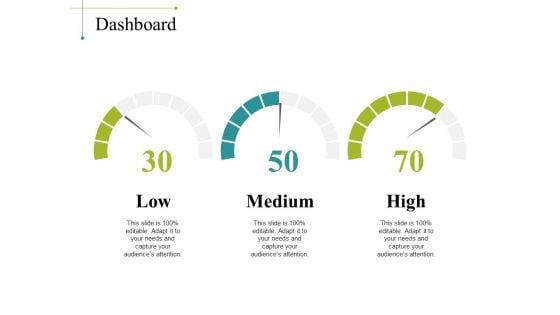
Dashboard Ppt PowerPoint Presentation Summary Design Inspiration
This is a dashboard ppt powerpoint presentation summary design inspiration. This is a three stage process. The stages in this process are business, marketing, low, medium, high, dashboard.
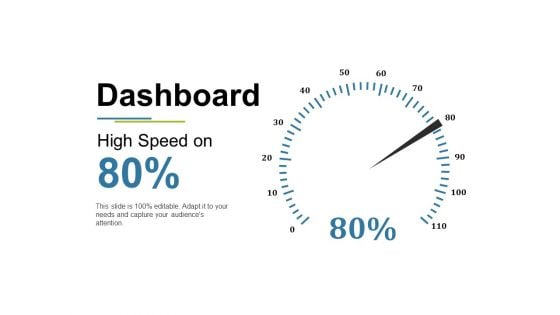
Dashboard Ppt PowerPoint Presentation Model Portrait
This is a dashboard ppt powerpoint presentation model portrait. This is a one stage process. The stages in this process are business, marketing, high speed, dashboard, percentage.
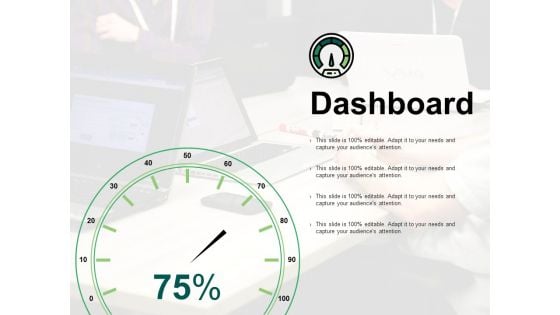
Dashboard Ppt PowerPoint Presentation Infographic Template Show
This is a dashboard ppt powerpoint presentation infographic template show. This is one stage process. The stages in this process are business, dashboard, marketing, percentage, process.
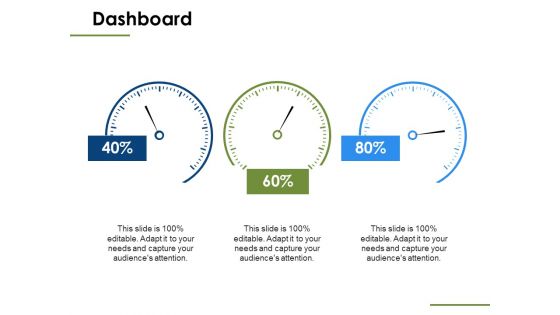
Dashboard Measure Ppt PowerPoint Presentation Ideas Samples
This is a dashboard measure ppt powerpoint presentation ideas samples. This is a three stage process. The stages in this process are dashboard, business, marketing, management, strategy.
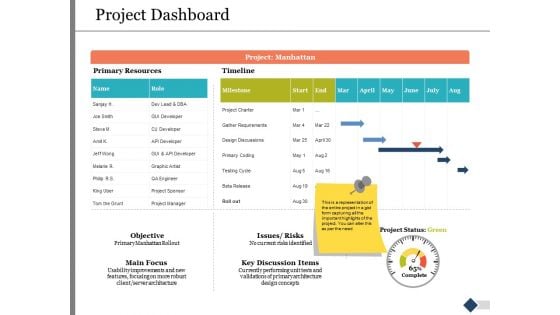
Project Dashboard Ppt PowerPoint Presentation Slides Gallery
This is a project dashboard ppt powerpoint presentation slides gallery. This is a two stage process. The stages in this process are marketing, business, management, dashboard.
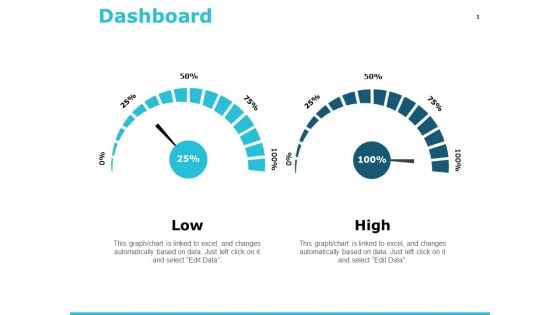
Dashboard Management Ppt PowerPoint Presentation Show Deck
This is a dashboard management ppt powerpoint presentation show deck. This is a two stage process. The stages in this process are dashboard, finance, analysis, business, investment.
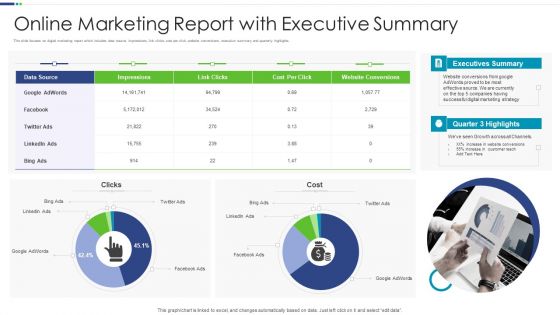
Online Marketing Report With Executive Summary Designs PDF
This slide focuses on digital marketing report which includes data source, impressions, link clicks, cost per click, website conversions, executive summary and quarterly highlights.Pitch your topic with ease and precision using this Online Marketing Report With Executive Summary Designs PDF This layout presents information on Executives Summary, Digital Marketing, Conversions It is also available for immediate download and adjustment. So, changes can be made in the color, design, graphics or any other component to create a unique layout.
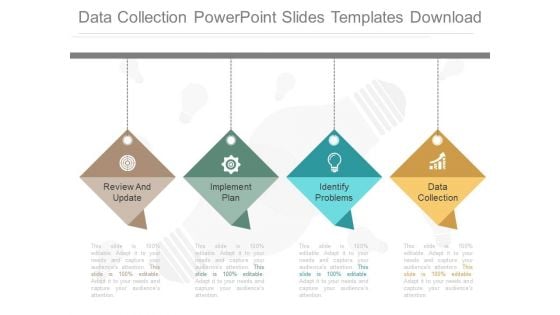
Data Collection Powerpoint Slides Templates Download
This is a data collection powerpoint slides templates download. This is a four stage process. The stages in this process are review and update, implement plan, identify problems, data collection.
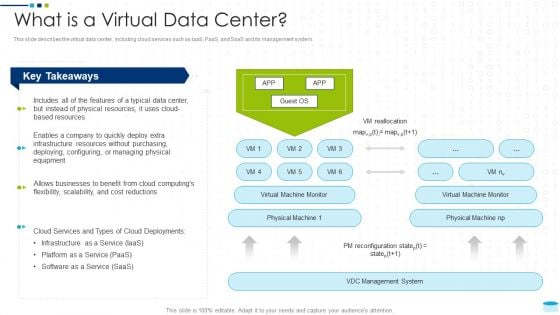
Data Center Infrastructure Management IT What Is A Virtual Data Center Information PDF
This slide describes the virtual data center, including cloud services such as IaaS, PaaS, and SaaS and its management system. Deliver an awe inspiring pitch with this creative data center infrastructure management it what is a virtual data center information pdf bundle. Topics like cost, infrastructure, service, resources, businesses can be discussed with this completely editable template. It is available for immediate download depending on the needs and requirements of the user.
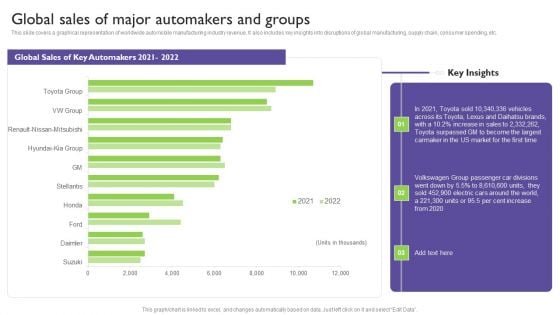
Global Automotive Industry Analysis Global Sales Of Major Automakers And Groups Pictures PDF
This slide covers a graphical representation of worldwide automobile manufacturing industry revenue. It also includes key insights into disruptions of global manufacturing, supply chain, consumer spending, etc. The Global Automotive Industry Analysis Global Sales Of Major Automakers And Groups Pictures PDF is a compilation of the most recent design trends as a series of slides. It is suitable for any subject or industry presentation, containing attractive visuals and photo spots for businesses to clearly express their messages. This template contains a variety of slides for the user to input data, such as structures to contrast two elements, bullet points, and slides for written information. Slidegeeks is prepared to create an impression.
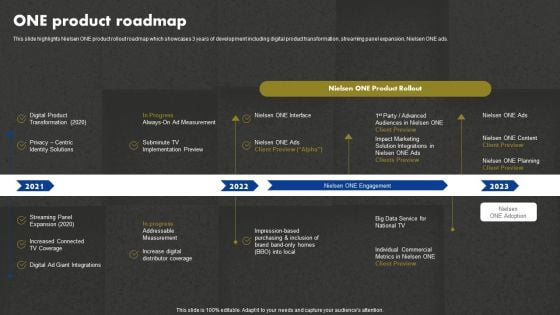
Data And Customer Analysis Company Outline One Product Roadmap Introduction PDF
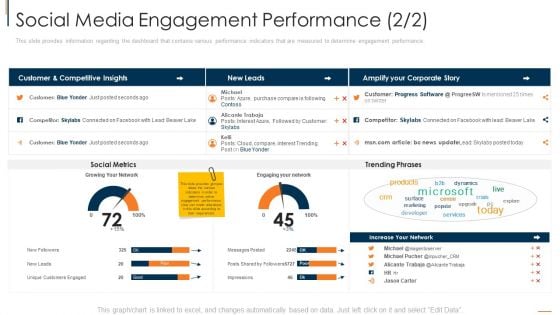
Social Media Engagement Performance Network Introduction PDF
This slide provides information regarding the dashboard that contains various performance indicators that are measured to determine engagement performance. Deliver an awe inspiring pitch with this creative social media engagement performance network introduction pdf bundle. Topics like purchase, social metrics, network, customers can be discussed with this completely editable template. It is available for immediate download depending on the needs and requirements of the user.
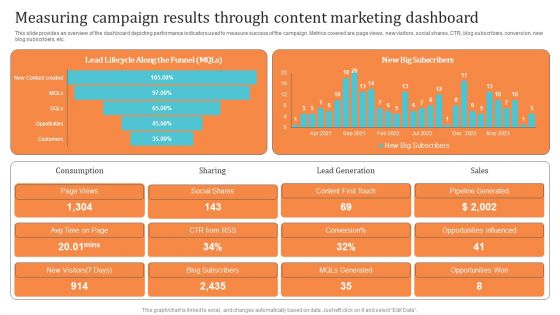
Content Advertising Campaign Measuring Campaign Results Background PDF
This slide provides an overview of the dashboard depicting performance indicators used to measure success of the campaign. Metrics covered are page views, new visitors, social shares, CTR, blog subscribers, conversion, new blog subscribers, etc. There are so many reasons you need a Content Advertising Campaign Measuring Campaign Results Background PDF. The first reason is you cannot spend time making everything from scratch, Thus, Slidegeeks has made presentation templates for you too. You can easily download these templates from our website easily.

Vertical Steps For Data Management Powerpoint Template
This PowerPoint template contains diagram of vertical steps. You may use this PPT slide to depict data management. The color coding of this template is specifically designed to highlight you points.
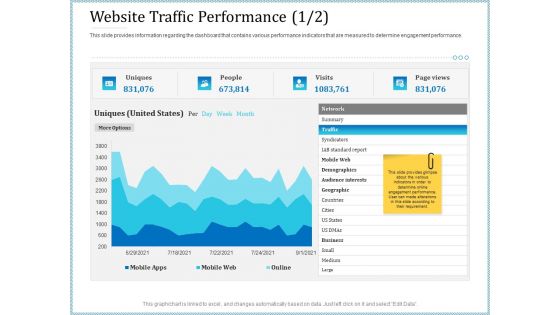
Leveraged Client Engagement Website Traffic Performance Cities Download PDF
This slide provides information regarding the dashboard that contains various performance indicators that are measured to determine engagement performance. Deliver an awe inspiring pitch with this creative leveraged client engagement website traffic performance cities download pdf bundle. Topics like traffic, geographic, business, syndicators, demographics can be discussed with this completely editable template. It is available for immediate download depending on the needs and requirements of the user.
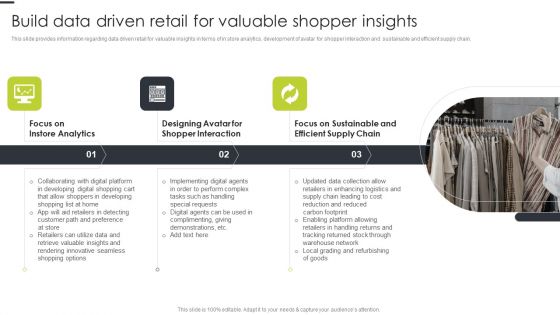
Build Data Driven Retail For Valuable Shopper Insights Diagrams PDF
This slide provides information regarding data driven retail for valuable insights in terms of in store analytics, development of avatar for shopper interaction and sustainable and efficient supply chain. Deliver and pitch your topic in the best possible manner with this Build Data Driven Retail For Valuable Shopper Insights Diagrams PDF. Use them to share invaluable insights on Instore Analytics, Shopper Interaction, Implementing Digital and impress your audience. This template can be altered and modified as per your expectations. So, grab it now.
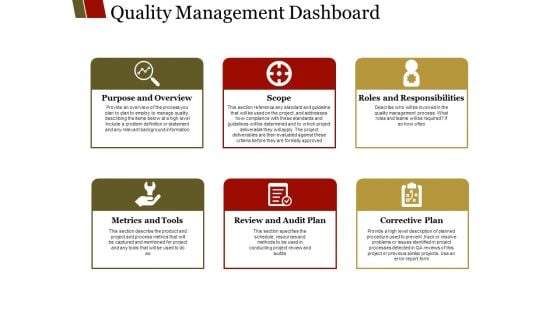
Quality Management Dashboard Ppt PowerPoint Presentation Professional Gridlines
This is a quality management dashboard ppt powerpoint presentation professional gridlines. This is a six stage process. The stages in this process are scope, purpose and overview, metrics and tools, review and audit, plan corrective plan.
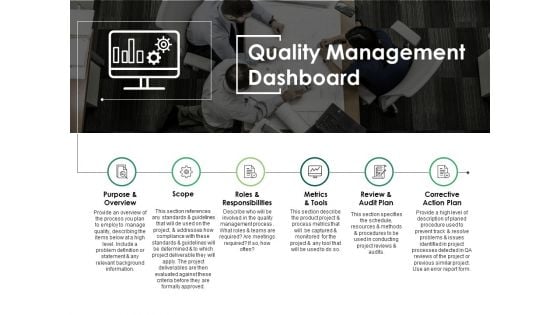
Quality Management Dashboard Ppt PowerPoint Presentation Infographics Graphics
This is a quality management dashboard ppt powerpoint presentation infographics graphics. This is a six stage process. The stages in this process are purpose and overview, scope, roles and responsibilities, metrics and tools, review and audit plan.
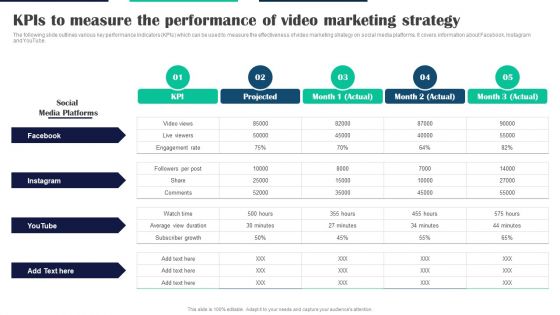
Executing Video Promotional Kpis To Measure The Performance Of Video Marketing Strategy Inspiration PDF
The following slide outlines various key performance indicators KPIs which can be used to measure the effectiveness of video marketing strategy on social media platforms. It covers information about Facebook, Instagram and YouTube. This modern and well-arranged Executing Video Promotional Kpis To Measure The Performance Of Video Marketing Strategy Inspiration PDF provides lots of creative possibilities. It is very simple to customize and edit with the Powerpoint Software. Just drag and drop your pictures into the shapes. All facets of this template can be edited with Powerpoint, no extra software is necessary. Add your own material, put your images in the places assigned for them, adjust the colors, and then you can show your slides to the world, with an animated slide included.
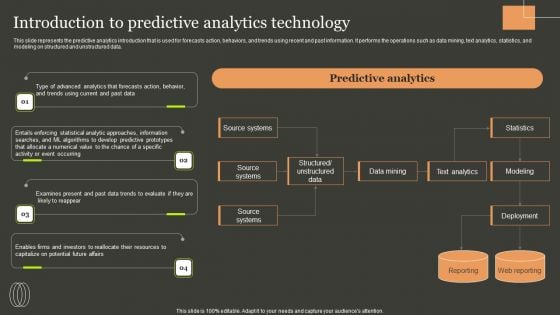
Predictive Analytics Methods Introduction To Predictive Analytics Technology Clipart PDF
This slide represents the predictive analytics introduction that is used for forecasts action, behaviors, and trends using recent and past information. It performs the operations such as data mining, text analytics, statistics, and modeling on structured and unstructured data. Do you have to make sure that everyone on your team knows about any specific topic I yes, then you should give Predictive Analytics Methods Introduction To Predictive Analytics Technology Clipart PDF a try. Our experts have put a lot of knowledge and effort into creating this impeccable Predictive Analytics Methods Introduction To Predictive Analytics Technology Clipart PDF. You can use this template for your upcoming presentations, as the slides are perfect to represent even the tiniest detail. You can download these templates from the Slidegeeks website and these are easy to edit. So grab these today.
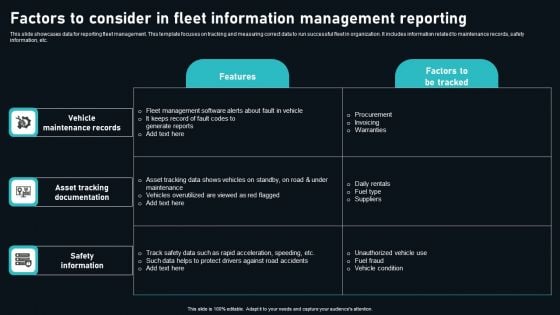
Factors To Consider In Fleet Information Management Reporting Topics PDF
This slide showcases data for reporting fleet management. This template focuses on tracking and measuring correct data to run successful fleet in organization. It includes information related to maintenance records, safety information, etc. Pitch your topic with ease and precision using this Factors To Consider In Fleet Information Management Reporting Topics PDF. This layout presents information on Vehicle Maintenance Records, Asset Tracking Documentation, Safety Information. It is also available for immediate download and adjustment. So, changes can be made in the color, design, graphics or any other component to create a unique layout.
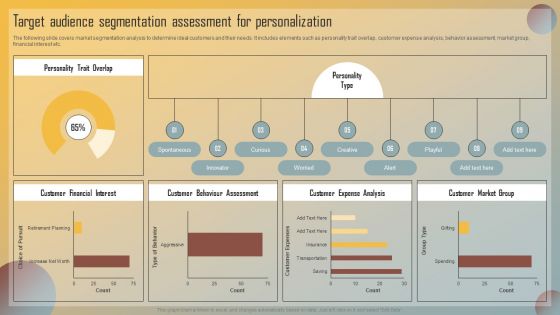
Guide For Marketing Analytics To Improve Decisions Target Audience Segmentation Assessment For Personalization Slides PDF
The following slide covers market segmentation analysis to determine ideal customers and their needs. It includes elements such as personality trait overlap, customer expense analysis, behavior assessment, market group, financial interest etc. The Guide For Marketing Analytics To Improve Decisions Target Audience Segmentation Assessment For Personalization Slides PDF is a compilation of the most recent design trends as a series of slides. It is suitable for any subject or industry presentation, containing attractive visuals and photo spots for businesses to clearly express their messages. This template contains a variety of slides for the user to input data, such as structures to contrast two elements, bullet points, and slides for written information. Slidegeeks is prepared to create an impression.
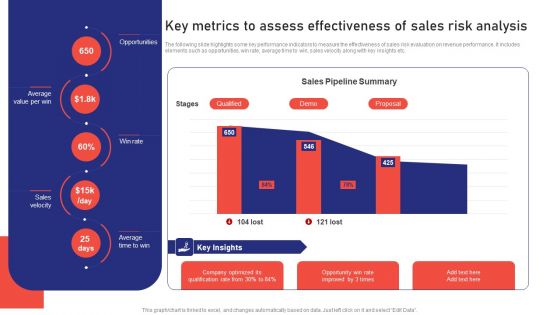
Sales Risk Assessment For Profit Maximization Key Metrics To Assess Effectiveness Of Sales Risk Analysis Ideas PDF
The following slide highlights some key performance indicators to measure the effectiveness of sales risk evaluation on revenue performance. It includes elements such as opportunities, win rate, average time to win, sales velocity along with key insights etc. Get a simple yet stunning designed Sales Risk Assessment For Profit Maximization Key Metrics To Assess Effectiveness Of Sales Risk Analysis Ideas PDF. It is the best one to establish the tone in your meetings. It is an excellent way to make your presentations highly effective. So, download this PPT today from Slidegeeks and see the positive impacts. Our easy to edit Sales Risk Assessment For Profit Maximization Key Metrics To Assess Effectiveness Of Sales Risk Analysis Ideas PDF can be your go to option for all upcoming conferences and meetings. So, what are you waiting for Grab this template today.

Simplified Regulatory Framework For Microfinance Complete Guide To Microfinance Fin SS V
This slide includes the components for creating a regulatory framework for microfinance institutions. The different aspects are legal structure, prudential regulations, consumer protection, interest rate regulation, and reporting. The Simplified Regulatory Framework For Microfinance Complete Guide To Microfinance Fin SS V is a compilation of the most recent design trends as a series of slides. It is suitable for any subject or industry presentation, containing attractive visuals and photo spots for businesses to clearly express their messages. This template contains a variety of slides for the user to input data, such as structures to contrast two elements, bullet points, and slides for written information. Slidegeeks is prepared to create an impression. This slide includes the components for creating a regulatory framework for microfinance institutions. The different aspects are legal structure, prudential regulations, consumer protection, interest rate regulation, and reporting.
Stock Photo Computer Mouse Connected To Word Online PowerPoint Slide
Explain the importance of online word in today's tech world. This power point image slide has been designed with graphic of computer mouse and online text. In this image concept of internet application and internet connectivity is well explained. Use this image for online shopping and online marketing related topics in any business presentations.
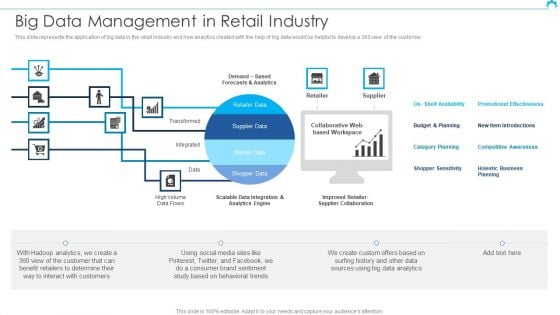
Big Data Architect Big Data Management In Retail Industry Ideas PDF
This slide represents the application of big data in the retail industry and how analytics created with the help of big data would be helpful to develop a 360 view of the customer. Deliver and pitch your topic in the best possible manner with this Big Data Architect Big Data Management In Retail Industry Ideas PDF. Use them to share invaluable insights on Promotional Effectiveness, Competitive Awareness, Shopper Sensitivity and impress your audience. This template can be altered and modified as per your expectations. So, grab it now.
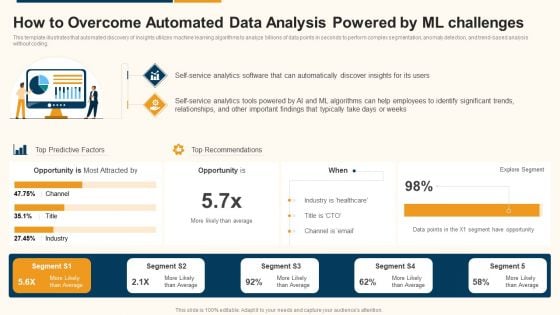
Data Interpretation And Analysis Playbook How To Overcome Automated Data Analysis Powered By Ml Challenges Summary PDF
This template illustrates that automated discovery of insights utilizes machine learning algorithms to analyze billions of data points in seconds to perform complex segmentation, anomaly detection, and trend-based analysis without coding. Deliver and pitch your topic in the best possible manner with this data interpretation and analysis playbook how to overcome automated data analysis powered by ml challenges summary pdf. Use them to share invaluable insights on opportunity, service, analytics, industry and impress your audience. This template can be altered and modified as per your expectations. So, grab it now.

Comprehensive Guide To Build Marketing Success Metrics To Measure Influencer Marketing Sample PDF
The following slide showcases different key performance indicators KPIs through which digital marketers can evaluate influencer marketing campaign performance. The key performance indicators outlined in slide are audience reach, impressions, followers growth, click-through rate CTR, revenue, and conversion rate. This modern and well-arranged Comprehensive Guide To Build Marketing Success Metrics To Measure Influencer Marketing Sample PDF provides lots of creative possibilities. It is very simple to customize and edit with the Powerpoint Software. Just drag and drop your pictures into the shapes. All facets of this template can be edited with Powerpoint, no extra software is necessary. Add your own material, put your images in the places assigned for them, adjust the colors, and then you can show your slides to the world, with an animated slide included.
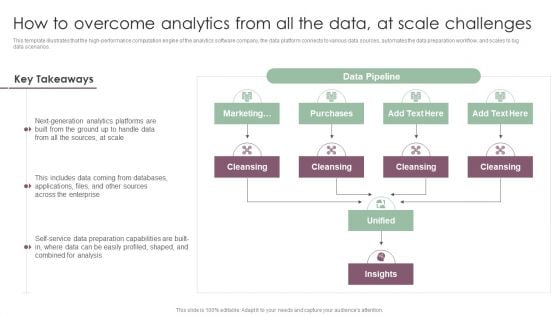
Information Analysis And BI Playbook How To Overcome Analytics From All The Data At Scale Challenges Microsoft PDF
This template illustrates that the high performance computation engine of the analytics software company, the data platform connects to various data sources, automates the data preparation workflow, and scales to big data scenarios. Crafting an eye catching presentation has never been more straightforward. Let your presentation shine with this tasteful yet straightforward Information Analysis And BI Playbook How To Overcome Analytics From All The Data At Scale Challenges Microsoft PDF template. It offers a minimalistic and classy look that is great for making a statement. The colors have been employed intelligently to add a bit of playfulness while still remaining professional. Construct the ideal Information Analysis And BI Playbook How To Overcome Analytics From All The Data At Scale Challenges Microsoft PDF that effortlessly grabs the attention of your audience Begin now and be certain to wow your customers.
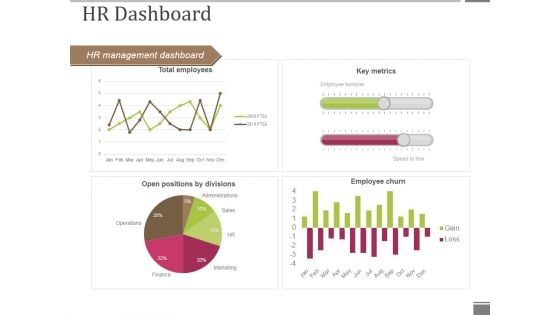
Hr Dashboard Template 1 Ppt PowerPoint Presentation Infographic Template Format Ideas
This is a hr dashboard template 1 ppt powerpoint presentation infographic template format ideas. This is a four stage process. The stages in this process are hr management dashboard, key metrics, employee churn, open positions by divisions, total employees.

Causes For Increased Consumer Attrition Rate In Call Center Case Competition Ppt PowerPoint Presentation Complete With Slides
Induce strategic thinking by presenting this complete deck. Enthrall your audience by deploying this thought-provoking PPT deck. It can be downloaded in both standard and widescreen aspect ratios, thus making it a complete package to use and deploy. Convey your thoughts and actions using the fifty two slides presented in this complete deck. Additionally, feel free to alter its components like color, graphics, design, etc, to create a great first impression. Grab it now by clicking on the download button below.
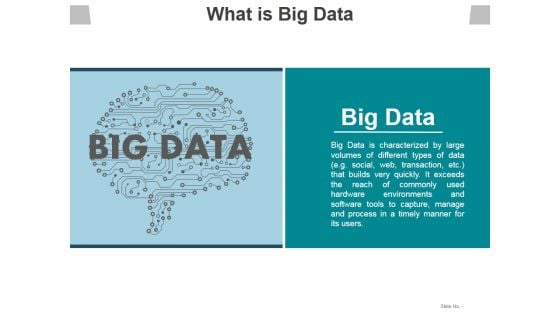
What Is Big Data Ppt PowerPoint Presentation Styles Background
This is a what is big data ppt powerpoint presentation styles background. This is a one stage process. The stages in this process are big data, data analysis, business, marketing, management.
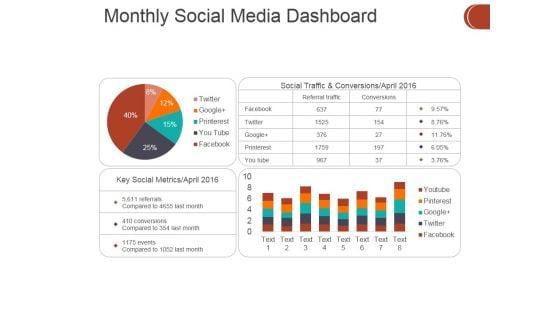
Monthly Social Media Dashboard Ppt PowerPoint Presentation Show Picture
This is a monthly social media dashboard ppt powerpoint presentation show picture. This is a four stage process. The stages in this process are business, finance, marketing, analysis, investment.
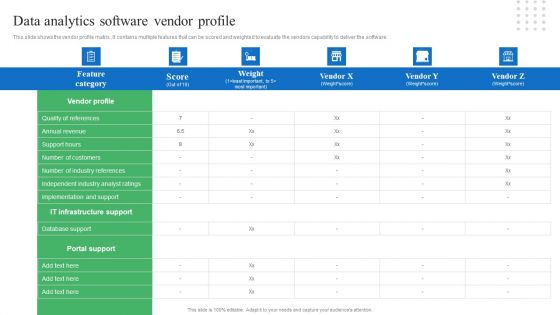
Toolkit For Data Science And Analytics Transition Data Analytics Software Vendor Profile Themes PDF
This slide shows the vendor profile matrix. It contains multiple features that can be scored and weighted to evaluate the vendors capability to deliver the software. Slidegeeks is here to make your presentations a breeze with Toolkit For Data Science And Analytics Transition Data Analytics Software Vendor Profile Themes PDF With our easy to use and customizable templates, you can focus on delivering your ideas rather than worrying about formatting. With a variety of designs to choose from, you are sure to find one that suits your needs. And with animations and unique photos, illustrations, and fonts, you can make your presentation pop. So whether you are giving a sales pitch or presenting to the board, make sure to check out Slidegeeks first.
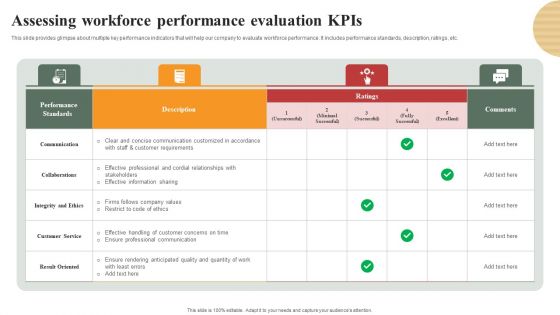
Optimizing Human Capital Alignment Assessing Workforce Performance Evaluation Kpis Download PDF
This slide provides glimpse about multiple key performance indicators that will help our company to evaluate workforce performance. It includes performance standards, description, ratings, etc. Take your projects to the next level with our ultimate collection of Optimizing Human Capital Alignment Assessing Workforce Performance Evaluation Kpis Download PDF. Slidegeeks has designed a range of layouts that are perfect for representing task or activity duration, keeping track of all your deadlines at a glance. Tailor these designs to your exact needs and give them a truly corporate look with your own brand colors theyll make your projects stand out from the rest.
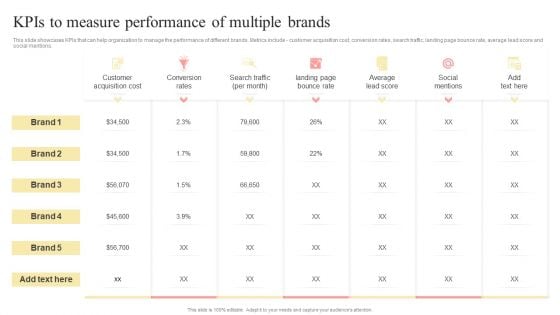
Kpis To Measure Performance Of Multiple Brands Multi Branding Approaches For Different Template PDF
This slide showcases KPIs that can help organization to manage the performance of different brands. Metrics include customer acquisition cost, conversion rates, search traffic, landing page bounce rate, average lead score and social mentions.The Kpis To Measure Performance Of Multiple Brands Multi Branding Approaches For Different Template PDF is a compilation of the most recent design trends as a series of slides. It is suitable for any subject or industry presentation, containing attractive visuals and photo spots for businesses to clearly express their messages. This template contains a variety of slides for the user to input data, such as structures to contrast two elements, bullet points, and slides for written information. Slidegeeks is prepared to create an impression.
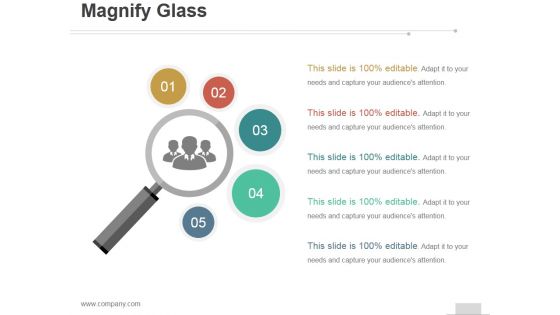
Magnify Glass Ppt PowerPoint Presentation Influencers
This is a magnify glass ppt powerpoint presentation influencers. This is a five stage process. The stages in this process are business, marketing, success, searching, strategy.
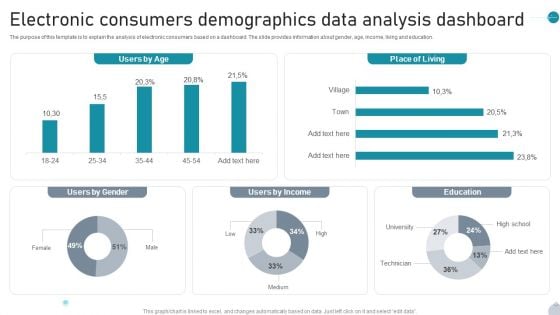
Electronic Consumers Demographics Data Analysis Dashboard Topics PDF
The purpose of this template is to explain the analysis of electronic consumers based on a dashboard. The slide provides information about gender, age, income, living and education. Showcasing this set of slides titled Electronic Consumers Demographics Data Analysis Dashboard Topics PDF. The topics addressed in these templates are Users By Age, Place Of Living, Users By Income All the content presented in this PPT design is completely editable. Download it and make adjustments in color, background, font etc. as per your unique business setting.

Introducing Yourself Powerpoint Ppt Template Bundles
Prepare yourself for a journey through new perspective on business with our Introducing Yourself Powerpoint Ppt Template Bundles. This complete deck of Professional Experience, SWOT Analysis, Case Study, Interpersonal Skills, Project Accomplishments slides is a one-stop solution to all your business presentation needs. See excellence in action in each of the slides as we touch all important business pointers in significant detail. Experience a new way of presenting facts in business that enable all your stakeholders to have success in their grasp. The same presentation will take a new form with your own data keyed in, as the templates in the Introducing Yourself Powerpoint Ppt Template Bundles all 100 percent editable. Download now to experience the power of imagination as a tool for success in business. Download now. Introducing yourself refers to concise presentation of yourself in a professional or formal setting, emphasizing important details like your name, position, work experience, skills, and notable accomplishments. The purpose is to present yourself in a professional environment, building trust and facilitating meaningful relationships. This template includes self introduction of associate professional experience and skills, academic qualifications, SWOT analysis, case study, interpersonal skills, interest based activities, project accomplishments, major achievements, and training programs completed.
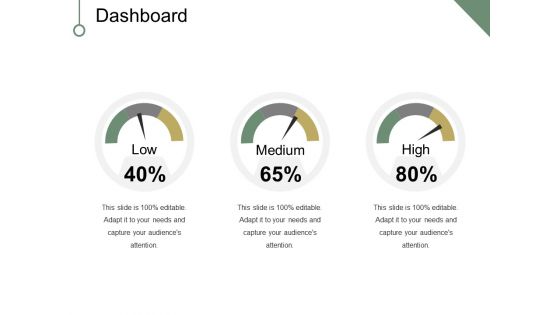
Dashboard Ppt PowerPoint Presentation Infographic Template Background Image
This is a dashboard ppt powerpoint presentation infographic template background image. This is a three stage process. The stages in this process are dashboard, business, marketing, percentage, low.
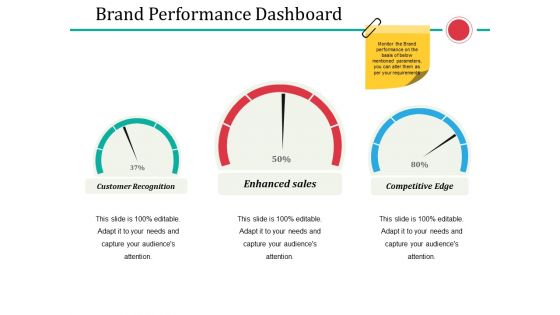
Brand Performance Dashboard Ppt PowerPoint Presentation Professional Elements
This is a brand performance dashboard ppt powerpoint presentation professional elements. This is a three stage process. The stages in this process are dashboard, percentage, business, marketing, strategy.
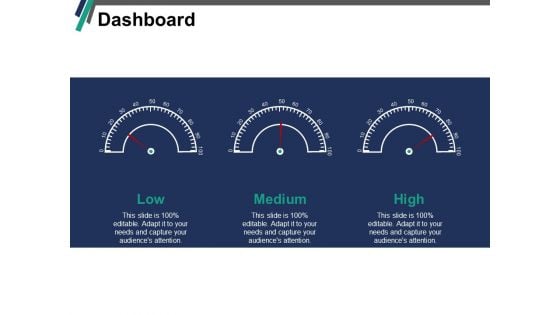
Dashboard Low Medium Ppt PowerPoint Presentation Gallery Rules
This is a dashboard low medium ppt powerpoint presentation gallery rules. This is a three stage process. The stages in this process are dashboard, low, medium, high, business.
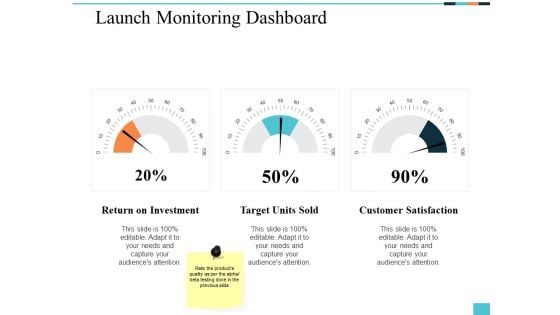
Launch Monitoring Dashboard Ppt PowerPoint Presentation Infographics Styles
This is a launch monitoring dashboard ppt powerpoint presentation infographics styles. This is a three stage process. The stages in this process are business, management, marketing, dashboard.

Dashboard Management Ppt PowerPoint Presentation Infographic Template Graphics
This is a dashboard management ppt powerpoint presentation infographic template graphics. This is a three stage process. The stages in this process are business, management, marketing, dashboard.


 Continue with Email

 Home
Home


