Business Snapshot

Agenda Of Transitioning Workstations By Implementing Advanced Equipment And Technology Mockup PDF
This is a agenda of transitioning workstations by implementing advanced equipment and technology mockup pdf. template with various stages. Focus and dispense information on two stages using this creative set, that comes with editable features. It contains large content boxes to add your information on topics like agenda of transitioning workstations by implementing advanced equipment and technology. You can also showcase facts, figures, and other relevant content using this PPT layout. Grab it now.
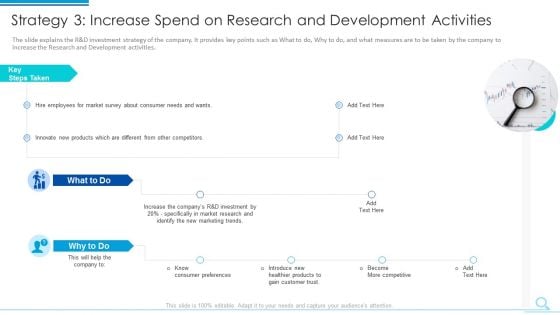
Strategy 3 Increase Spend On Research And Development Activities Clipart PDF
This is a strategy 3 increase spend on research and development activities clipart pdf template with various stages. Focus and dispense information on two stages using this creative set, that comes with editable features. It contains large content boxes to add your information on topics like strategy 3 increase spend on research and development activities. You can also showcase facts, figures, and other relevant content using this PPT layout. Grab it now.
Vendor Assessment To Reduce Purchasing Risk Vector Icon Ppt Icon Template PDF
Presenting vendor assessment to reduce purchasing risk vector icon ppt icon template pdf. to dispense important information. This template comprises three stages. It also presents valuable insights into the topics including vendor assessment to reduce purchasing risk vector icon. This is a completely customizable PowerPoint theme that can be put to use immediately. So, download it and address the topic impactfully.
Vendor Selection Process Vector Icon Ppt Layouts Summary PDF
Presenting vendor selection process vector icon ppt layouts summary pdf. to dispense important information. This template comprises three stages. It also presents valuable insights into the topics including vendor selection process vector icon. This is a completely customizable PowerPoint theme that can be put to use immediately. So, download it and address the topic impactfully.
Internal Audit Strategy With Magnifying Glass Vector Icon Ppt PowerPoint Presentation Slides Mockup PDF
Presenting internal audit strategy with magnifying glass vector icon ppt powerpoint presentation slides mockup pdf to dispense important information. This template comprises four stages. It also presents valuable insights into the topics including internal audit strategy with magnifying glass vector icon. This is a completely customizable PowerPoint theme that can be put to use immediately. So, download it and address the topic impactfully.
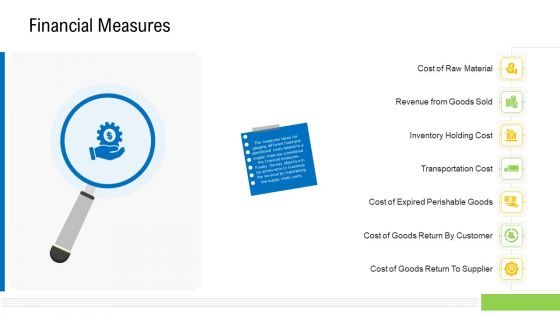
Viable Logistics Network Management Financial Measures Inspiration PDF
This is a viable logistics network management eoq cost model structure pdf template with various stages. Focus and dispense information on seven stages using this creative set, that comes with editable features. It contains large content boxes to add your information on topics like eoq cost model. You can also showcase facts, figures, and other relevant content using this PPT layout. Grab it now.
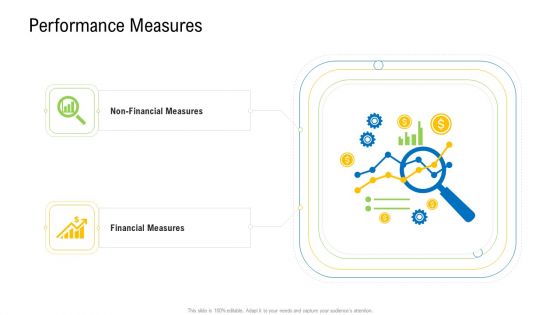
Viable Logistics Network Management Performance Measures Background PDF
This is a viable logistics network management non financial measures introduction pdf template with various stages. Focus and dispense information on two stages using this creative set, that comes with editable features. It contains large content boxes to add your information on topics like performance measures. You can also showcase facts, figures, and other relevant content using this PPT layout. Grab it now.
Building Quality Inspection Icon With Magnifying Glass Ppt PowerPoint Presentation File Design Ideas PDF
Presenting Building Quality Inspection Icon With Magnifying Glass Ppt PowerPoint Presentation File Design Ideas PDF to dispense important information. This template comprises three stages. It also presents valuable insights into the topics including Building Quality, Inspection Icon, Magnifying Glass. This is a completely customizable PowerPoint theme that can be put to use immediately. So, download it and address the topic impactfully.
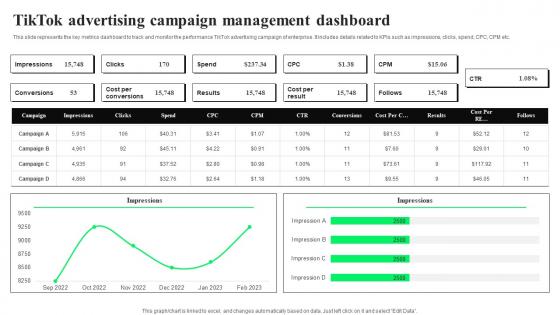
TikTok Advertising Campaign Management TikTok Advertising Strategies To Provide Effective Demonstration Pdf
This slide represents the key metrics dashboard to track and monitor the performance TikTok advertising campaign of enterprise. It includes details related to KPIs such as impressions, clicks, spend, CPC, CPM etc. Create an editable TikTok Advertising Campaign Management TikTok Advertising Strategies To Provide Effective Demonstration Pdf that communicates your idea and engages your audience. Whether you are presenting a business or an educational presentation, pre designed presentation templates help save time. TikTok Advertising Campaign Management TikTok Advertising Strategies To Provide Effective Demonstration Pdf is highly customizable and very easy to edit, covering many different styles from creative to business presentations. Slidegeeks has creative team members who have crafted amazing templates. So, go and get them without any delay. This slide represents the key metrics dashboard to track and monitor the performance TikTok advertising campaign of enterprise. It includes details related to KPIs such as impressions, clicks, spend, CPC, CPM etc.
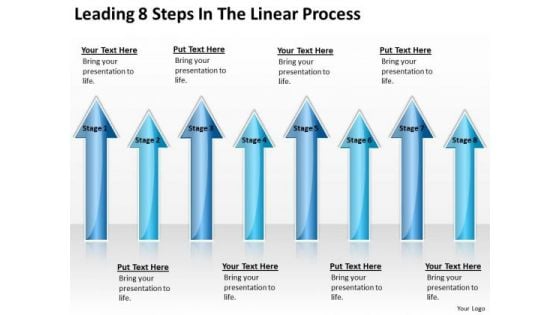
Massively Parallel Processing Database PowerPoint Templates Ppt Backgrounds For Slides
We present our massively parallel processing database PowerPoint templates PPT backgrounds for slides.Download and present our Arrows PowerPoint Templates because Our PowerPoint Templates and Slides are effectively colour coded to prioritise your plans They automatically highlight the sequence of events you desire. Download our Business PowerPoint Templates because you should Whip up a frenzy with our PowerPoint Templates and Slides. They will fuel the excitement of your team. Download and present our Marketing PowerPoint Templates because our PowerPoint Templates and Slides are the string of your bow. Fire of your ideas and conquer the podium. Present our Shapes PowerPoint Templates because you should Whip up a frenzy with our PowerPoint Templates and Slides. They will fuel the excitement of your team. Download and present our Success PowerPoint Templates because You will get more than you ever bargained for. Use these PowerPoint slides for presentations relating to abstract, account, achievement, arrow, background, business, calculation, company, data, design, development, diagram, document, earnings, finance, future, gain, global, graph, graphic, grow, growth, icon, ideas, illustration, information, isolated, marketing, money, number, office, part, pie, plan, presentation, profit, progress, reflection, report, results, rise, shiny, sign, statistic, success, symbol, vector. The prominent colors used in the PowerPoint template are Blue navy, Blue, White. People tell us our massively parallel processing database PowerPoint templates PPT backgrounds for slides are incredible easy to use. People tell us our calculation PowerPoint templates and PPT Slides will make the presenter look like a pro even if they are not computer savvy. Presenters tell us our massively parallel processing database PowerPoint templates PPT backgrounds for slides are designed by professionals We assure you our background PowerPoint templates and PPT Slides are specially created by a professional team with vast experience. They diligently strive to come up with the right vehicle for your brilliant Ideas. Presenters tell us our massively parallel processing database PowerPoint templates PPT backgrounds for slides look good visually. Professionals tell us our company PowerPoint templates and PPT Slides are incredible easy to use. Present your views with our Massively Parallel Processing Database PowerPoint Templates Ppt Backgrounds For Slides. You will come out on top.
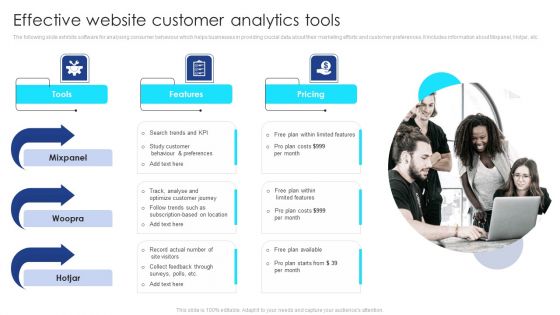
Effective Website Customer Analytics Tools Microsoft PDF
The following slide exhibits software for analysing consumer behaviour which helps businesses in providing crucial data about their marketing efforts and customer preferences. It includes information about Mixpanel, Hotjar, etc. Persuade your audience using this Effective Website Customer Analytics Tools Microsoft PDF. This PPT design covers three stages, thus making it a great tool to use. It also caters to a variety of topics including Tools, Features, Pricing. Download this PPT design now to present a convincing pitch that not only emphasizes the topic but also showcases your presentation skills.

Strategy Analytics Ppt Layout Powerpoint Slide
This is a strategy analytics ppt layout powerpoint slide. This is a four stage process. The stages in this process are team, data, processes, data analysis.
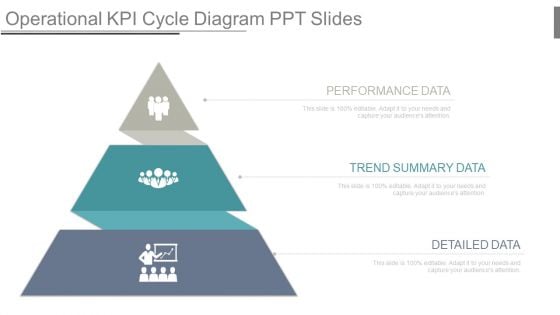
Operational Kpi Cycle Diagram Ppt Slides
This is a operational kpi cycle diagram ppt slides. This is a three stage process. The stages in this process are performance data, trend summary data, detailed data.
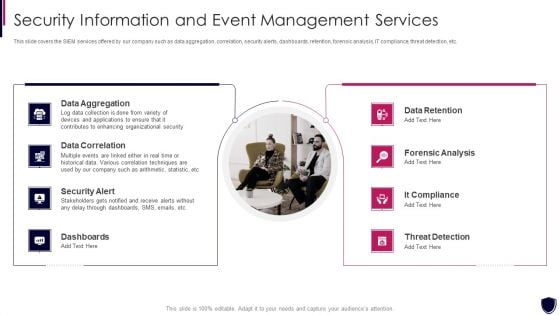
Enhancing Cyber Safety With Vulnerability Administration Security Information And Event Management Inspiration PDF
This slide covers the SIEM services offered by our company such as data aggregation, correlation, security alerts, dashboards, retention, forensic analysis, IT compliance, threat detection, etc. Presenting enhancing cyber safety with vulnerability administration security information and event management inspiration pdf to provide visual cues and insights. Share and navigate important information on two stages that need your due attention. This template can be used to pitch topics like data retention, forensic analysis, dashboards, data correlation, data aggregation. In addtion, this PPT design contains high resolution images, graphics, etc, that are easily editable and available for immediate download.
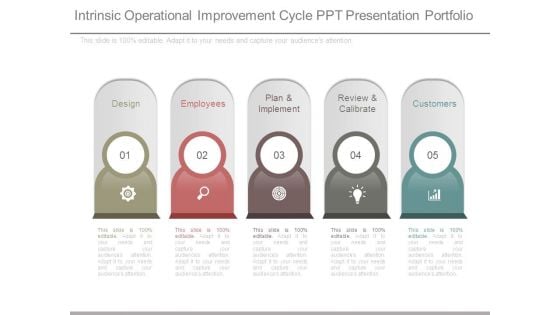
Intrinsic Operational Improvement Cycle Ppt Presentation Portfolio
This is a intrinsic operational improvement cycle ppt presentation portfolio. This is a five stage process. The stages in this process are design, employees, plan and implement, review and calibrate, customers.
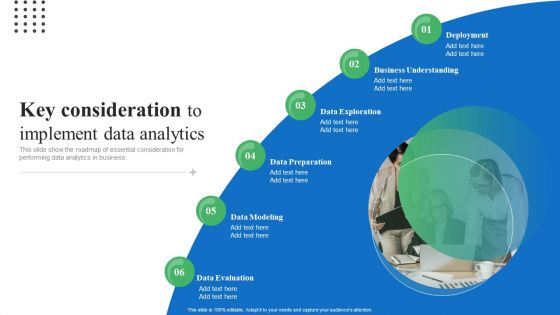
Toolkit For Data Science And Analytics Transition Key Consideration To Implement Data Analytics Guidelines PDF
This slide show the roadmap of essential consideration for performing data analytics in business. Do you have an important presentation coming up Are you looking for something that will make your presentation stand out from the rest Look no further than Toolkit For Data Science And Analytics Transition Key Consideration To Implement Data Analytics Guidelines PDF. With our professional designs, you can trust that your presentation will pop and make delivering it a smooth process. And with Slidegeeks, you can trust that your presentation will be unique and memorable. So why wait Grab Toolkit For Data Science And Analytics Transition Key Consideration To Implement Data Analytics Guidelines PDF today and make your presentation stand out from the rest.
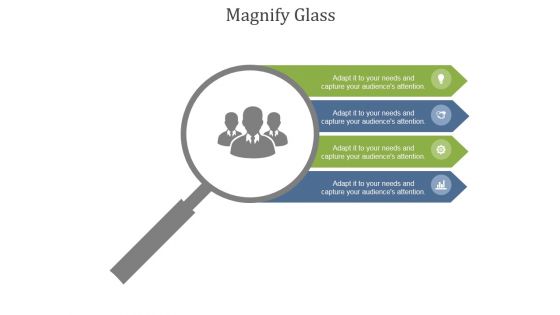
Magnify Glass Ppt PowerPoint Presentation Themes
This is a magnify glass ppt powerpoint presentation themes. This is a four stage process. The stages in this process are magnifier, search, analysis, marketing, strategy, success.
Monitoring The Market Efforts Commercial Activities Marketing Tools Icons PDF
Purpose of the following slide is to show the marketing efforts of the organization as it highlights the overview of the campaign, digital actions and lead generated. This is a monitoring the market efforts commercial activities marketing tools icons pdf template with various stages. Focus and dispense information on six stages using this creative set, that comes with editable features. It contains large content boxes to add your information on topics like monitoring the market efforts. You can also showcase facts, figures, and other relevant content using this PPT layout. Grab it now.
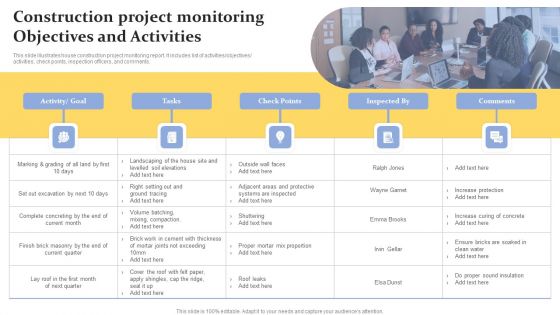
Construction Project Monitoring Objectives And Activities Template PDF
This slide illustrates house construction project monitoring report. It includes list of activities objectives activities, check points, inspection officers, and comments. Persuade your audience using this Construction Project Monitoring Objectives And Activities Template PDF. This PPT design covers Five stages, thus making it a great tool to use. It also caters to a variety of topics including Increase Protection, Soaked In Clean Water. Download this PPT design now to present a convincing pitch that not only emphasizes the topic but also showcases your presentation skills.
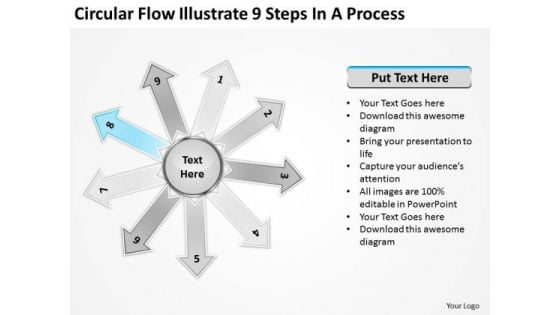
Circular Flow Illustrate 9 Steps In Process Ppt Motion PowerPoint Slides
We present our circular flow illustrate 9 steps in process ppt Motion PowerPoint Slides.Present our Process and flows PowerPoint Templates because You can Connect the dots. Fan expectations as the whole picture emerges. Use our Business PowerPoint Templates because this template can project the path to sucess that you have charted. Download and present our Marketing PowerPoint Templates because customer satisfaction is a mantra of the marketplace. Building a loyal client base is an essential element of your business. Use our Flow charts PowerPoint Templates because they will help you to organise the logic of your views. Use our Arrows PowerPoint Templates because clear thnking is your strength, transmit your thoughts to your eager team.Use these PowerPoint slides for presentations relating to Arrow, gray, business, circle, circular, concept, cycle, flow, four, graphic, icon, illustration, part, presentation, process, recycle, recycled, rendered, repeat, repetitive, reuse, round, symbol. The prominent colors used in the PowerPoint template are Blue, Black, White. People tell us our circular flow illustrate 9 steps in process ppt Motion PowerPoint Slides are Fashionable. We assure you our circle PowerPoint templates and PPT Slides are Cheerful. PowerPoint presentation experts tell us our circular flow illustrate 9 steps in process ppt Motion PowerPoint Slides are Fun. You can be sure our circle PowerPoint templates and PPT Slides are Attractive. Professionals tell us our circular flow illustrate 9 steps in process ppt Motion PowerPoint Slides are No-nonsense. Use our business PowerPoint templates and PPT Slides are Multicolored. Discover growth with our Circular Flow Illustrate 9 Steps In Process Ppt Motion PowerPoint Slides. Download without worries with our money back guaranteee.
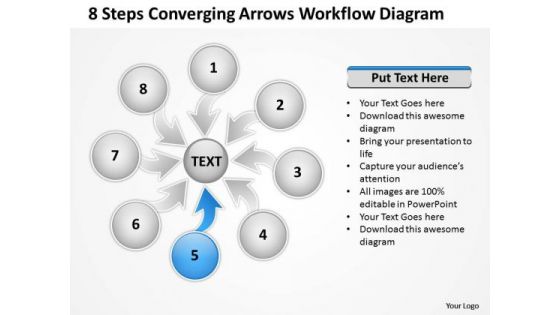
8 Steps Converging Arrows Workflow Diagram Ppt Process Software PowerPoint Slides
We present our 8 steps converging arrows workflow diagram ppt Process Software PowerPoint Slides.Download and present our Flow Charts PowerPoint Templates because your brain is always churning out ideas like cogs in a wheel. Present our Process and Flows PowerPoint Templates because You can Connect the dots. Fan expectations as the whole picture emerges. Download and present our Business PowerPoint Templates because this layout helps you to bring some important aspects of your business process to the notice of all concerned. Streamline the flow of information across the board. Download and present our Marketing PowerPoint Templates because customer satisfaction is a mantra of the marketplace. Building a loyal client base is an essential element of your business. Use our Shapes PowerPoint Templates because you will be able to Highlight these individual targets and the paths to their achievement.Use these PowerPoint slides for presentations relating to Arrows, Business, Central, Centralized, Chart, Circle, Circular, Circulation, Design, Diagram, Executive, Icon, Idea, Illustration, Pointing, Procedure, Process, Resource, Sequence, Sequential, Seven, Square, Strategy, Template. The prominent colors used in the PowerPoint template are Blue, White, Gray. PowerPoint presentation experts tell us our 8 steps converging arrows workflow diagram ppt Process Software PowerPoint Slides are Liberated. The feedback we get is that our Circulation PowerPoint templates and PPT Slides are Dazzling. Presenters tell us our 8 steps converging arrows workflow diagram ppt Process Software PowerPoint Slides are Magical. Presenters tell us our Design PowerPoint templates and PPT Slides are Tasteful. Professionals tell us our 8 steps converging arrows workflow diagram ppt Process Software PowerPoint Slides are Exuberant. The feedback we get is that our Centralized PowerPoint templates and PPT Slides are the best it can get when it comes to presenting. Our 8 Steps Converging Arrows Workflow Diagram Ppt Process Software PowerPoint Slides don't fiddle with facts. They are fearlessly factual.
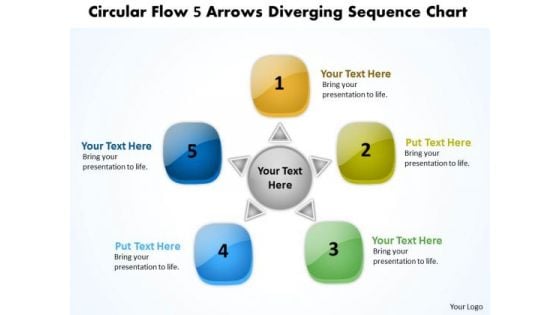
Circular Flow 5 Arrows Diverging Sequence Chart Cycle PowerPoint Slides
We present our circular flow 5 arrows diverging sequence chart Cycle PowerPoint Slides.Download our Boxes PowerPoint Templates because strengthen your relationship with your present customers and likely future ones as the occasion has an intrinsic business potential. Present our Business PowerPoint Templates because a lot of dissimilar elements needing to gel to strike the deal. Present our Arrows PowerPoint Templates because you can Step by step develop the entire picture and project it onto their minds. Present our Circle Charts PowerPoint Templates because you can Amplify your views, ideas and thoughts from very basic aspects to the highly technical and complicated issus using this template as a tool. Download and present our Flow Charts PowerPoint Templates because you can Amplify your views, ideas and thoughts from very basic aspects to the highly technical and complicated issus using this template as a tool.Use these PowerPoint slides for presentations relating to abstract, advertising, arrow, artwork, backdrop, background, banner, brochure, business, button, card, circle, color, concept, corporate, creative, design, form, graphic, histogram, icons, illustration, industrial, infographic, information, label, layout, leaflet, menu, number, options, paper, pattern, pictogram, presentation, product, promotion, symbol, tab, tag, team, teamwork, technology, template, text, vector, version, web, web design, website. The prominent colors used in the PowerPoint template are Green, Blue, Yellow. Presenters tell us our circular flow 5 arrows diverging sequence chart Cycle PowerPoint Slides are Charming. You can be sure our business PowerPoint templates and PPT Slides are Elevated. Professionals tell us our circular flow 5 arrows diverging sequence chart Cycle PowerPoint Slides are Attractive. People tell us our banner PowerPoint templates and PPT Slides are Adorable. People tell us our circular flow 5 arrows diverging sequence chart Cycle PowerPoint Slides are Nice. Professionals tell us our backdrop PowerPoint templates and PPT Slides are Adorable. Lighten your workload with our Circular Flow 5 Arrows Diverging Sequence Chart Cycle PowerPoint Slides. Make sure your presentation gets the attention it deserves.
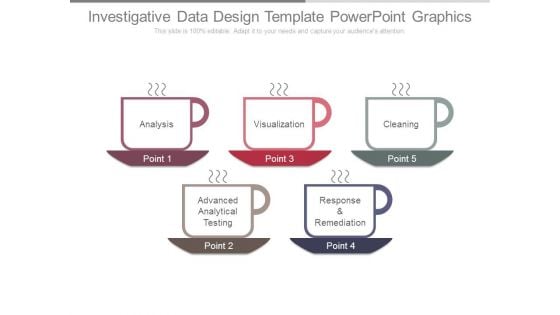
Investigative Data Design Template Powerpoint Graphics
This is a investigative data design template powerpoint graphics. This is a five stage process. The stages in this process are analysis, visualization, cleaning, response and remediation, advanced analytical testing.
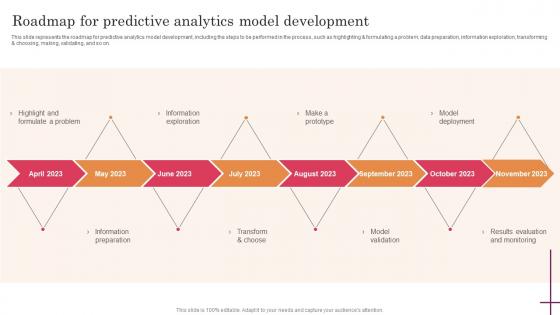
Roadmap For Predictive Analytics Model Predictive Analytics For Improved Rules Pdf
This slide represents the roadmap for predictive analytics model development, including the steps to be performed in the process, such as highlighting and formulating a problem, data preparation, information exploration, transforming and choosing, making, validating, and so on. Create an editable Roadmap For Predictive Analytics Model Predictive Analytics For Improved Rules Pdf that communicates your idea and engages your audience. Whether you are presenting a business or an educational presentation, pre-designed presentation templates help save time. Roadmap For Predictive Analytics Model Predictive Analytics For Improved Rules Pdf is highly customizable and very easy to edit, covering many different styles from creative to business presentations. Slidegeeks has creative team members who have crafted amazing templates. So, go and get them without any delay. This slide represents the roadmap for predictive analytics model development, including the steps to be performed in the process, such as highlighting and formulating a problem, data preparation, information exploration, transforming and choosing, making, validating, and so on.

Factors Contributing To Text Analytics Necessity PPT Sample SS
This slide outlines factors contributing to the necessity of text analytics, such as unstructured data, business insights, decision-making, automation, etc. Formulating a presentation can take up a lot of effort and time, so the content and message should always be the primary focus. The visuals of the PowerPoint can enhance the presenters message, so our Factors Contributing To Text Analytics Necessity PPT Sample SS was created to help save time. Instead of worrying about the design, the presenter can concentrate on the message while our designers work on creating the ideal templates for whatever situation is needed. Slidegeeks has experts for everything from amazing designs to valuable content, we have put everything into Factors Contributing To Text Analytics Necessity PPT Sample SS This slide outlines factors contributing to the necessity of text analytics, such as unstructured data, business insights, decision-making, automation, etc.
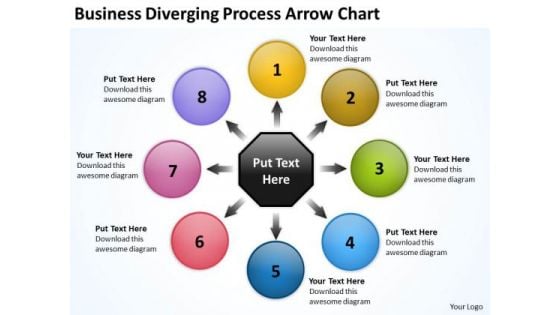
Templates Diverging Process Arrow Chart Cycle PowerPoint
We present our templates diverging process arrow chart Cycle PowerPoint.Download and present our Circle Charts PowerPoint Templates because you have a good grasp of the essentials of such a venture. Alternate energy presents an array of opportunities. Use our Arrows PowerPoint Templates because you watch them slowly start to savour the flavour you have served them. Download and present our Business PowerPoint Templates because you have analysed many global markets and come up with possibilities. Highlight the pros and cons of other likely business oppurtunities. Present our Shapes PowerPoint Templates because there is a crucial aspect that requires extra attention. Present our Flow Charts PowerPoint Templates because you can Step by step develop the entire picture and project it onto their minds.Use these PowerPoint slides for presentations relating to 3d, adapt, adaptation, advancing, background, business, challenge, change, communication, compass, concept, different, direct, direction, diverge, evolving, find, future, futuristic, graphic, idea, innovative, lead, needle, new, opportunity, point, progress, progressive, render, rethinking, technology, traditional, unique, word. The prominent colors used in the PowerPoint template are Red, Purple, Pink. Customers tell us our templates diverging process arrow chart Cycle PowerPoint are Tranquil. PowerPoint presentation experts tell us our business PowerPoint templates and PPT Slides are Fashionable. People tell us our templates diverging process arrow chart Cycle PowerPoint are Second to none. People tell us our advancing PowerPoint templates and PPT Slides are Striking. Customers tell us our templates diverging process arrow chart Cycle PowerPoint are Spiffy. People tell us our challenge PowerPoint templates and PPT Slides are Upbeat. Educate teams with our Templates Diverging Process Arrow Chart Cycle PowerPoint. Download without worries with our money back guaranteee.
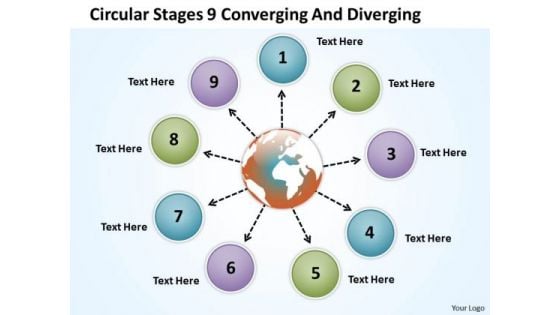
Circular Stages 9 Converging And Diverging Flow Process PowerPoint Slides
We present our circular stages 9 converging and diverging Flow Process PowerPoint Slides.Use our Circle Charts PowerPoint Templates because you understand the ailment and how to fight it. Download and present our Arrows PowerPoint Templates because some opportunities are bound to be highly profitable for you to follow up. Present our Globe PowerPoint Templates because you can get advantage to prioritise your ideas. Download and present our Business PowerPoint Templates because project your ideas to you colleagues and complete the full picture. Present our Flow Charts PowerPoint Templates because this diagram helps in examine each brilliant thought in thorough detail highlighting all the pros and cons as minutely as possible.Use these PowerPoint slides for presentations relating to abstract, arrow, business, chart, circle, circular, collection, color, continuity, cycle, decoration, design, diagram, dimensional, direction, element, flow, glossy, graph, icon, illustration, isolated, modern, motion, movement, pattern, pie, recycling, repetition, report, ring, round, scheme, section, set, shape, shiny, sign, slice, spinning, symbol, turn, vector, web. The prominent colors used in the PowerPoint template are Purple, Blue, Green. Presenters tell us our circular stages 9 converging and diverging Flow Process PowerPoint Slides are Efficient. You can be sure our business PowerPoint templates and PPT Slides will make the presenter look like a pro even if they are not computer savvy. Professionals tell us our circular stages 9 converging and diverging Flow Process PowerPoint Slides are Luxuriant. People tell us our business PowerPoint templates and PPT Slides are One-of-a-kind. People tell us our circular stages 9 converging and diverging Flow Process PowerPoint Slides are Awesome. Professionals tell us our color PowerPoint templates and PPT Slides are Reminiscent. Level the playing field with our Circular Stages 9 Converging And Diverging Flow Process PowerPoint Slides. Make sure your presentation gets the attention it deserves.
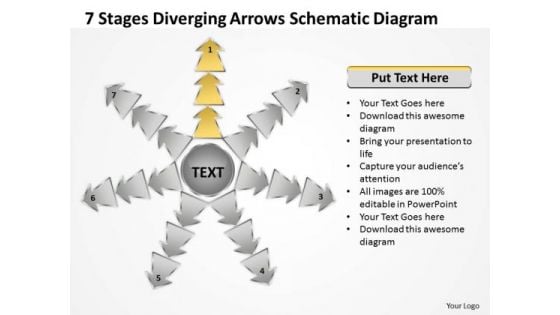
7 Stages Diverging Arrows Schematic Diagram Ppt Charts And Networks PowerPoint Slides
We present our 7 stages diverging arrows schematic diagram ppt Charts and Networks PowerPoint Slides.Download our Marketing PowerPoint Templates because Our PowerPoint Templates and Slides are Clear and concise. Use them and dispel any doubts your team may have. Download and present our Shapes PowerPoint Templates because You can Connect the dots. Fan expectations as the whole picture emerges. Present our Arrows PowerPoint Templates because this Slide offers an excellent background to build up the various stages of your business process. Use our Business PowerPoint Templates because you have analysed many global markets and come up with possibilities. Highlight the pros and cons of other likely business oppurtunities. Download and present our Process and Flows PowerPoint Templates because spreading the light of knowledge around you will clear the doubts and enlighten the questioning minds with your brilliance and ability.Use these PowerPoint slides for presentations relating to Arrows, Business, Chart, Cyclic, Data, Diagram, Financial, Goal, Graph, Illustration, Info, Information, Marketing, Model, Option, Part, Pie, Presentation, Process, Result, Sphere, Statistics. The prominent colors used in the PowerPoint template are Yellow, Gray, Black. The feedback we get is that our 7 stages diverging arrows schematic diagram ppt Charts and Networks PowerPoint Slides are Breathtaking. People tell us our Graph PowerPoint templates and PPT Slides are Splendid. Presenters tell us our 7 stages diverging arrows schematic diagram ppt Charts and Networks PowerPoint Slides are Functional. Use our Graph PowerPoint templates and PPT Slides will make the presenter successul in his career/life. Use our 7 stages diverging arrows schematic diagram ppt Charts and Networks PowerPoint Slides are visually appealing. Use our Graph PowerPoint templates and PPT Slides are Dynamic. Our 7 Stages Diverging Arrows Schematic Diagram Ppt Charts And Networks PowerPoint Slides are committed to benefit you. They ensure your thoughts get the credit.

Four Steps To Meet Targets PowerPoint Slides Presentation Diagrams Templates
We present our Four steps to meet Targets powerpoint slides presentation diagrams templates.Download our Business PowerPoint Templates because this diagram can set an example to enthuse your team with the passion and fervour of your ideas. Present our Circle Charts PowerPoint Templates because this slide helps you to give your team an overview of your capability and insight into the minute details of the overall picture highlighting the interdependence at every operational level. Download our Signs PowerPoint Templates because they are logical, accurate and to the point. Download our Design PowerPoint Templates because you know your business and have a vision for it. Download our Marketing PowerPoint Templates because you can Educate your listeners on the means to keep it ticking over.Use these PowerPoint slides for presentations relating to abstract, background, blue, box, brochure, business, catalog, chart, circle, color, concept, cross, description, design, development, diagram, five, goals, graphic, green, guide, illustration, isolated, item, management, marketing, model, modern, navigation, new, orange, paper, parts, pie, plans, presentation, red, reports, round, sign, symbol, team, template, text, title, vector, web, website, wheel, yellow. The prominent colors used in the PowerPoint template are Yellow, Green, Blue. People tell us our Four steps to meet Targets powerpoint slides presentation diagrams templates are Precious. The feedback we get is that our business PowerPoint templates and PPT Slides are effectively colour coded to prioritise your plans They automatically highlight the sequence of events you desire. Professionals tell us our Four steps to meet Targets powerpoint slides presentation diagrams templates are visually appealing. Customers tell us our brochure PowerPoint templates and PPT Slides are Ultra. The feedback we get is that our Four steps to meet Targets powerpoint slides presentation diagrams templates are topically designed to provide an attractive backdrop to any subject. Professionals tell us our blue PowerPoint templates and PPT Slides are Upbeat. Our Four Steps To Meet Targets PowerPoint Slides Presentation Diagrams Templates fall over backwards to get you there. They strive to ensure you achieve your aim.
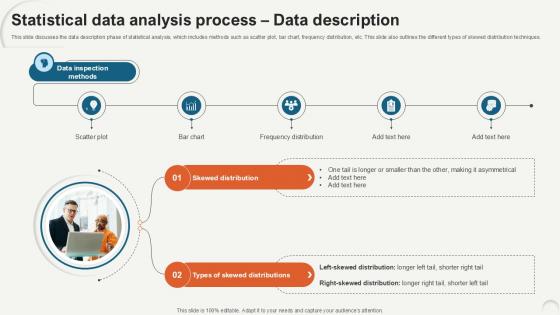
Statistical Data Analysis Process Data Description Ppt Example
This slide discusses the data description phase of statistical analysis, which includes methods such as scatter plot, bar chart, frequency distribution, etc. This slide also outlines the different types of skewed distribution techniques. Create an editable Statistical Data Analysis Process Data Description Ppt Example that communicates your idea and engages your audience. Whether you are presenting a business or an educational presentation, pre-designed presentation templates help save time. Statistical Data Analysis Process Data Description Ppt Example is highly customizable and very easy to edit, covering many different styles from creative to business presentations. Slidegeeks has creative team members who have crafted amazing templates. So, go and get them without any delay. This slide discusses the data description phase of statistical analysis, which includes methods such as scatter plot, bar chart, frequency distribution, etc. This slide also outlines the different types of skewed distribution techniques.
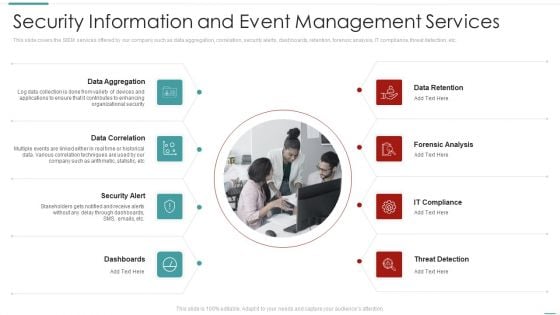
Risk Recognition Automation Security Information And Event Management Services Ppt Slides Demonstration PDF
This slide covers the SIEM services offered by our company such as data aggregation, correlation, security alerts, dashboards, retention, forensic analysis, IT compliance, threat detection, etc. Presenting risk recognition automation security information and event management services ppt slides demonstration pdf to provide visual cues and insights. Share and navigate important information on eight stages that need your due attention. This template can be used to pitch topics like data aggregation, data correlation, security alert, dashboards, data retention. In addtion, this PPT design contains high resolution images, graphics, etc, that are easily editable and available for immediate download.
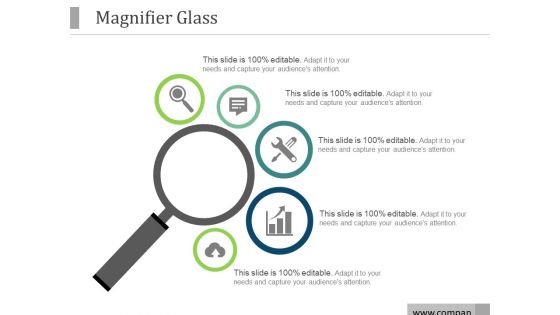
Magnifier Glass Ppt PowerPoint Presentation Ideas
This is a magnifier glass ppt powerpoint presentation ideas. This is a five stage process. The stages in this process are magnifier, icons, process, strategy, success.
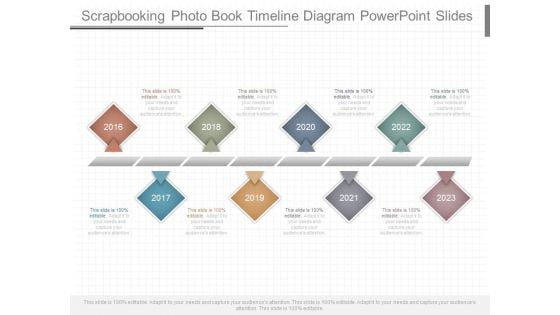
Scrapbooking Photo Book Timeline Diagram Powerpoint Slides
This is a scrapbooking photo book timeline diagram powerpoint slides. This is a eight stage process. The stages in this process are business, marketing, years, timeline, future, success.
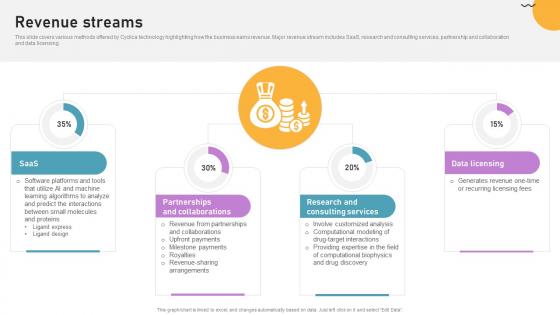
Revenue Streams Cloud Based Predictive Analytics Software Pitch Deck
This slide covers various methods offered by Cyclica technology highlighting how the business earns revenue. Major revenue stream includes SaaS, research and consulting services, partnership and collaboration and data licensing. Coming up with a presentation necessitates that the majority of the effort goes into the content and the message you intend to convey. The visuals of a PowerPoint presentation can only be effective if it supplements and supports the story that is being told. Keeping this in mind our experts created Revenue Streams Cloud Based Predictive Analytics Software Pitch Deck to reduce the time that goes into designing the presentation. This way, you can concentrate on the message while our designers take care of providing you with the right template for the situation. This slide covers various methods offered by Cyclica technology highlighting how the business earns revenue. Major revenue stream includes SaaS, research and consulting services, partnership and collaboration and data licensing.
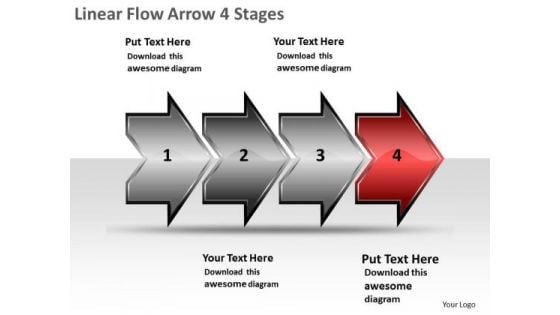
Linear Flow Arrow 4 Stages Online Flowchart Maker PowerPoint Slides
We present our linear flow arrow 4 stages online flowchart maker PowerPoint Slides. Use our Success PowerPoint Templates because; demonstrate how you think out of the box. Use our Arrows PowerPoint Templates because, The Venn graphic comprising interlinking circles geometrically demonstrate how various functions operating independently, to a large extent, are essentially interdependent. Use our Business PowerPoint Templates because, Marketing Strategy Business Template: - Maximizing sales of your product is the intended destination. Use our Shapes PowerPoint Templates because; Use this template containing to highlight the key issues of your presentation. Use our Process and Flows PowerPoint Templates because, there are different paths to gain the necessary knowledge to achieved it. Use these PowerPoint slides for presentations relating to 3d, abstract, around, arrows, business, center, circle, circular, concept, connections, curve, cycle, directions, distribution, illustration, management, middle, objects, plan, process, recycle, rounded, shadows, space, system. The prominent colors used in the PowerPoint template are Red, Black, and Gray Be as fastidious as you want to be. Our Linear Flow Arrow 4 Stages Online Flowchart Maker PowerPoint Slides will be more than a match.

Key Metrics Ppt PowerPoint Presentation Professional Slideshow
This is a key metrics ppt powerpoint presentation professional slideshow. This is a five stage process. The stages in this process are new customers per month, on time delivery, customer satisfaction, lead conversion rate, customer retention rate.
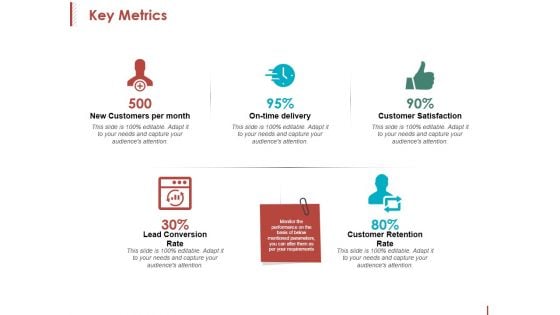
Key Metrics Ppt PowerPoint Presentation Inspiration Format
This is a key metrics ppt powerpoint presentation inspiration format. This is a five stage process. The stages in this process are new customers per month, on time delivery, customer satisfaction, customer retention rate.
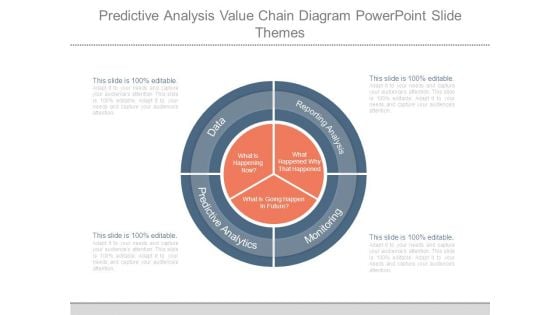
Predictive Analysis Value Chain Diagram Powerpoint Slide Themes
This is a predictive analysis value chain diagram powerpoint slide themes. This is a four stage process. The stages in this process are what is happening now, what is going happen in future, what happened why that happened, data, predictive analytics, reporting analysis, monitoring.

Best Practices For Implementing Prescriptive Developing Strategic Insights Using Big Data Analytics SS V
This slide showcases tips which can be adopted for leveraging prescriptive analytics techniques for driving business outcomes. It provides information regarding cost analysis, data quality and advanced analytics tools. Slidegeeks is here to make your presentations a breeze with Best Practices For Implementing Prescriptive Developing Strategic Insights Using Big Data Analytics SS V With our easy-to-use and customizable templates, you can focus on delivering your ideas rather than worrying about formatting. With a variety of designs to choose from, you are sure to find one that suits your needs. And with animations and unique photos, illustrations, and fonts, you can make your presentation pop. So whether you are giving a sales pitch or presenting to the board, make sure to check out Slidegeeks first This slide showcases tips which can be adopted for leveraging prescriptive analytics techniques for driving business outcomes. It provides information regarding cost analysis, data quality and advanced analytics tools.
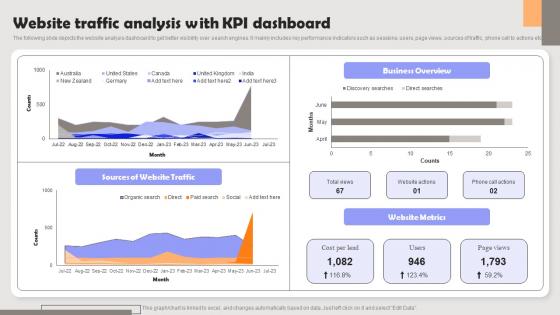
Improving PPC Campaign Results Website Traffic Analysis With KPI Formats Pdf
The following slide depicts the website analysis dashboard to get better visibility over search engines. It mainly includes key performance indicators such as sessions, users, page views, sources of traffic, phone call to actions etc. Create an editable Improving PPC Campaign Results Website Traffic Analysis With KPI Formats Pdf that communicates your idea and engages your audience. Whether you are presenting a business or an educational presentation, pre-designed presentation templates help save time. Improving PPC Campaign Results Website Traffic Analysis With KPI Formats Pdf is highly customizable and very easy to edit, covering many different styles from creative to business presentations. Slidegeeks has creative team members who have crafted amazing templates. So, go and get them without any delay. The following slide depicts the website analysis dashboard to get better visibility over search engines. It mainly includes key performance indicators such as sessions, users, page views, sources of traffic, phone call to actions etc.
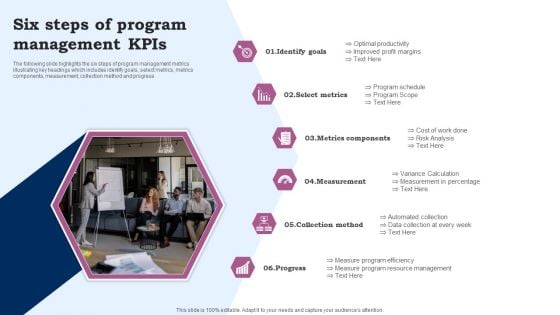
Six Steps Of Program Management Kpis Ppt Infographics Information PDF
The following slide highlights the six steps of program management metrics illustrating key headings which includes identify goals, select metrics, metrics components, measurement, collection method and progress. Presenting Six Steps Of Program Management Kpis Ppt Infographics Information PDF to dispense important information. This template comprises six stages. It also presents valuable insights into the topics including Identify Goals, Select Metrics, Metrics Components. This is a completely customizable PowerPoint theme that can be put to use immediately. So, download it and address the topic impactfully.
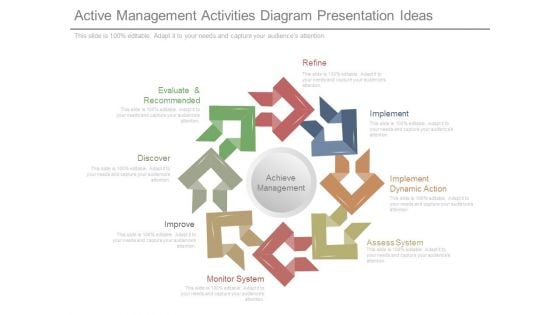
Active Management Activities Diagram Presentation Ideas
This is a active management activities diagram presentation ideas. This is a eight stage process. The stages in this process are achieve management, refine, implement, implement dynamic action, assess system, monitor system, improve, discover, evaluate and recommended.

Stock Photo Multimedia Keys PowerPoint Slide
This image is crafted with multimedia keys icons. Display technology concept in any presentation by using this image. Use this image for business, technology and internet related topics.
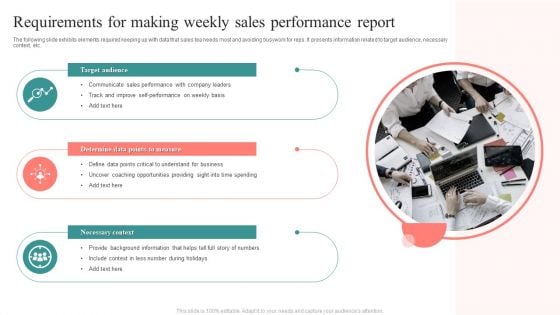
Requirements For Making Weekly Sales Performance Report Inspiration PDF
The following slide exhibits elements required keeping up with data that sales tea needs most and avoiding busywork for reps. It presents information related to target audience, necessary context, etc. Presenting Requirements For Making Weekly Sales Performance Report Inspiration PDF to dispense important information. This template comprises three stages. It also presents valuable insights into the topics including Target Audience, Determine Data, Points To Measure, Necessary Context. This is a completely customizable PowerPoint theme that can be put to use immediately. So, download it and address the topic impactfully.
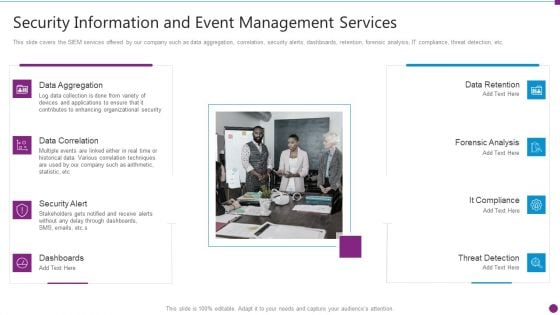
Security Information And Event Management Services Mockup PDF
This slide covers the SIEM services offered by our company such as data aggregation, correlation, security alerts, dashboards, retention, forensic analysis, IT compliance, threat detection, etc. Presenting security information and event management services mockup pdf to provide visual cues and insights. Share and navigate important information on eight stages that need your due attention. This template can be used to pitch topics like data aggregation, data correlation, security alert, dashboards. In addtion, this PPT design contains high resolution images, graphics, etc, that are easily editable and available for immediate download.
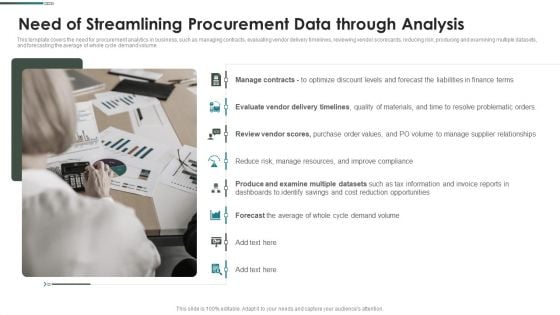
Purchase Assessment Process Need Of Streamlining Procurement Data Through Analysis Information PDF
This template covers the need for procurement analytics in business, such as managing contracts, evaluating vendor delivery timelines, reviewing vendor scorecards, reducing risk, producing and examining multiple datasets, and forecasting the average of whole cycle demand volume. This is a Purchase Assessment Process Need Of Streamlining Procurement Data Through Analysis Information PDF template with various stages. Focus and dispense information on one stage using this creative set, that comes with editable features. It contains large content boxes to add your information on topics like Manage Contracts, Evaluate Vendor, Review Vendor You can also showcase facts, figures, and other relevant content using this PPT layout. Grab it now.
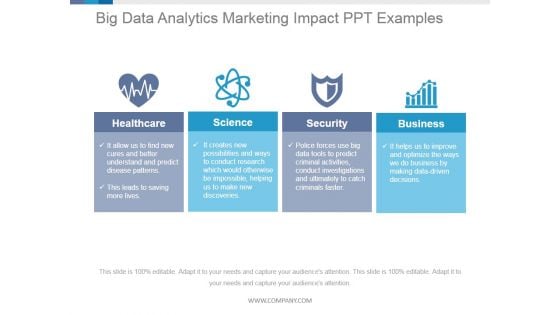
Big Data Analytics Marketing Impact Ppt PowerPoint Presentation Show
This is a big data analytics marketing impact ppt powerpoint presentation show. This is a four stage process. The stages in this process are healthcare, science, security, business.

Fuel Gauge Indicating Empty And Full Levels Ppt PowerPoint Presentation Portfolio Clipart PDF
Presenting fuel gauge indicating empty and full levels ppt powerpoint presentation portfolio clipart pdf to dispense important information. This template comprises one stages. It also presents valuable insights into the topics including fuel gauge indicating empty and full levels. This is a completely customizable PowerPoint theme that can be put to use immediately. So, download it and address the topic impactfully.
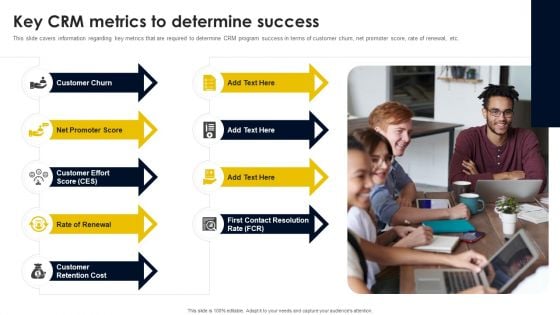
Key CRM Metrics To Determine Success Formats PDF
This slide covers information regarding key metrics that are required to determine CRM program success in terms of customer churn, net promoter score, rate of renewal, etc. Do you know about Slidesgeeks Key CRM Metrics To Determine Success Formats PDF These are perfect for delivering any kind od presentation. Using it, create PowerPoint presentations that communicate your ideas and engage audiences. Save time and effort by using our pre-designed presentation templates that are perfect for a wide range of topic. Our vast selection of designs covers a range of styles, from creative to business, and are all highly customizable and easy to edit. Download as a PowerPoint template or use them as Google Slides themes.
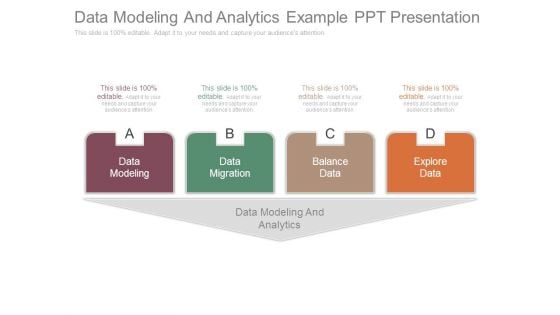
Data Modeling And Analytics Example Ppt Presentation
This is a data modeling and analytics example ppt presentation. This is a four stage process. The stages in this process are data modeling, data migration, balance data, explore data, data modeling and analytics.
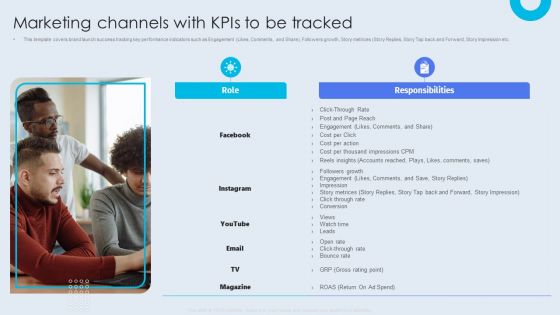
Internal Brand Launch Plan Marketing Channels With Kpis To Be Tracked Portrait PDF
This template covers brand launch success tracking key performance indicators such as Engagement Likes, Comments, and Share, Followers growth, Story metrices Story Replies, Story Tap back and Forward, Story Impression etc.Find a pre-designed and impeccable Internal Brand Launch Plan Marketing Channels With Kpis To Be Tracked Portrait PDF. The templates can ace your presentation without additional effort. You can download these easy-to-edit presentation templates to make your presentation stand out from others. So, what are you waiting for Download the template from Slidegeeks today and give a unique touch to your presentation.
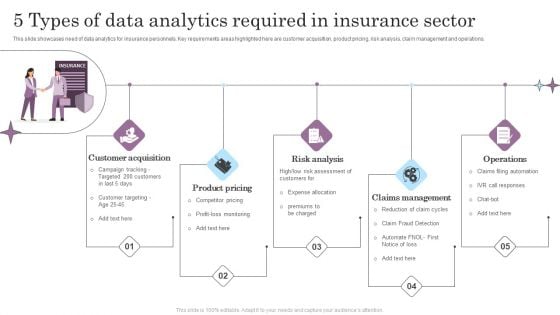
5 Types Of Data Analytics Required In Insurance Sector Background PDF
This slide showcases need of data analytics for insurance personnels. Key requirements areas highlighted here are customer acquisition, product pricing, risk analysis, claim management and operations. Presenting 5 Types Of Data Analytics Required In Insurance Sector Background PDF to dispense important information. This template comprises five stages. It also presents valuable insights into the topics including Risk Analysis, Product Pricing, Customer Acquisition. This is a completely customizable PowerPoint theme that can be put to use immediately. So, download it and address the topic impactfully.

Step 7 Monitor Analytics Implementation For Inventory Using Dashboard Data Analytics SS V
This slide provides a dashboard highlighting inventory performance aimed at helping businesses streamline operations. It covers details on sales orders, invoices, order value, invoice amount, YTD invoice value and sales growth. Welcome to our selection of the Step 7 Monitor Analytics Implementation For Inventory Using Dashboard Data Analytics SS V. These are designed to help you showcase your creativity and bring your sphere to life. Planning and Innovation are essential for any business that is just starting out. This collection contains the designs that you need for your everyday presentations. All of our PowerPoints are 100 percent editable, so you can customize them to suit your needs. This multi-purpose template can be used in various situations. Grab these presentation templates today. This slide provides a dashboard highlighting inventory performance aimed at helping businesses streamline operations. It covers details on sales orders, invoices, order value, invoice amount, YTD invoice value and sales growth.
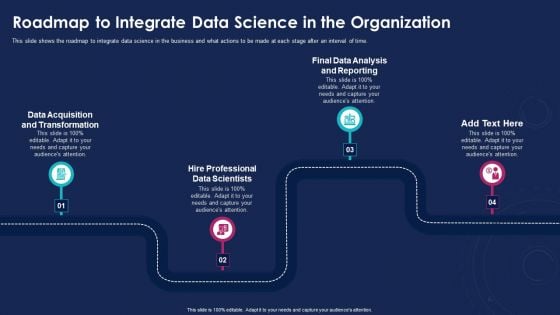
Data Analytics IT Roadmap To Integrate Data Science In The Organization Microsoft PDF
This slide shows the roadmap to integrate data science in the business and what actions to be made at each stage after an interval of time. This is a data analytics it roadmap to integrate data science in the organization microsoft pdf template with various stages. Focus and dispense information on five stages using this creative set, that comes with editable features. It contains large content boxes to add your information on topics like data acquisition and transformation, hire professional data scientists, final data analysis and reporting. You can also showcase facts, figures, and other relevant content using this PPT layout. Grab it now.

Marketing Intelligence Guide For Data Gathering And Analysis Ppt Powerpoint Presentation Complete Deck
Heres another Marketing Intelligence Guide For Data Gathering And Analysis Ppt Powerpoint Presentation Complete Deck that highlights your vision and mission for business. You can customize this template as per your liking and bring your passion and skills in the industry you have chosen to be in under the spotlight. Moreover,you can print this business plan template and share it with your employees to maintain clarity of thought. Click the link below and gain instant access to this complete deck of seventy nine slides. All of this is,of course,made even better with the capability of editability and complete customization that we offer. Download now. Our Marketing Intelligence Guide For Data Gathering And Analysis Ppt Powerpoint Presentation Complete Deck are topically designed to provide an attractive backdrop to any subject. Use them to look like a presentation pro.

Consumer Segmentation Dashboard Ppt Powerpoint Presentation Complete Deck With Slides
This Consumer Segmentation Dashboard Ppt Powerpoint Presentation Complete Deck With Slides acts as backup support for your ideas, vision, thoughts, etc. Use it to present a thorough understanding of the topic. This PPT slideshow can be utilized for both in-house and outside presentations depending upon your needs and business demands. Entailing twelve slides with a consistent design and theme, this template will make a solid use case. As it is intuitively designed, it suits every business vertical and industry. All you have to do is make a few tweaks in the content or any other component to design unique presentations. The biggest advantage of this complete deck is that it can be personalized multiple times once downloaded. The color, design, shapes, and other elements are free to modify to add personal touches. You can also insert your logo design in this PPT layout. Therefore a well-thought and crafted presentation can be delivered with ease and precision by downloading this Consumer Segmentation Dashboard Ppt Powerpoint Presentation Complete Deck With Slides PPT slideshow. Our Consumer Segmentation Dashboard Ppt Powerpoint Presentation Complete Deck With Slides are topically designed to provide an attractive backdrop to any subject. Use them to look like a presentation pro.
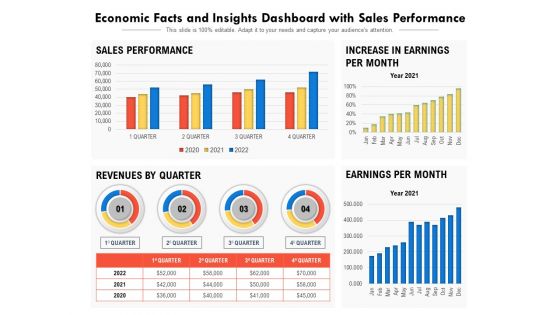
Economic Facts And Insights Dashboard With Sales Performance Ppt PowerPoint Presentation Show Gallery PDF
Showcasing this set of slides titled economic facts and insights dashboard with sales performance ppt powerpoint presentation show gallery pdf. The topics addressed in these templates are sales performance, increase in earnings per month, revenues by quarter, earnings per month. All the content presented in this PPT design is completely editable. Download it and make adjustments in color, background, font etc. as per your unique business setting.
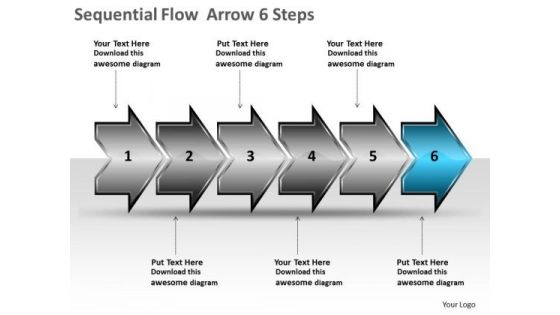
Sequential Flow Arrow 6 Steps Circuit Simulation PowerPoint Slides
We present our sequential flow arrow 6 steps circuit simulation PowerPoint Slides. Use our Arrows PowerPoint Templates because, The Venn graphic comprising interlinking circles geometrically demonstrate how various functions operating independently, to a large extent, are essentially interdependent. Use our Marketing PowerPoint Templates because, Activities which in themselves have many inherent business opportunities. Use our Success PowerPoint Templates because; heighten the anticipation of your audience with this slide listing. Use our Process and Flows PowerPoint Templates because, now fire the arrows to emblazon the desired path by which you will achieve anticipated results. Use our Business PowerPoint Templates because; Show them how to churn out fresh ideas. Use these PowerPoint slides for presentations relating to 3d, Abstract, Around, Arrows, Blue, Border, Business, Center, Circle, Circular, Concept, Connections, Copy, Curve, Cycle, Directions, Distribution, Illustration, Management, Middle, Objects, Pieces, Plan, Pointing, Process, Recycle, Rounded, Shadows, Space, System. The prominent colors used in the PowerPoint template are Blue, Gray, and Black Present the facts with our Sequential Flow Arrow 6 Steps Circuit Simulation PowerPoint Slides. Just download, type and present.
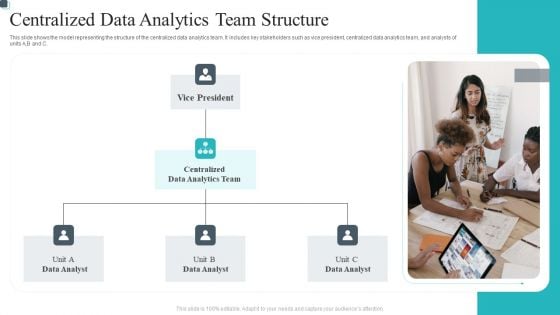
Centralized Data Analytics Team Structure Clipart PDF
This slide shows the model representing the structure of the centralized data analytics team. It includes key stakeholders such as vice president, centralized data analytics team, and analysts of units A,B and C.Persuade your audience using this Centralized Data Analytics Team Structure Clipart PDF. This PPT design coversone stage, thus making it a great tool to use. It also caters to a variety of topics including Vice President, Data Analytics, Analytics Team. Download this PPT design now to present a convincing pitch that not only emphasizes the topic but also showcases your presentation skills.
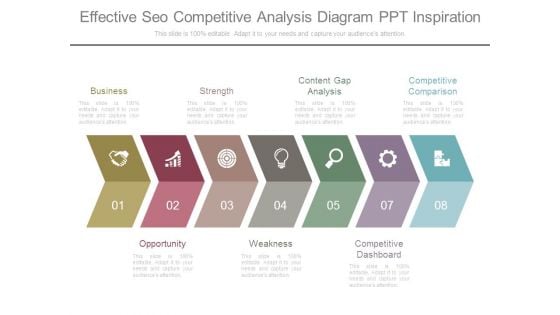
Effective Seo Competitive Analysis Diagram Ppt Inspiration
This is a effective seo competitive analysis diagram ppt inspiration. This is a eight stage process. The stages in this process are business, opportunity, strength, weakness, content gap analysis, competitive dashboard, competitive comparison.


 Continue with Email

 Home
Home


