Business Snapshot

Our Team Photos With Designation Powerpoint Slides
Our above PowerPoint template displays a flexible yet unique design to introduce your team. This PPT slide contains pictures of team members. You may download this PPT slide to present topics like team strategy and success.
Stock Photo Red And Blue Unity Icon Design PowerPoint Slide
This image slide displays red and blue unity icons. Use this image slide in business, technology and social presentations to depict united we all and divide we fall concept. This image slide will help you make professional presentations in no time and at affordable price.

Stock Photo Video Marketing Text On Blue Key PowerPoint Slide
This image slide displays blue color video marketing key with video camera icon. This image slide has been designed with graphic of computer keyboard with video marketing key. Use this image slide in technology, marketing, sales and business. This image slide make your presentations outshine.
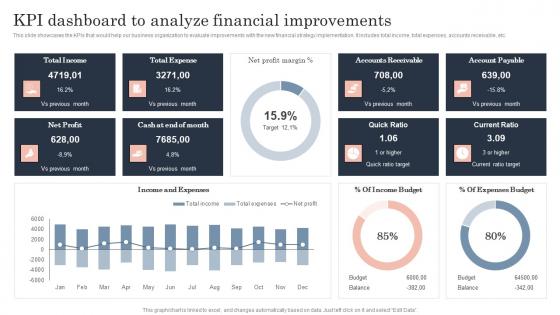
Kpi Dashboard To Analyze Financial Guide To Corporate Financial Growth Plan Designs Pdf
This slide showcases the KPIs that would help our business organization to evaluate improvements with the new financial strategy implementation. It includes total income, total expenses, accounts receivable, etc.Presenting this PowerPoint presentation, titled Kpi Dashboard To Analyze Financial Guide To Corporate Financial Growth Plan Designs Pdf, with topics curated by our researchers after extensive research. This editable presentation is available for immediate download and provides attractive features when used. Download now and captivate your audience. Presenting this Kpi Dashboard To Analyze Financial Guide To Corporate Financial Growth Plan Designs Pdf. Our researchers have carefully researched and created these slides with all aspects taken into consideration. This is a completely customizable Kpi Dashboard To Analyze Financial Guide To Corporate Financial Growth Plan Designs Pdf that is available for immediate downloading. Download now and make an impact on your audience. Highlight the attractive features available with our PPTs. This slide showcases the KPIs that would help our business organization to evaluate improvements with the new financial strategy implementation. It includes total income, total expenses, accounts receivable, etc.
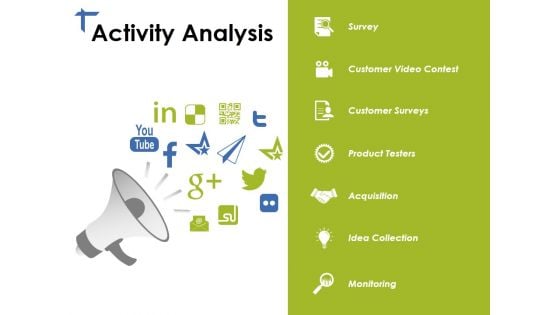
Activity Analysis Ppt PowerPoint Presentation Gallery Guide
This is a activity analysis ppt powerpoint presentation gallery guide. This is a two stage process. The stages in this process are survey, customer surveys, product testers, acquisition, monitoring.
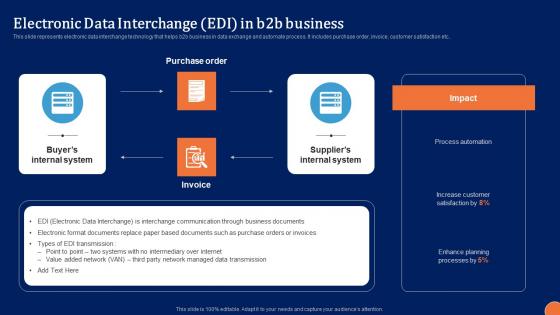
Electronic Data Interchange Digital Platform Administration For B2B Ecommerce Summary Pdf
This slide represents electronic data interchange technology that helps b2b business in data exchange and automate process. It includes purchase order, invoice, customer satisfaction etc.. This modern and well arranged Electronic Data Interchange Digital Platform Administration For B2B Ecommerce Summary Pdf provides lots of creative possibilities. It is very simple to customize and edit with the Powerpoint Software. Just drag and drop your pictures into the shapes. All facets of this template can be edited with Powerpoint, no extra software is necessary. Add your own material, put your images in the places assigned for them, adjust the colors, and then you can show your slides to the world, with an animated slide included. This slide represents electronic data interchange technology that helps b2b business in data exchange and automate process. It includes purchase order, invoice, customer satisfaction etc..
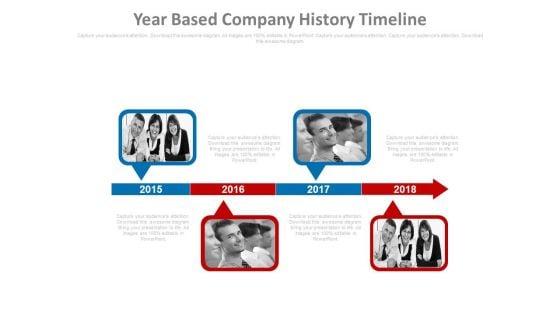
Linear Arrow Timeline With Photos Powerpoint Slides
This PowerPoint template has been designed with graphics of linear arrow timeline with team pictures. You may download this timeline diagram slide to show team progress or the aims of your organizations. Chart the course you intend to take with this slide.
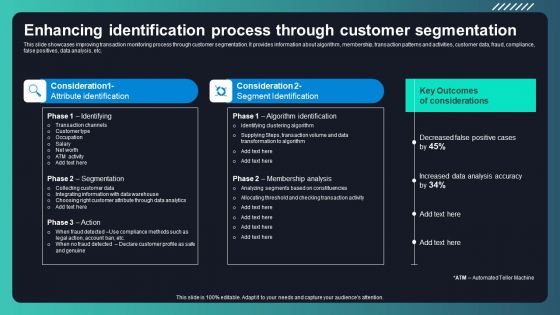
Deploying AML Transaction Monitoring Enhancing Identification Process Diagrams PDF
This slide showcases improving transaction monitoring process through customer segmentation. It provides information about algorithm , membership, transaction patterns and activities, customer data, fraud, compliance, false positives, data analysis, etc. If you are looking for a format to display your unique thoughts, then the professionally designed Deploying AML Transaction Monitoring Enhancing Identification Process Diagrams PDF is the one for you. You can use it as a Google Slides template or a PowerPoint template. Incorporate impressive visuals, symbols, images, and other charts. Modify or reorganize the text boxes as you desire. Experiment with shade schemes and font pairings. Alter, share or cooperate with other people on your work. Download Deploying AML Transaction Monitoring Enhancing Identification Process Diagrams PDF and find out how to give a successful presentation. Present a perfect display to your team and make your presentation unforgettable.
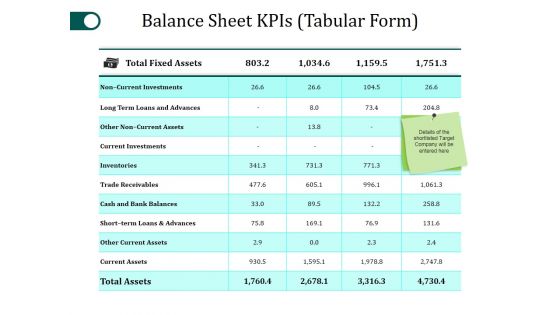
Balance Sheet Kpis Template 1 Ppt PowerPoint Presentation Pictures Example Introduction
This is a balance sheet kpis template 1 ppt powerpoint presentation pictures example introduction. This is a four stage process. The stages in this process are total fixed assets, non current investments, inventories, trade receivables.
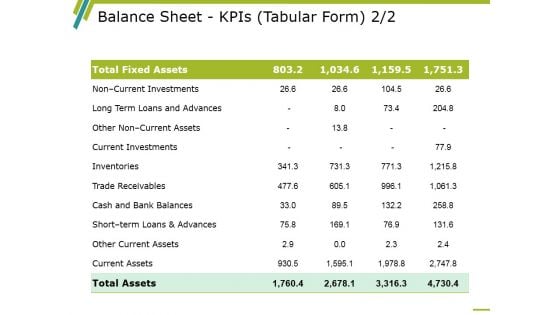
Balance Sheet Kpis Template 2 Ppt PowerPoint Presentation Outline Graphics Pictures
This is a balance sheet kpis template 2 ppt powerpoint presentation outline graphics pictures. This is a four stage process. The stages in this process are balance sheet, finance, marketing, strategy, analysis.
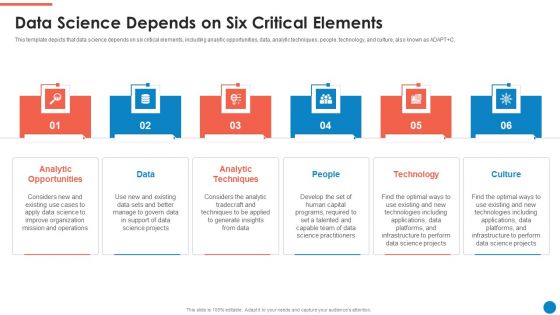
Data And Analytics Playbook Data Science Depends On Six Critical Elements Inspiration PDF
This template depicts that data science depends on six critical elements, including analytic opportunities, data, analytic techniques, people, technology, and culture, also known as ADAPTC. This is a Data And Analytics Playbook Data Science Depends On Six Critical Elements Inspiration PDF template with various stages. Focus and dispense information on six stages using this creative set, that comes with editable features. It contains large content boxes to add your information on topics like Analytic Opportunities, Data, Analytic Techniques, People, Technology, Culture. You can also showcase facts, figures, and other relevant content using this PPT layout. Grab it now.
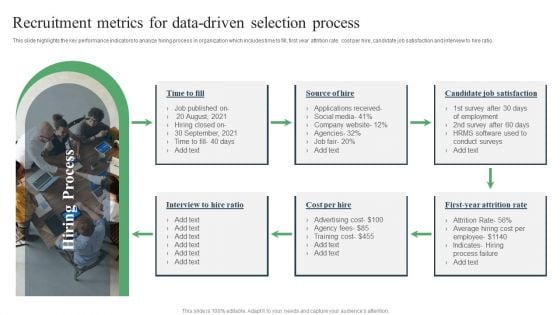
Recruitment Metrics For Data Driven Selection Process Ppt PowerPoint Presentation Inspiration Graphics Download PDF
This slide highlights the key performance indicators to analyze hiring process in organization which includes time to fill, first year attrition rate, cost per hire, candidate job satisfaction and interview to hire ratio. Persuade your audience using this Recruitment Metrics For Data-Driven Selection Process Ppt PowerPoint Presentation Inspiration Graphics Download PDF. This PPT design covers one stage, thus making it a great tool to use. It also caters to a variety of topics including Candidate Job, Satisfaction, Attrition Rate. Download this PPT design now to present a convincing pitch that not only emphasizes the topic but also showcases your presentation skills.
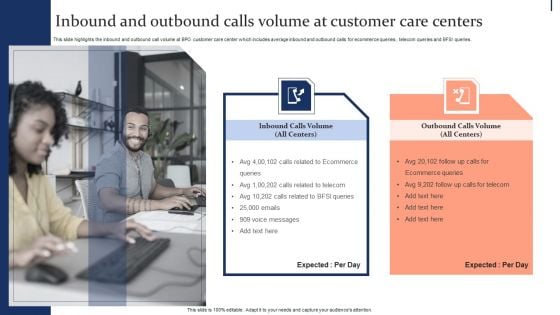
Quality Enhancement Strategic Inbound And Outbound Calls Volume At Customer Care Clipart PDF
This slide highlights the inbound and outbound call volume at BPO customer care center which includes average inbound and outbound calls for ecommerce queries , telecom queries and BFSI queries. Explore a selection of the finest Quality Enhancement Strategic Inbound And Outbound Calls Volume At Customer Care Clipart PDF here. With a plethora of professionally designed and pre-made slide templates, you can quickly and easily find the right one for your upcoming presentation. You can use our Quality Enhancement Strategic Inbound And Outbound Calls Volume At Customer Care Clipart PDF to effectively convey your message to a wider audience. Slidegeeks has done a lot of research before preparing these presentation templates. The content can be personalized and the slides are highly editable. Grab templates today from Slidegeeks.
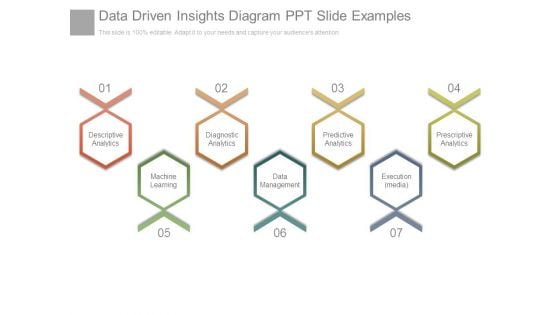
Data Driven Insights Diagram Ppt Slide Examples
This is a data driven insights diagram ppt slide examples. This is a seven stage process. The stages in this process are descriptive analytics, diagnostic analytics, predictive analytics, prescriptive analytics, machine learning, data management, execution media.
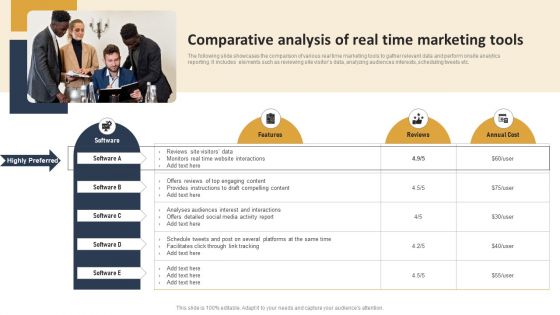
Incorporating Real Time Marketing For Improved Consumer Comparative Analysis Of Real Time Brochure PDF
The following slide showcases the comparison of various real time marketing tools to gather relevant data and perform onsite analytics reporting. It includes elements such as reviewing site visitors data, analyzing audiences interests, scheduling tweets etc. Want to ace your presentation in front of a live audience Our Incorporating Real Time Marketing For Improved Consumer Comparative Analysis Of Real Time Brochure PDF can help you do that by engaging all the users towards you. Slidegeeks experts have put their efforts and expertise into creating these impeccable powerpoint presentations so that you can communicate your ideas clearly. Moreover, all the templates are customizable, and easy to edit and downloadable. Use these for both personal and commercial use.
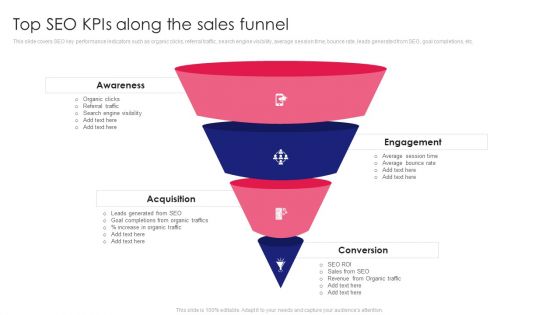
Guide To SEO Marketing Top SEO Kpis Along The Sales Funnel Slides PDF
This slide covers SEO key performance indicators such as organic clicks, referral traffic, search engine visibility, average session time, bounce rate, leads generated from SEO, goal completions, etc. Find highly impressive Guide To SEO Marketing Top SEO Kpis Along The Sales Funnel Slides PDF on Slidegeeks to deliver a meaningful presentation. You can save an ample amount of time using these presentation templates. No need to worry to prepare everything from scratch because Slidegeeks experts have already done a huge research and work for you. You need to download Guide To SEO Marketing Top SEO Kpis Along The Sales Funnel Slides PDF for your upcoming presentation. All the presentation templates are 100 percent editable and you can change the color and personalize the content accordingly. Download now.
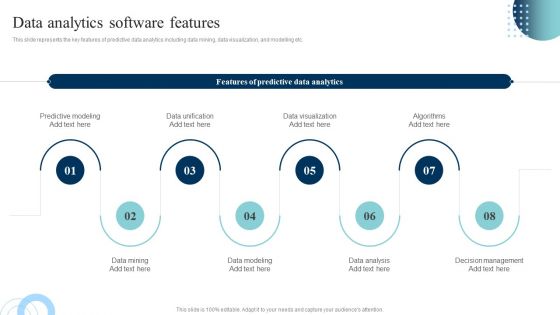
Data Evaluation And Processing Toolkit Data Analytics Software Features Formats PDF
This slide represents the key features of predictive data analytics including data mining, data visualization, and modelling etc. Crafting an eye-catching presentation has never been more straightforward. Let your presentation shine with this tasteful yet straightforward Data Evaluation And Processing Toolkit Data Analytics Software Features Formats PDF template. It offers a minimalistic and classy look that is great for making a statement. The colors have been employed intelligently to add a bit of playfulness while still remaining professional. Construct the ideal Data Evaluation And Processing Toolkit Data Analytics Software Features Formats PDF that effortlessly grabs the attention of your audience Begin now and be certain to wow your customers.
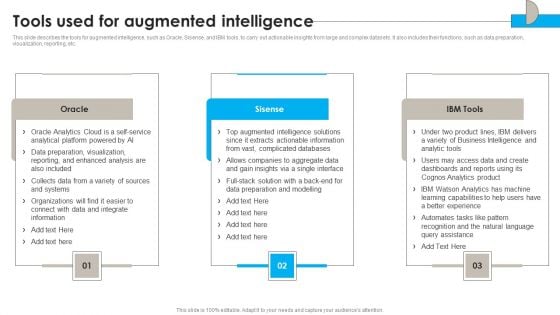
DSS Software Program Tools Used For Augmented Intelligence Clipart PDF
This slide describes the tools for augmented intelligence, such as Oracle, Sisense, and IBM tools, to carry out actionable insights from large and complex datasets. It also includes their functions, such as data preparation, visualization, reporting, etc. The DSS Software Program Tools Used For Augmented Intelligence Clipart PDF is a compilation of the most recent design trends as a series of slides. It is suitable for any subject or industry presentation, containing attractive visuals and photo spots for businesses to clearly express their messages. This template contains a variety of slides for the user to input data, such as structures to contrast two elements, bullet points, and slides for written information. Slidegeeks is prepared to create an impression.
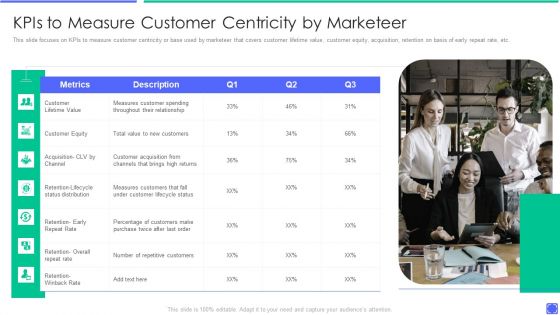
Best Techniques To Enhance New Product Management Efficiency Kpis To Measure Customer Pictures PDF
This slide focuses on KPIs to measure customer centricity or base used by marketeer that covers customer lifetime value, customer equity, acquisition, retention on basis of early repeat rate, etc. Presenting best techniques to enhance new product management efficiency kpis to measure customer pictures pdf to provide visual cues and insights. Share and navigate important information on seven stages that need your due attention. This template can be used to pitch topics like define goals and objectives, create roadmap, product success metrics. In addtion, this PPT design contains high resolution images, graphics, etc, that are easily editable and available for immediate download.
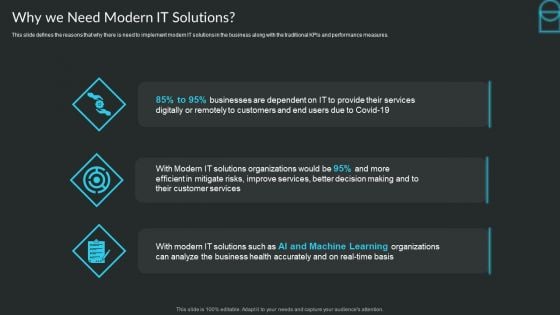
Proactive Consumer Solution And How To Perform It Why We Need Modern IT Solutions Professional PDF
This slide defines the reasons that why there is need to implement modern IT solutions in the business along with the traditional KPIs and performance measures. Persuade your audience using this Proactive Consumer Solution And How To Perform It Why We Need Modern IT Solutions Professional PDF. This PPT design covers three stages, thus making it a great tool to use. It also caters to a variety of topics including Businesses Are Dependent, Efficient In Mitigate, Learning Organizations. Download this PPT design now to present a convincing pitch that not only emphasizes the topic but also showcases your presentation skills.
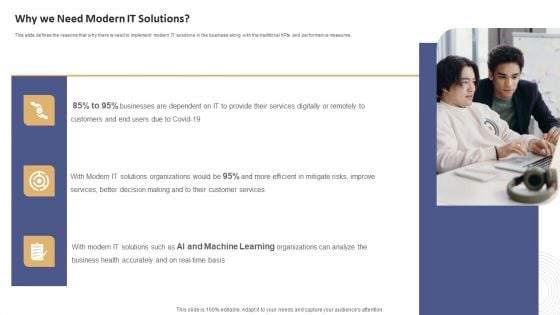
Data Processing Services Delivery Why We Need Modern IT Solutions Ppt Show Background Image PDF
This slide defines the reasons that why there is need to implement modern IT solutions in the business along with the traditional KPIs and performance measures. This is a Data Processing Services Delivery Why We Need Modern IT Solutions Ppt Show Background Image PDF template with various stages. Focus and dispense information on three stages using this creative set, that comes with editable features. It contains large content boxes to add your information on topics like Customers, Businesses Dependent, Organizations. You can also showcase facts, figures, and other relevant content using this PPT layout. Grab it now.
Achieving Proactive From Reactive Why We Need Modern IT Solutions Icons PDF
This slide defines the reasons that why there is need to implement modern IT solutions in the business along with the traditional KPIs and performance measures. Presenting Achieving Proactive From Reactive Why We Need Modern IT Solutions Icons PDF to provide visual cues and insights. Share and navigate important information on three stages that need your due attention. This template can be used to pitch topics like Businesses, IT Solutions Organizations, Health Accurately. In addtion, this PPT design contains high resolution images, graphics, etc, that are easily editable and available for immediate download.
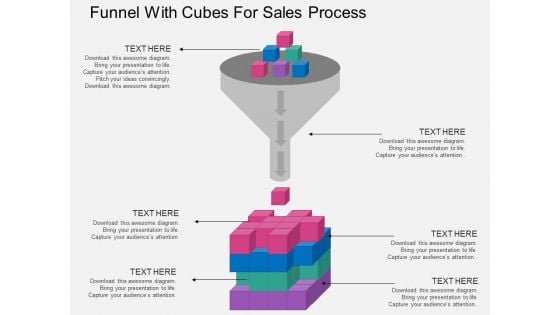
Funnel With Cubes For Sales Process Powerpoint Template
This PowerPoint template contains funnel diagram with cubes. This diagram may be used to display strategy for sales process. Earn appreciation with our slide. Your listeners will surely laud your performance.
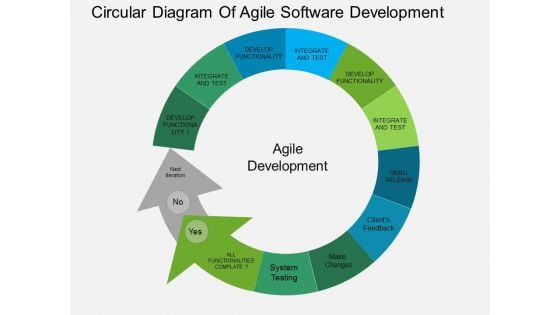
Circular Diagram Of Agile Software Development Powerpoint Templates
This PowerPoint template has been designed with circular diagram This diagram is a data visualization tool that gives you a simple way to present statistical information. This slide helps your audience examine and interpret the data you present.
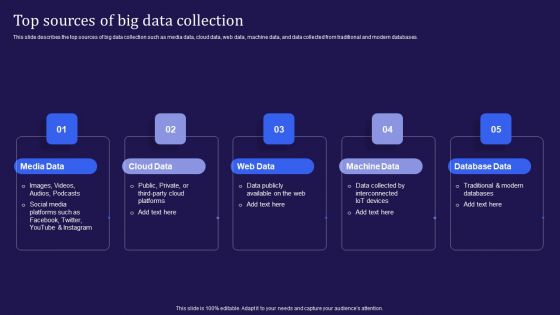
Big Data Analytics Lifecycle Top Sources Of Big Data Collection Ppt Styles Gallery PDF
This slide describes the top sources of big data collection such as media data, cloud data, web data, machine data, and data collected from traditional and modern databases. Do you have to make sure that everyone on your team knows about any specific topic I yes, then you should give Big Data Analytics Lifecycle Top Sources Of Big Data Collection Ppt Styles Gallery PDF a try. Our experts have put a lot of knowledge and effort into creating this impeccable Big Data Analytics Lifecycle Top Sources Of Big Data Collection Ppt Styles Gallery PDF. You can use this template for your upcoming presentations, as the slides are perfect to represent even the tiniest detail. You can download these templates from the Slidegeeks website and these are easy to edit. So grab these today.
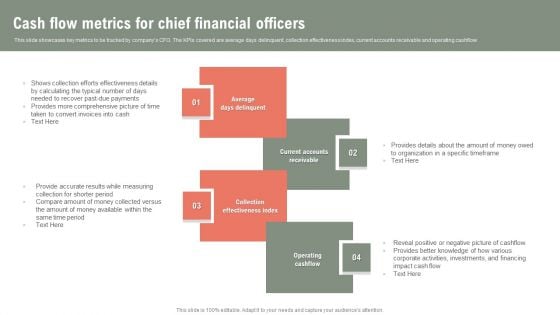
Cash Flow Metrics For Chief Financial Officers Ppt Sample PDF
This slide showcases key metrics to be tracked by companys CFO. The KPIs covered are average days delinquent, collection effectiveness index, current accounts receivable and operating cashflow. Presenting Cash Flow Metrics For Chief Financial Officers Ppt Sample PDF to dispense important information. This template comprises four stages. It also presents valuable insights into the topics including Average Days Delinquent, Current Accounts Receivable, Collection Effectiveness Index. This is a completely customizable PowerPoint theme that can be put to use immediately. So, download it and address the topic impactfully.
Big Data Analytics Lifecycle Most Critical Vs Of Big Data Ppt Icon Aids PDF
This slide describes the top sources of big data collection such as media data, cloud data, web data, machine data, and data collected from traditional and modern databases. Want to ace your presentation in front of a live audience Our Big Data Analytics Lifecycle Most Critical Vs Of Big Data Ppt Icon Aids PDF can help you do that by engaging all the users towards you. Slidegeeks experts have put their efforts and expertise into creating these impeccable powerpoint presentations so that you can communicate your ideas clearly. Moreover, all the templates are customizable, and easy-to-edit and downloadable. Use these for both personal and commercial use.
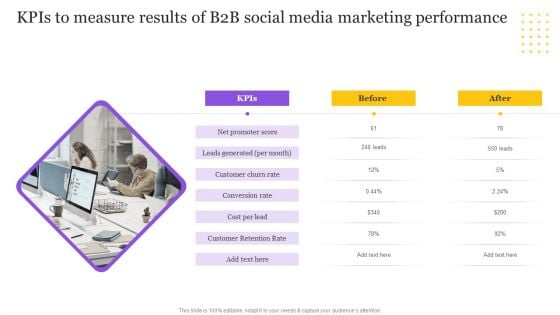
Digital Marketing Strategy Kpis To Measure Results Of B2B Social Media Marketing Pictures PDF
Boost your pitch with our creative Digital Marketing Strategy Kpis To Measure Results Of B2B Social Media Marketing Pictures PDF. Deliver an awe-inspiring pitch that will mesmerize everyone. Using these presentation templates you will surely catch everyones attention. You can browse the ppts collection on our website. We have researchers who are experts at creating the right content for the templates. So you dont have to invest time in any additional work. Just grab the template now and use them.
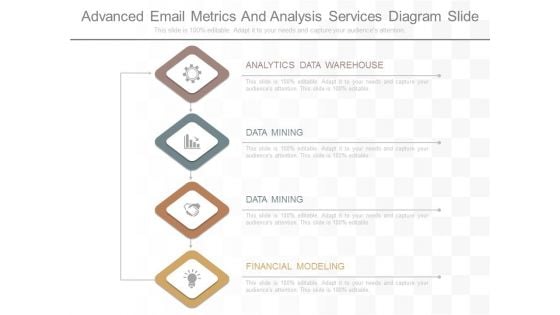
Advanced Email Metrics And Analysis Services Diagram Slide
This is a advanced email metrics and analysis services diagram slide. This is a four stage process. The stages in this process are analytics data warehouse, data mining, financial modeling.
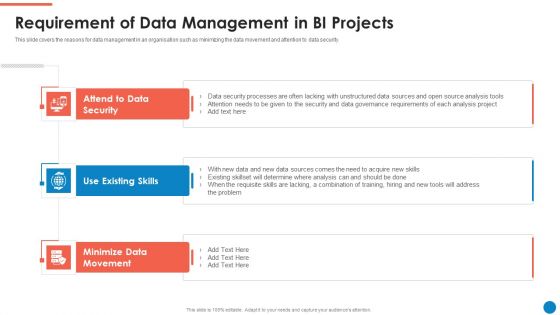
Data And Analytics Playbook Requirement Of Data Management In BI Projects Introduction PDF
This slide covers the reasons for data management in an organisation such as minimizing the data movement and attention to data security. This is a Data And Analytics Playbook Requirement Of Data Management In BI Projects Introduction PDF template with various stages. Focus and dispense information on three stages using this creative set, that comes with editable features. It contains large content boxes to add your information on topics like Attend To Data Security, Use Existing Skills, Minimize Data Movement. You can also showcase facts, figures, and other relevant content using this PPT layout. Grab it now.
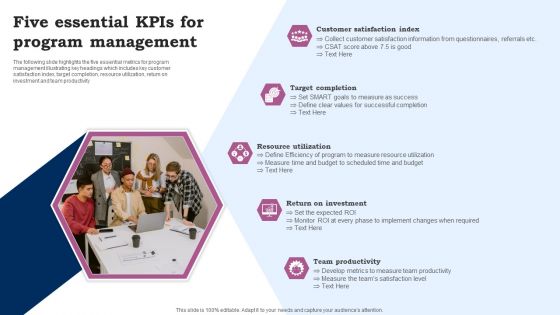
Five Essential Kpis For Program Management Ppt Ideas Background Designs PDF
The following slide highlights the five essential metrics for program management illustrating key headings which includes key customer satisfaction index, target completion, resource utilization, return on investment and team productivity. Presenting Five Essential Kpis For Program Management Ppt Ideas Background Designs PDF to dispense important information. This template comprises five stages. It also presents valuable insights into the topics including Customer Satisfaction Index, Target Completion, Resource Utilization. This is a completely customizable PowerPoint theme that can be put to use immediately. So, download it and address the topic impactfully.
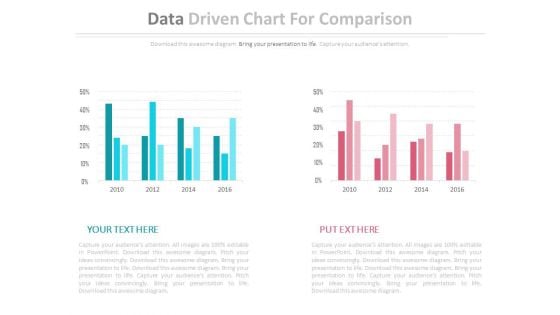
Two Data Driven Comparison Charts Powerpoint Slides
This PowerPoint template contains diagram of two data driven charts. You may use this PPT slide to depict strategic analysis for business. The color coding of this template is specifically designed to highlight you points.
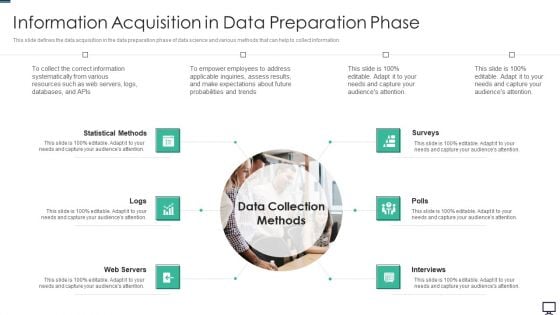
Data Analytics Information Acquisition In Data Preparation Phase Ppt Ideas Designs PDF
This slide defines the data acquisition in the data preparation phase of data science and various methods that can help to collect information. Presenting data analytics information acquisition in data preparation phase ppt ideas designs pdf to provide visual cues and insights. Share and navigate important information on six stages that need your due attention. This template can be used to pitch topics like statistical methods, web servers, interviews, surveys. In addtion, this PPT design contains high resolution images, graphics, etc, that are easily editable and available for immediate download.
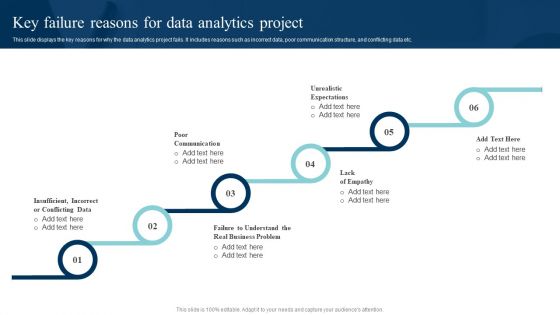
Data Evaluation And Processing Toolkit Key Failure Reasons For Data Analytics Project Information PDF
This slide displays the key reasons for why the data analytics project fails. It includes reasons such as incorrect data, poor communication structure, and conflicting data etc. This Data Evaluation And Processing Toolkit Key Failure Reasons For Data Analytics Project Information PDF from Slidegeeks makes it easy to present information on your topic with precision. It provides customization options, so you can make changes to the colors, design, graphics, or any other component to create a unique layout. It is also available for immediate download, so you can begin using it right away. Slidegeeks has done good research to ensure that you have everything you need to make your presentation stand out. Make a name out there for a brilliant performance.
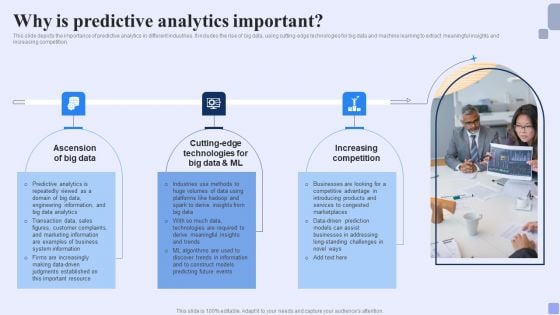
Why Is Predictive Analytics Important Forward Looking Analysis IT Professional PDF
This slide depicts the importance of predictive analytics in different industries. It includes the rise of big data, using cutting-edge technologies for big data and machine learning to extract meaningful insights and increasing competition.Present like a pro with Why Is Predictive Analytics Important Forward Looking Analysis IT Professional PDF Create beautiful presentations together with your team, using our easy-to-use presentation slides. Share your ideas in real-time and make changes on the fly by downloading our templates. So whether you are in the office, on the go, or in a remote location, you can stay in sync with your team and present your ideas with confidence. With Slidegeeks presentation got a whole lot easier. Grab these presentations today.

Stock Photo Graphics Of Arrow Crossing The Hurdle PowerPoint Slide
This image slide displays arrow crossing the hurdle . This image slide has been crafted with graphic of arrows with individual red arrow. This image slide depicts growth. You may change size, color and orientation of any icon to your liking. Use this PowerPoint template, in your presentations to express views on teamwork, leadership, management and success in business. This image slide will enhance the quality of your presentations.
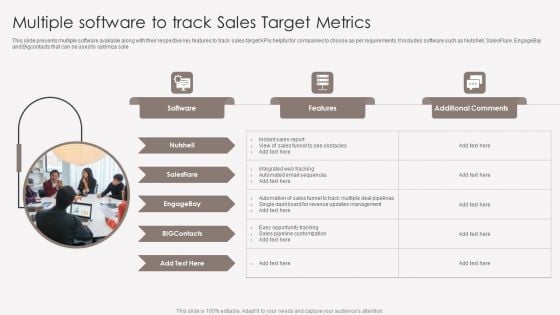
Multiple Software To Track Sales Target Metrics Infographics PDF
This slide presents multiple software available along with their respective key features to track sales target KPIs helpful for companies to choose as per requirements. It includes software such as Nutshell, SalesFlare, EngageBay and Bigcontacts that can be used to optimize sale. Presenting Multiple Software To Track Sales Target Metrics Infographics PDF to dispense important information. This template comprises four stages. It also presents valuable insights into the topics including Software, Features, Additional Comments. This is a completely customizable PowerPoint theme that can be put to use immediately. So, download it and address the topic impactfully.
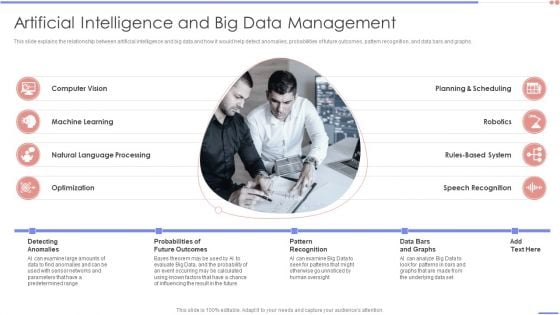
Data Analytics Management Artificial Intelligence And Big Data Management Microsoft PDF
This slide explains the relationship between artificial intelligence and big data and how it would help detect anomalies, probabilities of future outcomes, pattern recognition, and data bars and graphs.This is a Data Analytics Management Artificial Intelligence And Big Data Management Microsoft PDF template with various stages. Focus and dispense information on one stage using this creative set, that comes with editable features. It contains large content boxes to add your information on topics like Machine Learning, Language Processing, Planning Scheduling. You can also showcase facts, figures, and other relevant content using this PPT layout. Grab it now.
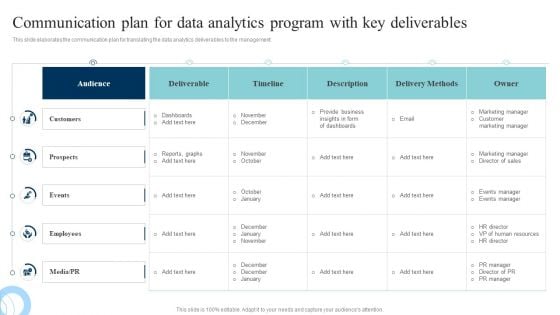
Data Evaluation And Processing Toolkit Communication Plan For Data Analytics Formats PDF
This slide shows the key components od communication plan to keep the team members informed about the project deliverables. It covers information such as project owners, delivery method, key schedules and source of message. Do you have an important presentation coming up Are you looking for something that will make your presentation stand out from the rest Look no further than Data Evaluation And Processing Toolkit Communication Plan For Data Analytics Formats PDF. With our professional designs, you can trust that your presentation will pop and make delivering it a smooth process. And with Slidegeeks, you can trust that your presentation will be unique and memorable. So why wait Grab Data Evaluation And Processing Toolkit Communication Plan For Data Analytics Formats PDF today and make your presentation stand out from the rest.
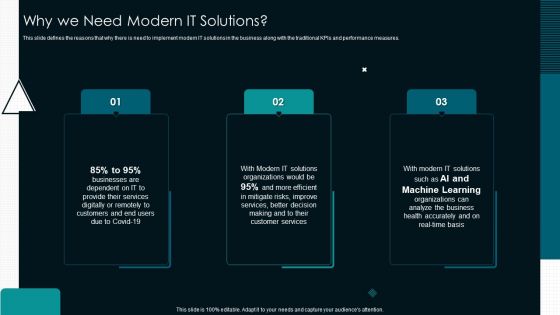
Optimize Service Delivery With Enhanced Why We Need Modern IT Solution Microsoft PDF
This slide defines the reasons that why there is need to implement modern IT solutions in the business along with the traditional KPIs and performance measures. This is a Optimize Service Delivery With Enhanced Why We Need Modern IT Solution Microsoft PDF template with various stages. Focus and dispense information on three stages using this creative set, that comes with editable features. It contains large content boxes to add your information on topics like Provide Services, Businesses Dependent, Mitigate Risks. You can also showcase facts, figures, and other relevant content using this PPT layout. Grab it now.
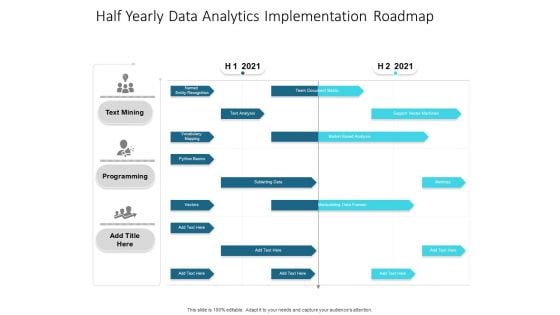
Half Yearly Data Analytics Implementation Roadmap Demonstration
We present our half yearly data analytics implementation roadmap demonstration. This PowerPoint layout is easy-to-edit so you can change the font size, font type, color, and shape conveniently. In addition to this, the PowerPoint layout is Google Slides compatible, so you can share it with your audience and give them access to edit it. Therefore, download and save this well-researched half yearly data analytics implementation roadmap demonstration in different formats like PDF, PNG, and JPG to smoothly execute your business plan.
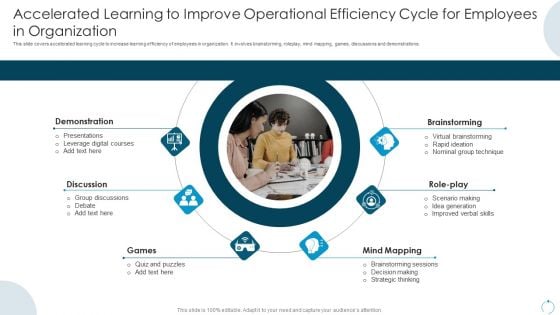
Accelerated Learning To Improve Operational Efficiency Cycle For Employees In Organization Introduction PDF
This slide covers accelerated learning cycle to increase learning efficiency of employees in organization. It involves brainstorming, roleplay, mind mapping, games, discussions and demonstrations. Persuade your audience using this Accelerated Learning To Improve Operational Efficiency Cycle For Employees In Organization Introduction PDF. This PPT design covers six stages, thus making it a great tool to use. It also caters to a variety of topics including Demonstration, Discussion, Games, Mind Mapping. Download this PPT design now to present a convincing pitch that not only emphasizes the topic but also showcases your presentation skills.
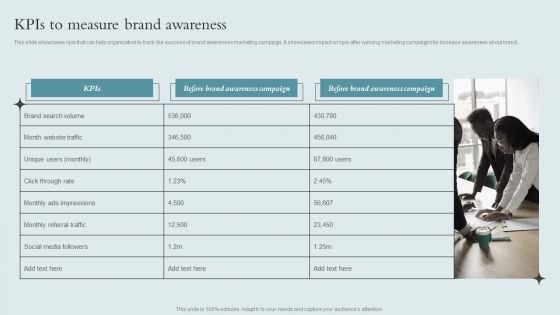
Brand Awareness Strategy Kpis To Measure Brand Awareness Structure PDF
This slide showcases kpis that can help organization to track the success of brand awareness marketing campaign. It showcases impact on kpis after running marketing campaigns for increase awareness about brand. This modern and well-arranged Brand Awareness Strategy Kpis To Measure Brand Awareness Structure PDF provides lots of creative possibilities. It is very simple to customize and edit with the Powerpoint Software. Just drag and drop your pictures into the shapes. All facets of this template can be edited with Powerpoint, no extra software is necessary. Add your own material, put your images in the places assigned for them, adjust the colors, and then you can show your slides to the world, with an animated slide included.
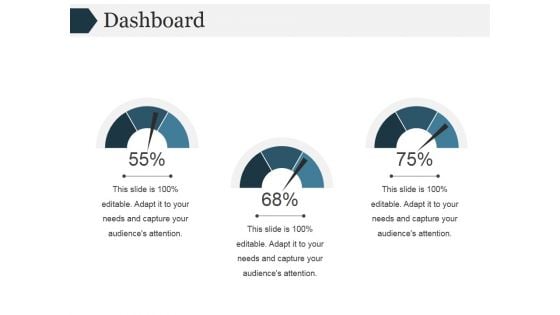
Dashboard Ppt PowerPoint Presentation Picture
This is a dashboard ppt powerpoint presentation picture. This is a three stage process. The stages in this process are business, dashboard, marketing, strategy, analysis.

Major Strategies To Improve Customer Acquisition Product Analytics Implementation Data Analytics V
This slide outlines major strategies implemented aimed at effectively acquiring and retaining existing customers. It covers strategies pertaining to improve bounce and churn rate Create an editable Major Strategies To Improve Customer Acquisition Product Analytics Implementation Data Analytics V that communicates your idea and engages your audience. Whether you are presenting a business or an educational presentation, pre-designed presentation templates help save time. Major Strategies To Improve Customer Acquisition Product Analytics Implementation Data Analytics V is highly customizable and very easy to edit, covering many different styles from creative to business presentations. Slidegeeks has creative team members who have crafted amazing templates. So, go and get them without any delay. This slide outlines major strategies implemented aimed at effectively acquiring and retaining existing customers. It covers strategies pertaining to improve bounce and churn rate

Our Team For Game Sponsorship Proposal For Dirt Track Racing Tournament Topics PDF
This slide represents team structure for real estate photography business. It covers members name and designation following in the team hierarchy. Power up your presentations with our Our Team For Game Sponsorship Proposal For Dirt Track Racing Tournament Topics PDF single-slide PPT template. Our visually-stunning template will help you deliver your message with confidence. With easy-to-use editing options and fully customizable features, you can create polished and captivating presentations in no time. Say goodbye to boring slides and hello to impactful presentations with our top-quality template. Download now and get ready to wow your audience. singles
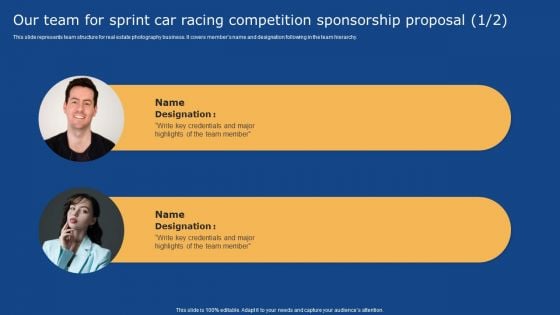
Our Team For Sprint Car Racing Competition Sponsorship Proposal Clipart PDF
This slide represents team structure for real estate photography business. It covers members name and designation following in the team hierarchy. Take your presentations to the next level with our Our Team For Sprint Car Racing Competition Sponsorship Proposal Clipart PDF template. With its sleek design and seamless editing features, this single-slide PPT template is a game-changer for professionals who want to make an impact. Impress your audience with stunning visuals and engaging content that will capture their attention from start to finish. Get your hands on our template and elevate your presentations to new heights.
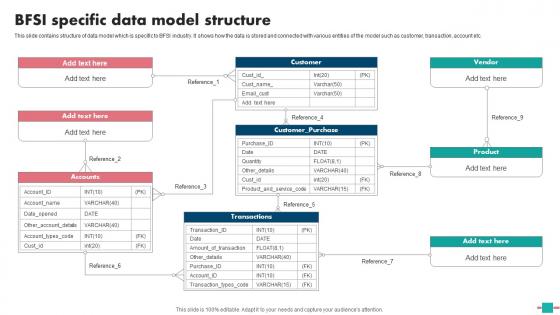
Database Modeling BFSI Specific Data Model Structure Introduction Pdf
This slide contains structure of data model which is specific to BFSI industry. It shows how the data is stored and connected with various entities of the model such as customer, transaction, account etc. Create an editable Database Modeling BFSI Specific Data Model Structure Introduction Pdf that communicates your idea and engages your audience. Whether you are presenting a business or an educational presentation, pre designed presentation templates help save time. Database Modeling BFSI Specific Data Model Structure Introduction Pdf is highly customizable and very easy to edit, covering many different styles from creative to business presentations. Slidegeeks has creative team members who have crafted amazing templates. So, go and get them without any delay. This slide contains structure of data model which is specific to BFSI industry. It shows how the data is stored and connected with various entities of the model such as customer, transaction, account etc.

Sales Improvement Performance Cycle Diagram Powerpoint Show
This is a sales improvement performance cycle diagram powerpoint show. This is a six stage process. The stages in this process are execution enablement, strategy and operations, accountability, motivation, staffing, capability.
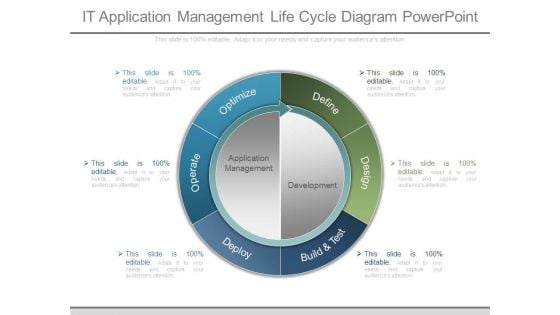
It Application Management Life Cycle Diagram Powerpoint
This is a it application management life cycle diagram powerpoint. This is a six stage process. The stages in this process are optimize, define, design, build and test, deploy, operate, development, application management.
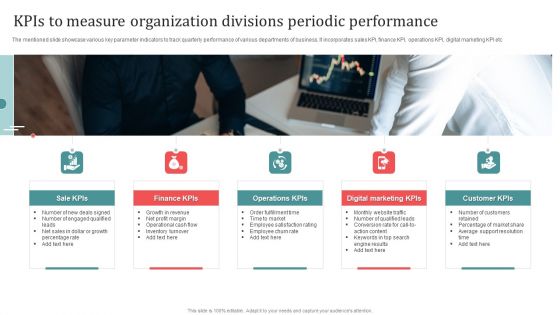
Kpis To Measure Organization Divisions Periodic Performance Structure PDF
Persuade your audience using this Kpis To Measure Organization Divisions Periodic Performance Structure PDF. This PPT design covers Five stages, thus making it a great tool to use. It also caters to a variety of topics including Sale Kpis, Finance Kpis, Operations Kpis. Download this PPT design now to present a convincing pitch that not only emphasizes the topic but also showcases your presentation skills.
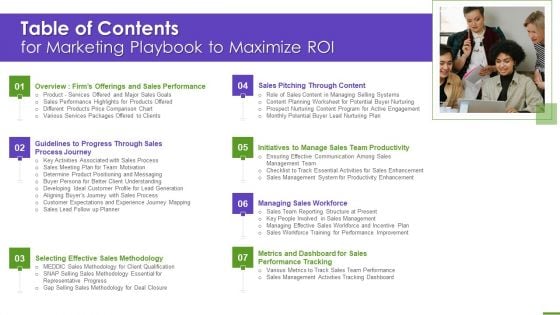
Table Of Contents For Marketing Playbook To Maximize Roi Elements PDF
Presenting table of contents for marketing playbook to maximize roi elements pdf to provide visual cues and insights. Share and navigate important information on seven stages that need your due attention. This template can be used to pitch topics like sales pitching through content, managing sales workforce, selecting effective sales methodology, metrics and dashboard for sales performance tracking. In addtion, this PPT design contains high resolution images, graphics, etc, that are easily editable and available for immediate download.
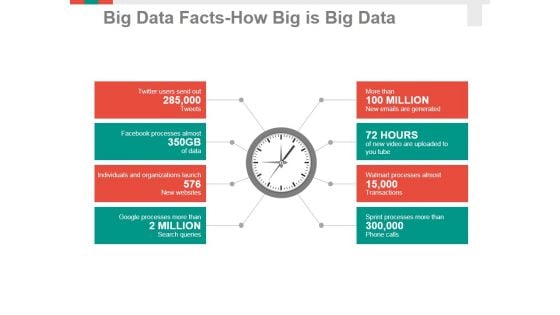
Big Data Facts How Big Is Big Data Ppt PowerPoint Presentation Professional Information
This is a big data facts how big is big data ppt powerpoint presentation professional information. This is a eight stage process. The stages in this process are business, management, strategy, measure, analysis.
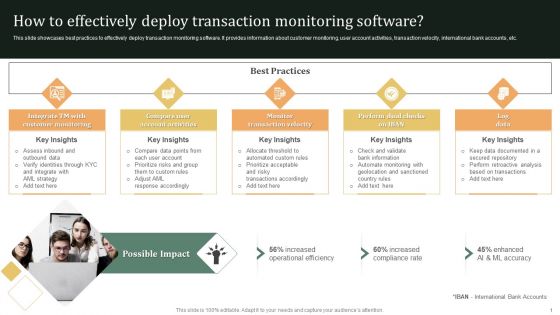
Transaction Monitoring How To Effectively Deploy Transaction Monitoring Software Information PDF
This slide showcases best practices to effectively deploy transaction monitoring software. It provides information about customer monitoring, user account activities, transaction velocity, international bank accounts, etc. Want to ace your presentation in front of a live audience Our Transaction Monitoring How To Effectively Deploy Transaction Monitoring Software Information PDF can help you do that by engaging all the users towards you. Slidegeeks experts have put their efforts and expertise into creating these impeccable powerpoint presentations so that you can communicate your ideas clearly. Moreover, all the templates are customizable, and easy-to-edit and downloadable. Use these for both personal and commercial use.
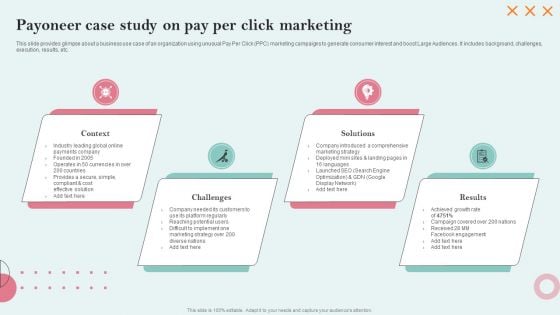
Strategies Employing PPC Advertising Payoneer Case Study On Pay Per Click Marketing Topics PDF
This slide provides glimpse about a business use case of an organization using unusual Pay Per Click PPC marketing campaigns to generate consumer interest and boost Large Audiences. It includes background, challenges, execution, results, etc. The Challenges, Solutions, Context is a compilation of the most recent design trends as a series of slides. It is suitable for any subject or industry presentation, containing attractive visuals and photo spots for businesses to clearly express their messages. This template contains a variety of slides for the user to input data, such as structures to contrast two elements, bullet points, and slides for written information. Slidegeeks is prepared to create an impression.
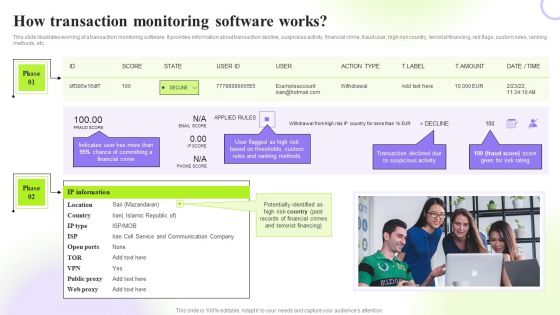
Techniques To Monitor Transactions How Transaction Monitoring Software Works Slides PDF
This slide illustrates working of a transaction monitoring software. It provides information about transaction decline, suspicious activity, financial crime, fraud user, high risk country, terrorist financing, red flags, custom rules, ranking methods, etc. This Techniques To Monitor Transactions How Transaction Monitoring Software Works Slides PDF is perfect for any presentation, be it in front of clients or colleagues. It is a versatile and stylish solution for organizing your meetings. The Techniques To Monitor Transactions How Transaction Monitoring Software Works Slides PDF features a modern design for your presentation meetings. The adjustable and customizable slides provide unlimited possibilities for acing up your presentation. Slidegeeks has done all the homework before launching the product for you. So, dont wait, grab the presentation templates today

Quantitative Data Analysis Methods Diagram Powerpoint Slide
This is a quantitative data analysis methods diagram powerpoint slide. This is a three stage process. The stages in this process are organizing data, presenting data, data analysis.
Database System PowerPoint Icon Cc
Microsoft PowerPoint Template and Background with database system for reports and data analysis Underline your erudition with our Database System PowerPoint Icon Cc. They will project your considerable expertise.
Database System PowerPoint Icon F
Microsoft PowerPoint Template and Background with database system for reports and data analysis Give them a big deal with our Database System PowerPoint Icon F. The audience will be unabashedly appreciative.
Database System PowerPoint Icon R
Microsoft PowerPoint Template and Background with database system for reports and data analysis Our Database System PowerPoint Icon R are self explanatory. What you get is what you see.


 Continue with Email

 Home
Home


