Business Snapshot
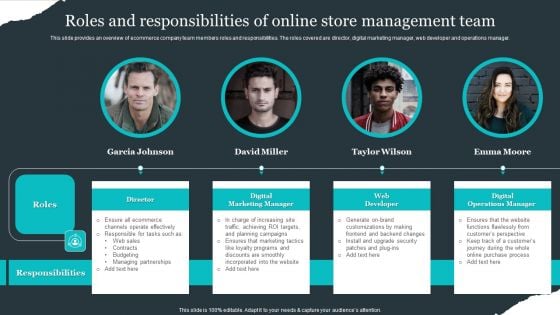
Retail Apparel Online Roles And Responsibilities Of Online Store Management Team Pictures PDF
This slide provides an overview of ecommerce company team members roles and responsibilities. The roles covered are director, digital marketing manager, web developer and operations manager. Do you know about Slidesgeeks Retail Apparel Online Roles And Responsibilities Of Online Store Management Team Pictures PDF These are perfect for delivering any kind od presentation. Using it, create PowerPoint presentations that communicate your ideas and engage audiences. Save time and effort by using our pre-designed presentation templates that are perfect for a wide range of topic. Our vast selection of designs covers a range of styles, from creative to business, and are all highly customizable and easy to edit. Download as a PowerPoint template or use them as Google Slides themes.
Strategies To Build Meaningful Dashboard And Kpi For Evaluating Overall Employee Icons Pdf
The slide showcases dashboard and KPI evaluating employees overall performance and how employee working is going on in an organization . It contains KPIs such as employee absenteeism , employee overtime hours, employee training costs, overall employee effectiveness . Create an editable Strategies To Build Meaningful Dashboard And Kpi For Evaluating Overall Employee Icons Pdf that communicates your idea and engages your audience. Whether you are presenting a business or an educational presentation, pre-designed presentation templates help save time. Strategies To Build Meaningful Dashboard And Kpi For Evaluating Overall Employee Icons Pdf is highly customizable and very easy to edit, covering many different styles from creative to business presentations. Slidegeeks has creative team members who have crafted amazing templates. So, go and get them without any delay. The slide showcases dashboard and KPI evaluating employees overall performance and how employee working is going on in an organization . It contains KPIs such as employee absenteeism , employee overtime hours, employee training costs, overall employee effectiveness .
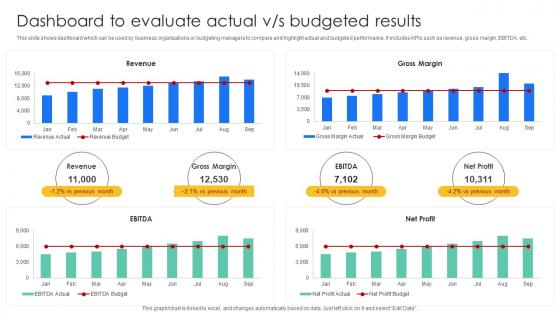
Dashboard To Evaluate Actual Vs Budgeted Results Effective And Efficient Tools To Develop Fin SS V
This slide shows dashboard which can be used by business organizations or budgeting managers to compare and highlight actual and budgeted performance. It includes KPIs such as revenue, gross margin, EBITDA, etc. Find highly impressive Dashboard To Evaluate Actual Vs Budgeted Results Effective And Efficient Tools To Develop Fin SS V on Slidegeeks to deliver a meaningful presentation. You can save an ample amount of time using these presentation templates. No need to worry to prepare everything from scratch because Slidegeeks experts have already done a huge research and work for you. You need to download Dashboard To Evaluate Actual Vs Budgeted Results Effective And Efficient Tools To Develop Fin SS V for your upcoming presentation. All the presentation templates are 100 percent editable and you can change the color and personalize the content accordingly. Download now This slide shows dashboard which can be used by business organizations or budgeting managers to compare and highlight actual and budgeted performance. It includes KPIs such as revenue, gross margin, EBITDA, etc.
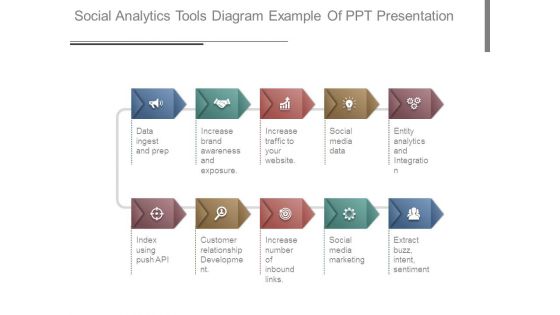
Social Analytics Tools Diagram Example Of Ppt Presentation
This is a social analytics tools diagram example of ppt presentation. This is a ten stage process. The stages in this process are data ingest and prep, increase brand awareness and exposure, increase traffic to your website, social media data, entity analytics and integration, index using push api, customer relationship development, increase number of inbound links, social media marketing, extract buzz, intent, sentiment.
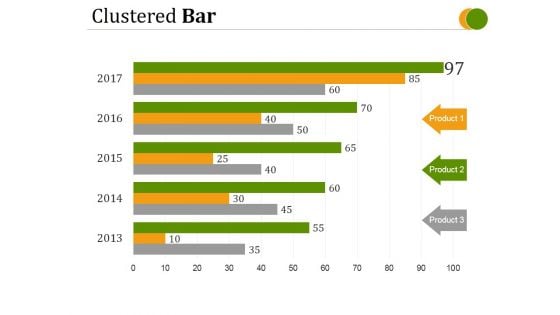
Clustered Bar Ppt PowerPoint Presentation Good
This is a clustered bar ppt powerpoint presentation good. This is a five stage process. The stages in this process are product, circular, business, marketing, bar graph.
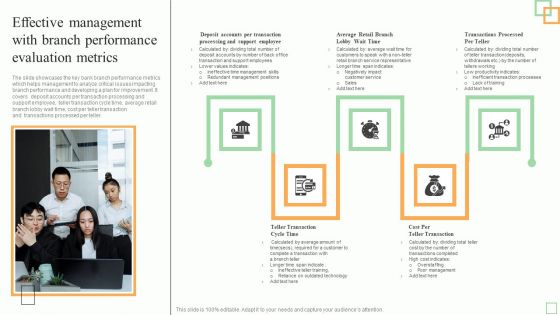
Effective Management With Branch Performance Evaluation Metrics Information PDF
The slide showcases the key bank branch performance metrics which helps management to analyze critical issues impacting branch performance and developing a plan for improvement. It covers deposit accounts per transaction processing and support employee, teller transaction cycle time, average retail branch lobby wait time, cost per teller transaction and transactions processed per teller.Presenting Effective Management With Branch Performance Evaluation Metrics Information PDF to dispense important information. This template comprises five stages. It also presents valuable insights into the topics including Support Employee, Complete Transaction, Outdated Technology. This is a completely customizable PowerPoint theme that can be put to use immediately. So, download it and address the topic impactfully.
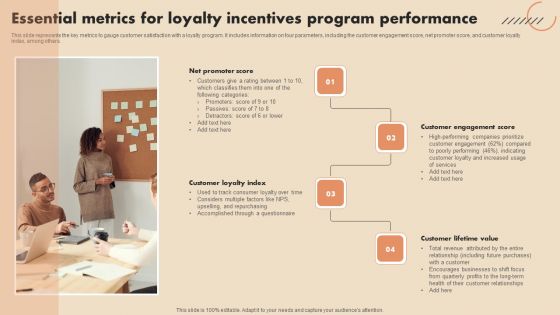
Essential Metrics For Loyalty Incentives Program Performance Microsoft PDF
This slide represents the key metrics to gauge customer satisfaction with a loyalty program. It includes information on four parameters, including the customer engagement score, net promoter score, and customer loyalty index, among others.Persuade your audience using this Essential Metrics For Loyalty Incentives Program Performance Microsoft PDF. This PPT design covers four stages, thus making it a great tool to use. It also caters to a variety of topics including Net Promoter Score, Customer Engagement Score. Download this PPT design now to present a convincing pitch that not only emphasizes the topic but also showcases your presentation skills.
Drawing Of Loudspeaker With Pencil Ppt PowerPoint Presentation Ideas Clipart
This is a drawing of loudspeaker with pencil ppt powerpoint presentation ideas clipart. This is a four stage process. The stages in this process are drawing, sketch, outline.
Drawing Of Refresh Icon Ppt PowerPoint Presentation Inspiration Layouts
This is a drawing of refresh icon ppt powerpoint presentation inspiration layouts. This is a one stage process. The stages in this process are drawing, sketch, outline.
Hand Drawn Email Vector Icon Ppt PowerPoint Presentation Layouts Example
This is a hand drawn email vector icon ppt powerpoint presentation layouts example. This is a one stage process. The stages in this process are drawing, sketch, outline.
Hand Drawn Globe Vector Icon Ppt PowerPoint Presentation Infographics Ideas
This is a hand drawn globe vector icon ppt powerpoint presentation infographics ideas. This is a one stage process. The stages in this process are drawing, sketch, outline.
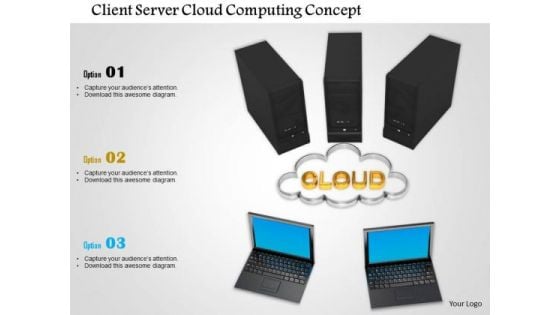
Stock Photo Client Server Cloud Computing Concept PowerPoint Slide
Our compelling image consists with design of client server with cloud. This image represents the concept of cloud computing. This image may also used for technology related topics. Transmit your thoughts via our slide.
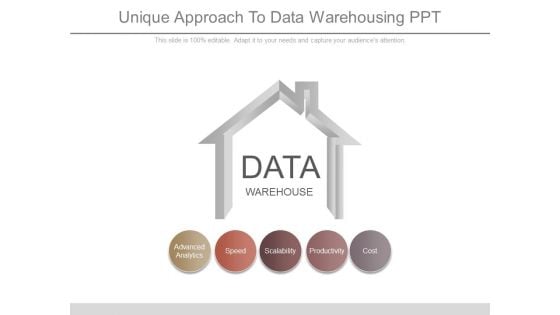
Unique Approach To Data Warehousing Ppt
This is a unique approach to data warehousing ppt. This is a five stage process. The stages in this process are advanced analytics, speed, scalability, productivity, cost.
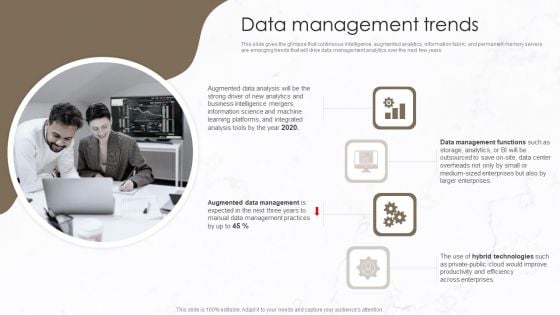
Implementation Of Data Governance Framework Data Management Trends Download PDF
This slide gives the glimpse that continuous intelligence, augmented analytics, information fabric, and permanent memory servers are emerging trends that will drive data management analytics over the next few years. This is a Implementation Of Data Governance Framework Data Management Trends Download PDF template with various stages. Focus and dispense information on four stages using this creative set, that comes with editable features. It contains large content boxes to add your information on topics like Augmented Data, Intelligence Mergers, Information Science. You can also showcase facts, figures, and other relevant content using this PPT layout. Grab it now.
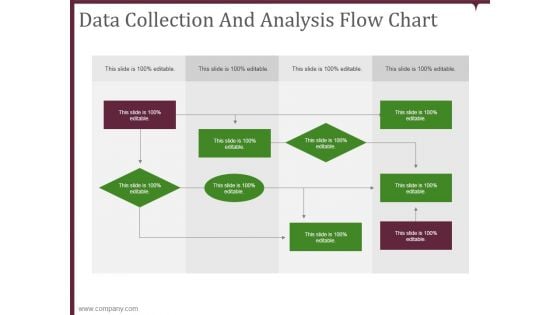
Data Collection And Analysis Flow Chart Template 1 Ppt PowerPoint Presentation Ideas Gridlines
This is a data collection and analysis flow chart template 1 ppt powerpoint presentation ideas gridlines. This is a nine stage process. The stages in this process are business, chart, organization, process, structure.
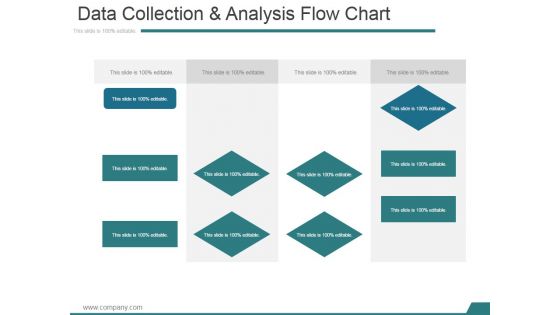
Data Collection And Analysis Flow Chart Template 2 Ppt PowerPoint Presentation Inspiration Layout Ideas
This is a data collection and analysis flow chart template 2 ppt powerpoint presentation inspiration layout ideas. This is a four stage process. The stages in this process are business, chart, organization, process, structure.
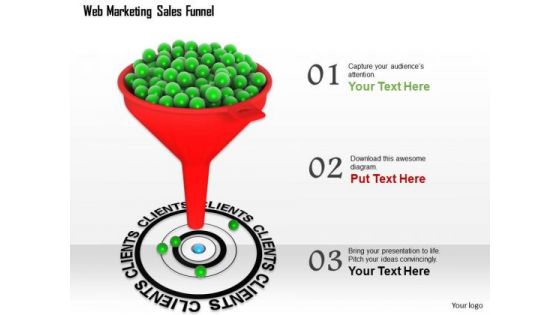
Stock Photo Sales Funnel With Target Client PowerPoint Slide
This image slide displays web marketing sales funnel. This image slide may be used in your presentations to express views on strategic marketing techniques. This sales and marketing plan template will enhance the quality of your presentations.
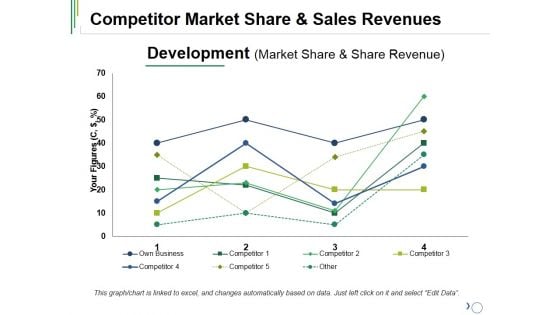
Competitor Market Share And Sales Revenues Ppt PowerPoint Presentation Pictures Information
This is a competitor market share and sales revenues ppt powerpoint presentation pictures information. This is a four stage process. The stages in this process are your figures, business, marketing, own business, competitor.
Stock Photo Red And White Envelopes In Mail Box PowerPoint Slide
Doll Up Your Thoughts With Our Stock Photo Red And White Envelopes In Mail Box Powerpoint Slide Powerpoint Templates. They Will Make A Pretty Picture.
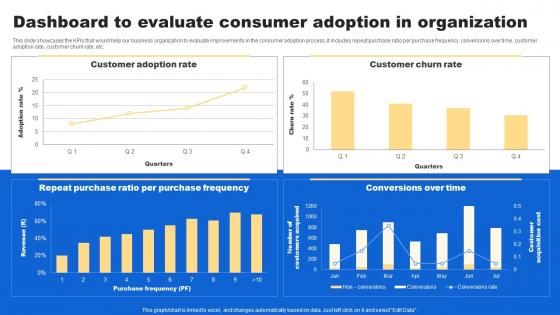
Dashboard To Evaluate Consumer Analyzing Customer Buying Behavior Enhance Conversion Inspiration Pdf
This slide showcases the KPIs that would help our business organization to evaluate improvements in the consumer adoption process. It includes repeat purchase ratio per purchase frequency, conversions over time, customer adoption rate, customer churn rate, etc. Whether you have daily or monthly meetings, a brilliant presentation is necessary. Dashboard To Evaluate Consumer Analyzing Customer Buying Behavior Enhance Conversion Inspiration Pdf can be your best option for delivering a presentation. Represent everything in detail using Dashboard To Evaluate Consumer Analyzing Customer Buying Behavior Enhance Conversion Inspiration Pdf and make yourself stand out in meetings. The template is versatile and follows a structure that will cater to your requirements. All the templates prepared by Slidegeeks are easy to download and edit. Our research experts have taken care of the corporate themes as well. So, give it a try and see the results. This slide showcases the KPIs that would help our business organization to evaluate improvements in the consumer adoption process. It includes repeat purchase ratio per purchase frequency, conversions over time, customer adoption rate, customer churn rate, etc.
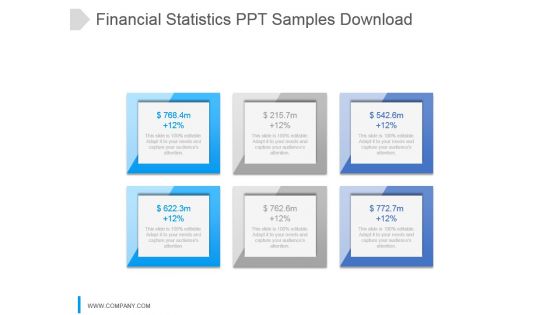
Financial Statistics Ppt Samples Download
This is a financial statistics ppt samples download. This is a six stage process. The stages in this process are business, finance, percentage, dollar, data.
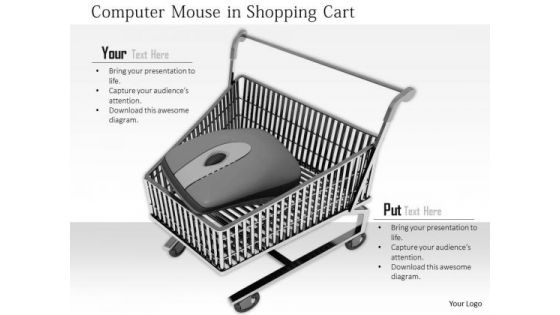
Stock Photo Browse Online For Shopping PowerPoint Slide
This unique image of shopping cart with computer mouse portrays the concepts of online shopping. This cubes image is well designed to display concepts of shopping and technology. Add this image in your presentations to visually support your content.
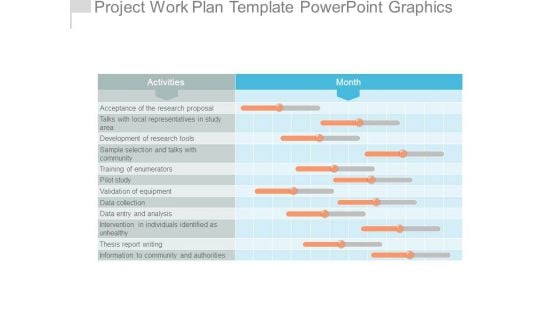
Project Work Plan Template Powerpoint Graphics
This is a project work plan template powerpoint graphics. This is a twelve stage process. The stages in this process are acceptance of the research proposal, talks with local representatives in study area, development of research tools, sample selection and talks with community, training of enumerators, pilot study, validation of equipment, data collection, data entry and analysis, intervention in individuals identified as unhealthy, thesis report writing, information to community and authorities.
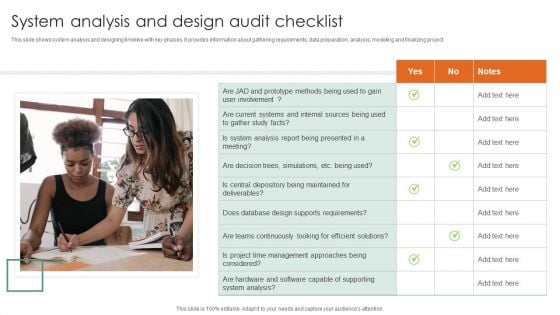
System Analysis And Design Audit Checklist Ppt Layouts Pictures PDF
This slide shows system analysis and designing timeline with key phases. It provides information about gathering requirements, data preparation, analysis, modeling and finalizing project. Presenting System Analysis And Design Audit Checklist Ppt Layouts Pictures PDF to dispense important information. This template comprises one stages. It also presents valuable insights into the topics including JAD And Prototype, Does Database Design, Supports Requirements. This is a completely customizable PowerPoint theme that can be put to use immediately. So, download it and address the topic impactfully.
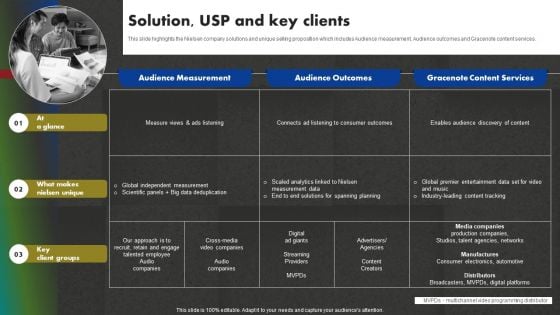
Data And Customer Analysis Company Outline Solution USP And Key Clients Microsoft PDF
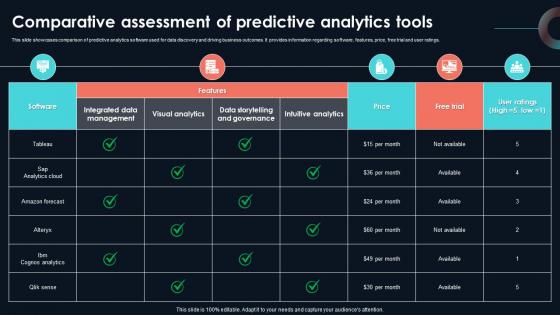
Comparative Assessment Of Predictive Developing Strategic Insights Using Big Data Analytics SS V
This slide showcases comparison of predictive analytics software used for data discovery and driving business outcomes. It provides information regarding software, features, price, free trial and user ratings. This Comparative Assessment Of Predictive Developing Strategic Insights Using Big Data Analytics SS V is perfect for any presentation, be it in front of clients or colleagues. It is a versatile and stylish solution for organizing your meetings. The Comparative Assessment Of Predictive Developing Strategic Insights Using Big Data Analytics SS V features a modern design for your presentation meetings. The adjustable and customizable slides provide unlimited possibilities for acing up your presentation. Slidegeeks has done all the homework before launching the product for you. So, do not wait, grab the presentation templates today This slide showcases comparison of predictive analytics software used for data discovery and driving business outcomes. It provides information regarding software, features, price, free trial and user ratings.
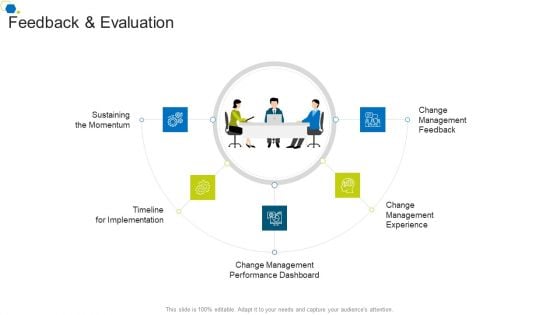
Feedback And Evaluation Corporate Transformation Strategic Outline Graphics PDF
Presenting feedback and evaluation corporate transformation strategic outline graphics pdf to provide visual cues and insights. Share and navigate important information on five stages that need your due attention. This template can be used to pitch topics like management, performance, dashboard, implementation, experience. In addtion, this PPT design contains high resolution images, graphics, etc, that are easily editable and available for immediate download.
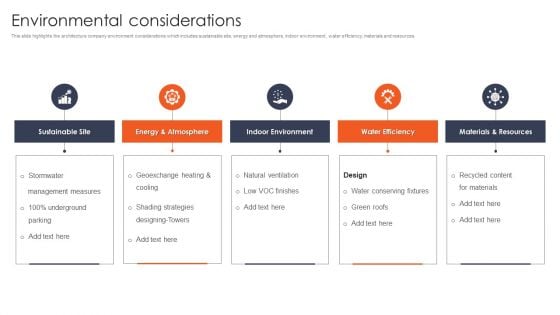
International Design And Architecture Firm Environmental Considerations Download PDF
This slide highlights the architecture company environment considerations which includes sustainable site, energy and atmosphere, indoor environment, water efficiency, materials and resources. The International Design And Architecture Firm Environmental Considerations Download PDF is a compilation of the most recent design trends as a series of slides. It is suitable for any subject or industry presentation, containing attractive visuals and photo spots for businesses to clearly express their messages. This template contains a variety of slides for the user to input data, such as structures to contrast two elements, bullet points, and slides for written information. Slidegeeks is prepared to create an impression.
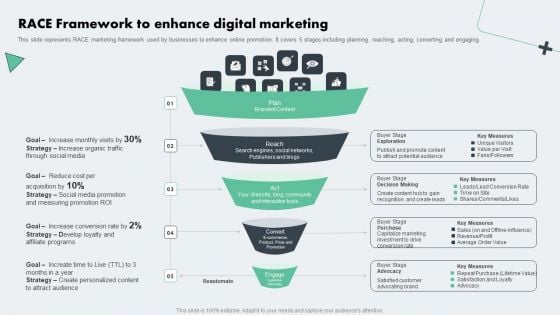
Deploying Online Marketing Race Framework To Enhance Digital Marketing Pictures PDF
This slide represents RACE marketing framework used by businesses to enhance online promotion. It covers 5 stages including planning, reaching, acting, converting and engaging. Do you have an important presentation coming up Are you looking for something that will make your presentation stand out from the rest Look no further than Deploying Online Marketing Race Framework To Enhance Digital Marketing Pictures PDF. With our professional designs, you can trust that your presentation will pop and make delivering it a smooth process. And with Slidegeeks, you can trust that your presentation will be unique and memorable. So why wait Grab Deploying Online Marketing Race Framework To Enhance Digital Marketing Pictures PDF today and make your presentation stand out from the rest.
Enhance Customer Retention Tracking The Actual Sales Figures After Deal Finalizing Graphics Pdf
This slide provides glimpse about dashboard analysis that can help the business to track the performance of the sales team. It includes KPIs such as revenues, profit, orders placed, conversion placed, conversion rate, customers, etc. Take your projects to the next level with our ultimate collection of Enhance Customer Retention Tracking The Actual Sales Figures After Deal Finalizing Graphics Pdf. Slidegeeks has designed a range of layouts that are perfect for representing task or activity duration, keeping track of all your deadlines at a glance. Tailor these designs to your exact needs and give them a truly corporate look with your own brand colors they well make your projects stand out from the rest. This slide provides glimpse about dashboard analysis that can help the business to track the performance of the sales team. It includes KPIs such as revenues, profit, orders placed, conversion placed, conversion rate, customers, etc.
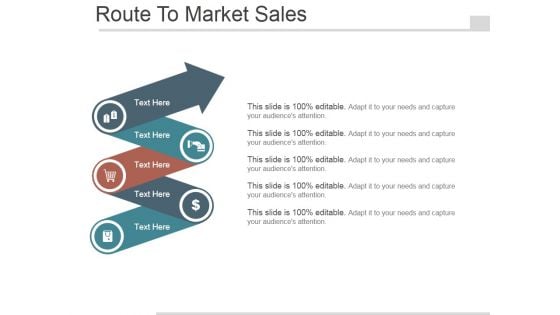
Route To Market Sales Ppt PowerPoint Presentation Picture
This is a route to market sales ppt powerpoint presentation picture. This is a five stage process. The stages in this process are icons, management, business, marketing.

About Us Ppt PowerPoint Presentation Pictures Graphics Example
This is a about us ppt powerpoint presentation pictures graphics example. This is a three stage process. The stages in this process are about us, icon, building, business.

Reward Vs Equity Ppt PowerPoint Presentation Gallery Graphics Pictures
This is a reward vs equity ppt powerpoint presentation gallery graphics pictures. This is a two stage process. The stages in this process are reward, equity, compare, business.
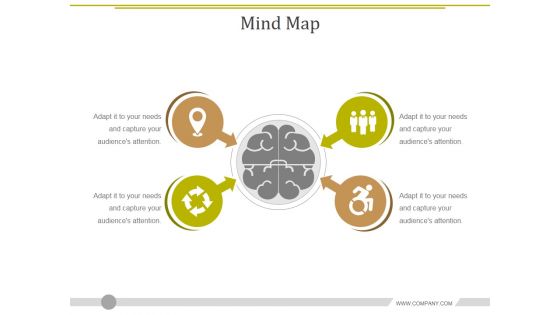
Mind Map Ppt PowerPoint Presentation Pictures Background Image
This is a mind map ppt powerpoint presentation pictures background image. This is a four stage process. The stages in this process are brainstorming, icons, strategy, mindmap, business.
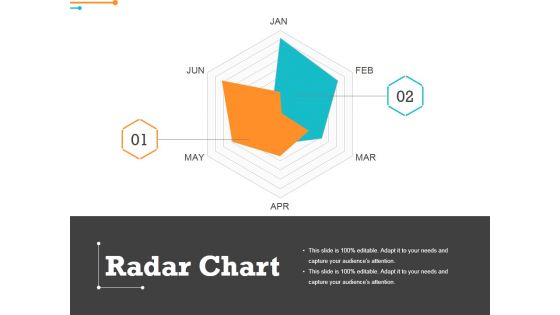
Radar Chart Ppt PowerPoint Presentation Pictures Graphics Example
This is a radar chart ppt powerpoint presentation pictures graphics example. This is a two stage process. The stages in this process are business, marketing, shapes, diagram.
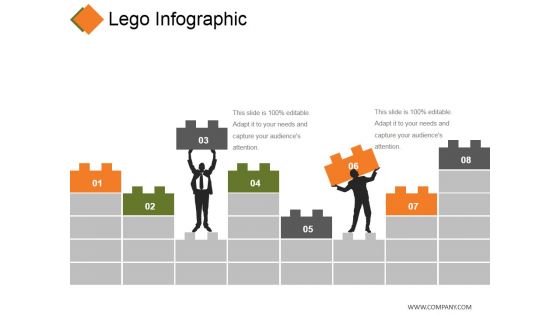
Lego Infographic Ppt PowerPoint Presentation Model Graphics Pictures
This is a lego infographic ppt powerpoint presentation model graphics pictures. This is a eight stage process. The stages in this process are lego, business, marketing, management.
News Paper Ppt PowerPoint Presentation Styles Graphics Pictures
This is a news paper ppt powerpoint presentation styles graphics pictures. This is a one stage process. The stages in this process are newspaper, news, business, marketing, update.
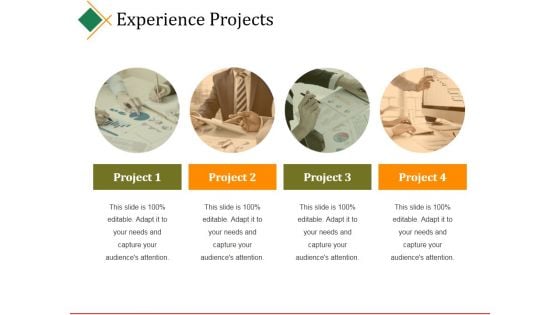
Experience Projects Ppt PowerPoint Presentation Pictures Graphic Images
This is a experience projects ppt powerpoint presentation pictures graphic images. This is a four stage process. The stages in this process are project, business, marketing, analysis, management.

Professional Qualifications Ppt PowerPoint Presentation Pictures Example Topics
This is a professional qualifications ppt powerpoint presentation pictures example topics. This is a four stage process. The stages in this process are qualifications, business, education, icons.
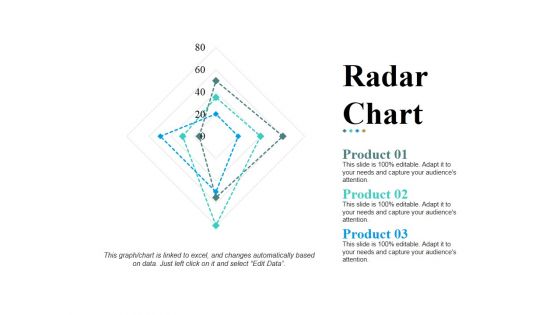
Radar Chart Ppt PowerPoint Presentation Pictures Design Templates
This is a radar chart ppt powerpoint presentation pictures design templates. This is a three stage process. The stages in this process are product, shapes, business, marketing, management.
Post It Ppt PowerPoint Presentation Portfolio Graphics Pictures
This is a post it ppt powerpoint presentation portfolio graphics pictures. This is a four stage process. The stages in this process are post it, education, business, management.
Scatter Bubble Chart Ppt PowerPoint Presentation Pictures Demonstration
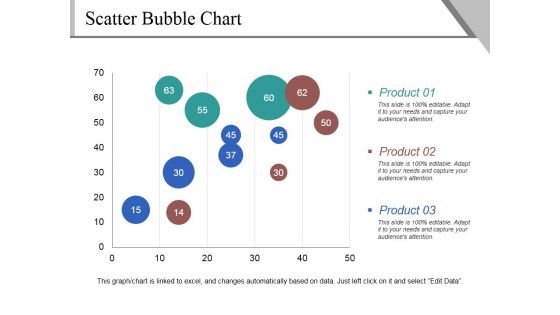
This is a scatter bubble chart ppt powerpoint presentation pictures demonstration. This is a three stage process. The stages in this process are product, business, marketing, scatter chart.
Departments And Teams Ppt PowerPoint Presentation Pictures Show
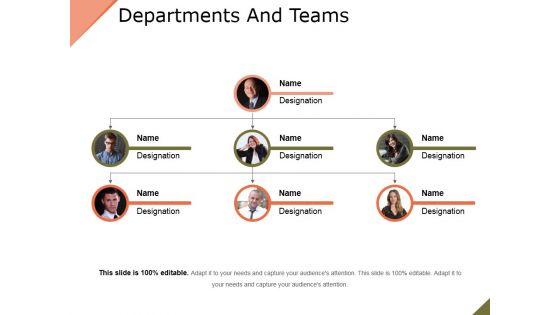
This is a departments and teams ppt powerpoint presentation pictures show. This is a three stage process. The stages in this process are designation, business, step, marketing, management.
Radar With Markers Ppt PowerPoint Presentation Show Pictures
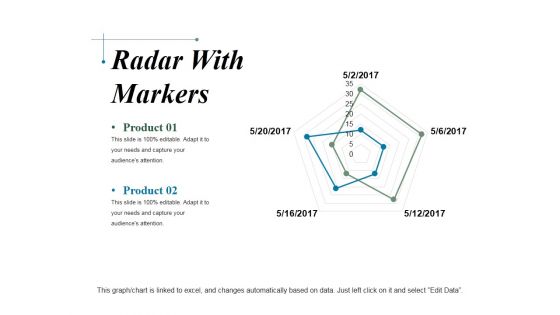
This is a radar with markers ppt powerpoint presentation show pictures. This is a two stage process. The stages in this process are product, shapes, business, marketing.
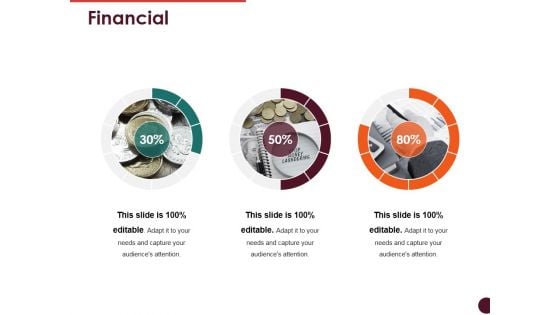
Financial Ppt PowerPoint Presentation Infographic Template Graphics Pictures
This is a financial ppt powerpoint presentation infographic template graphics pictures. This is a three stage process. The stages in this process are percentage, coin, business, finance, marketing.
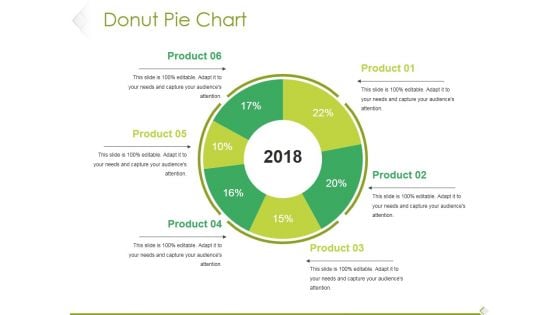
Donut Pie Chart Ppt PowerPoint Presentation Model Pictures
This is a donut pie chart ppt powerpoint presentation model pictures. This is a six stage process. The stages in this process are product, percentage, finance, year, business.
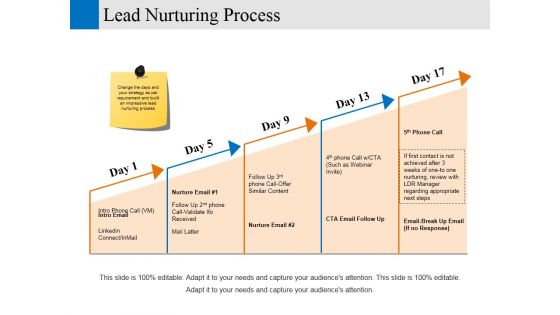
Lead Nurturing Process Ppt PowerPoint Presentation Pictures Infographics
This is a lead nurturing process ppt powerpoint presentation pictures infographics. This is a five stage process. The stages in this process are business, marketing, strategy, growth, analysis.
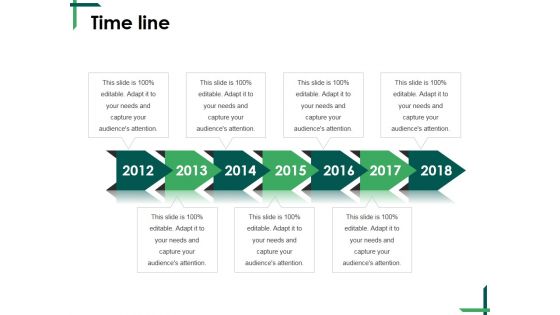
Time Line Ppt PowerPoint Presentation Outline Graphics Pictures
This is a time line ppt powerpoint presentation outline graphics pictures. This is a seven stage process. The stages in this process are timeline, business, planning, process, management.
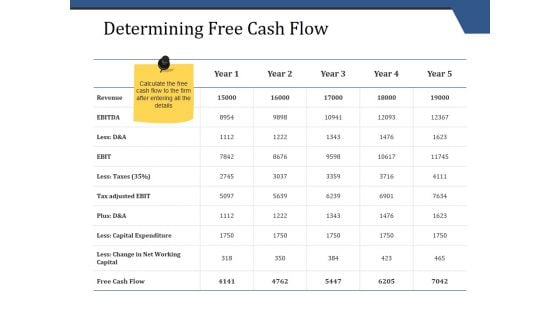
Determining Free Cash Flow Ppt PowerPoint Presentation Pictures
This is a determining free cash flow ppt powerpoint presentation pictures. This is a five stage process. The stages in this process are business, management, analysis, strategy, success.
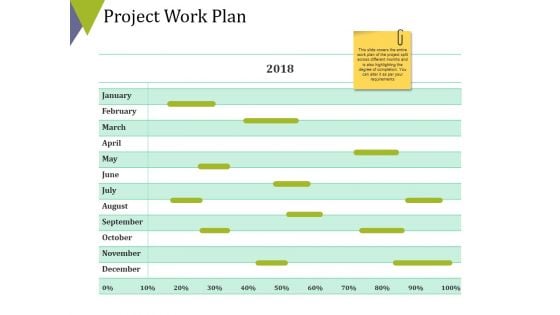
Project Work Plan Ppt PowerPoint Presentation Gallery Pictures
This is a project work plan ppt powerpoint presentation gallery pictures. This is a one stage process. The stages in this process are timeline, strategy, marketing, business, management.

Our Team Ppt PowerPoint Presentation Pictures Background Image
This is a our team ppt powerpoint presentation pictures background image. This is a two stage process. The stages in this process are business, marketing, strategy, planning, communication.
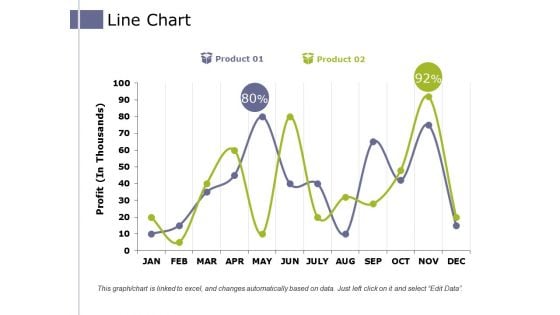
Line Chart Ppt PowerPoint Presentation Pictures Example Introduction
This is a line chart ppt powerpoint presentation pictures example introduction. This is a two stage process. The stages in this process are product, profit, business, growth, success.
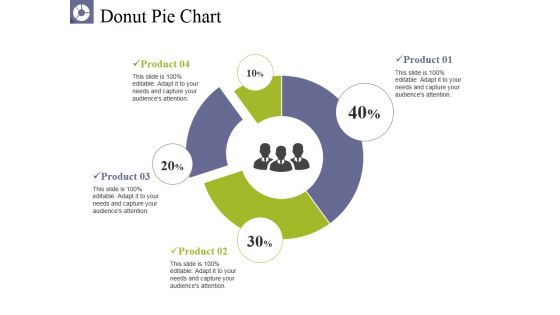
Donut Pie Chart Ppt PowerPoint Presentation Pictures Graphics
This is a donut pie chart ppt powerpoint presentation pictures graphics. This is a four stage process. The stages in this process are product, business, percentage, donut, finance.
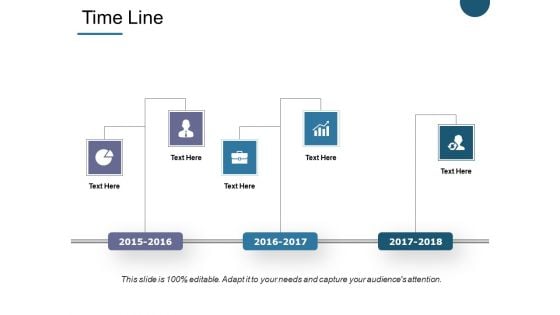
Time Line Ppt PowerPoint Presentation Slides Graphics Pictures
This is a time line ppt powerpoint presentation slides graphics pictures. This is a five stage process. The stages in this process are timeline, business, management, planning, years.

Financial Projections Ppt PowerPoint Presentation Professional Graphics Pictures
This is a financial projections ppt powerpoint presentation professional graphics pictures. This is a three stage process. The stages in this process are dollar, business, finance, marketing, percentage.
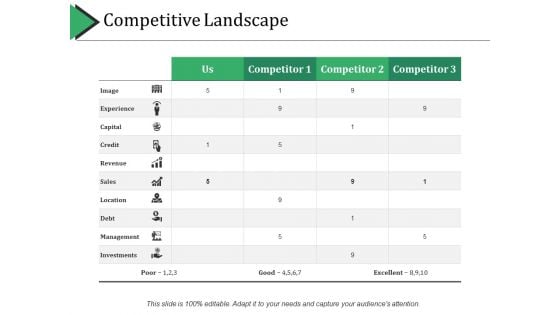
Competitive Landscape Ppt PowerPoint Presentation Pictures Example Introduction
This is a competitive landscape ppt powerpoint presentation pictures example introduction. This is a three stage process. The stages in this process are business, table, marketing, strategy, management.
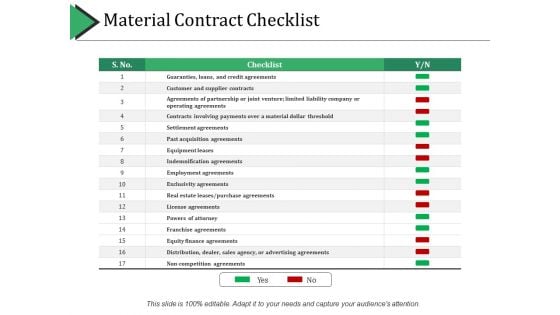
Material Contract Checklist Ppt PowerPoint Presentation Infographics Picture
This is a material contract checklist ppt powerpoint presentation infographics picture. This is a two stage process. The stages in this process are business, checklist, management, strategy, success.
Awesome Team Ppt PowerPoint Presentation Pictures Example File
This is a awesome team ppt powerpoint presentation pictures example file. This is a four stage process. The stages in this process are designation, teamwork, communication, people, business.
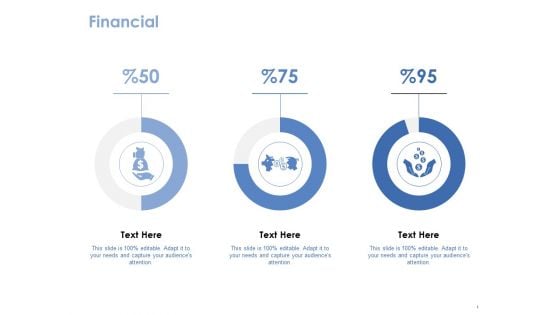
Financial Template 1 Ppt PowerPoint Presentation Pictures Files
This is a financial template 1 ppt powerpoint presentation pictures files. This is a three stage process. The stages in this process are business, finance, marketing, icons, strategy.

Meet Our Team Ppt PowerPoint Presentation Pictures Inspiration
This is a meet our team ppt powerpoint presentation pictures inspiration. This is a four stage process. The stages in this process are teamwork, communication, people, business, designation.


 Continue with Email

 Home
Home


