Business Snapshot
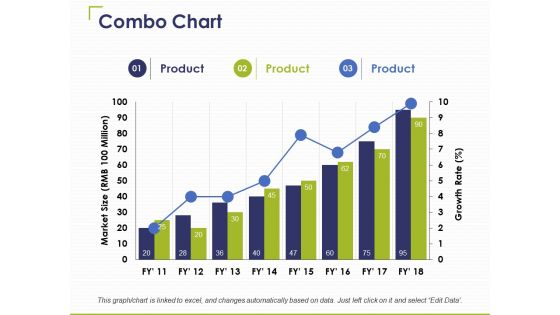
Combo Chart Ppt PowerPoint Presentation Infographics Graphics Pictures
This is a combo chart ppt powerpoint presentation infographics graphics pictures. This is a three stage process. The stages in this process are product, business, marketing, combo chart.
Define Project Ppt PowerPoint Presentation Icon Graphics Pictures
This is a define project ppt powerpoint presentation icon graphics pictures. This is a four stage process. The stages in this process are business, management, analysis, strategy, marketing.

Google Analytics Ppt PowerPoint Presentation Pictures Background Images
This is a google analytics ppt powerpoint presentation pictures background images. This is a four stage process. The stages in this process are google, analytics, business, management, marketing.
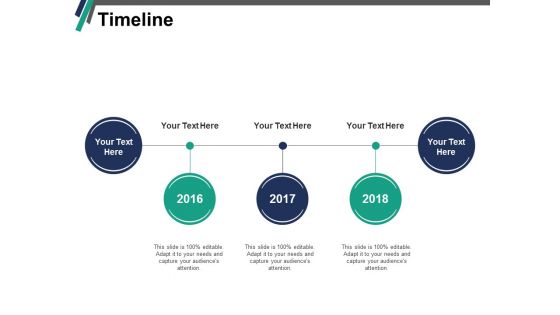
Timeline Year Process Ppt PowerPoint Presentation Pictures Brochure
This is a timeline year process ppt powerpoint presentation pictures brochure. This is a three stage process. The stages in this process are timeline, process, management, planning, business.

Financial Investment Marketing Ppt PowerPoint Presentation Pictures Elements
This is a financial investment marketing ppt powerpoint presentation pictures elements. This is a three stage process. The stages in this process are business, finance, analysis, investment, marketing.
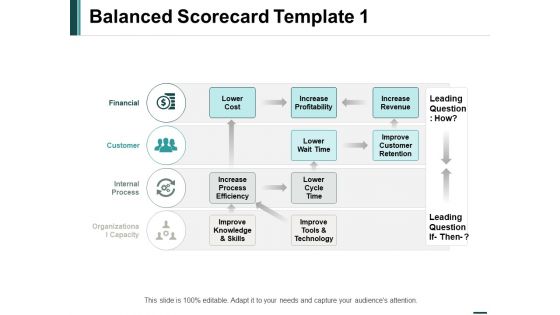
Balanced Scorecard Leading Ppt PowerPoint Presentation Pictures Professional
This is a balanced scorecard leading ppt powerpoint presentation pictures professional. This is a four stage process. The stages in this process are business, management, marketing, process, financial.
Post It Marketing Ppt PowerPoint Presentation Pictures Themes
This is a post it marketing ppt powerpoint presentation pictures themes. This is a four stage process. The stages in this process are education, strategy, marketing, business, planning.
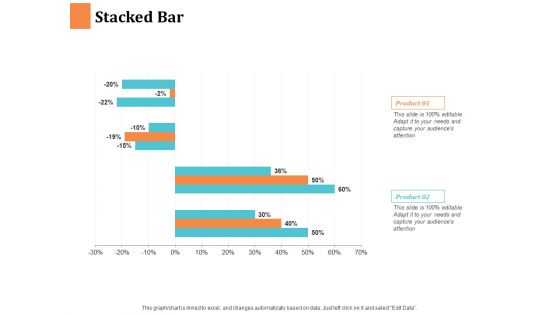
Stacked Bar Ppt PowerPoint Presentation Visual Aids Pictures
This is a stacked bar ppt powerpoint presentation visual aids pictures. This is a two stage process. The stages in this process are product, percentage, finance, business, marketing.
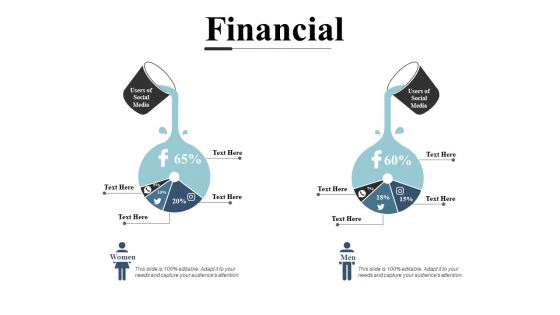
Financial Management Ppt PowerPoint Presentation Pictures File Formats
This is a financial management ppt powerpoint presentation pictures file formats. This is a two stage process. The stages in this process are business, finance, analysis, investment, marketing.
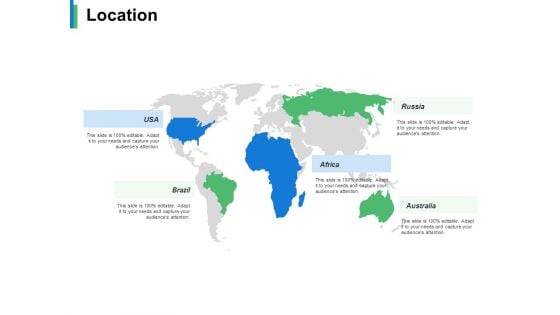
Location Country Ppt PowerPoint Presentation Infographic Template Pictures
This is a location country ppt powerpoint presentation infographic template pictures. This is a five stage process. The stages in this process are business, management, location, strategy, analysis.

Meet Our Team Ppt PowerPoint Presentation Pictures Slides
This is a meet our team ppt powerpoint presentation pictures slides. This is a four stage process. The stages in this process are communication, management, business, planning.
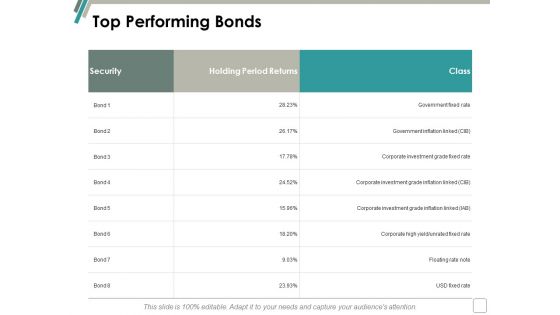
Top Performing Bonds Ppt Powerpoint Presentation Pictures Rules
This is a top performing bonds ppt powerpoint presentation pictures rules. This is a three stage process. The stages in this process are business, marketing, management, planning, strategy.

Quotes Thought Communication Ppt PowerPoint Presentation Pictures Infographics
This is a quotes thought communication ppt powerpoint presentation pictures infographics. This is a two stage process. The stages in this process are thought, business, management, strategy, analysis.

Economic Order Quantity Ppt PowerPoint Presentation Pictures Introduction
This is a economic order quantity ppt powerpoint presentation pictures introduction. This is a three stage process. The stages in this process are finance, strategy, marketing, compare, business.
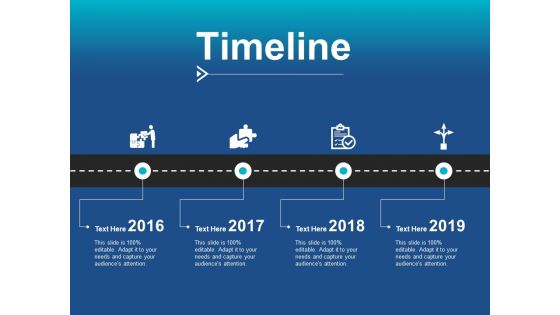
Timeline Process Planning Ppt PowerPoint Presentation Pictures Brochure
This is a timeline process planning ppt powerpoint presentation pictures brochure. This is a four stage process. The stages in this process are timeline, business, planning, management, process.
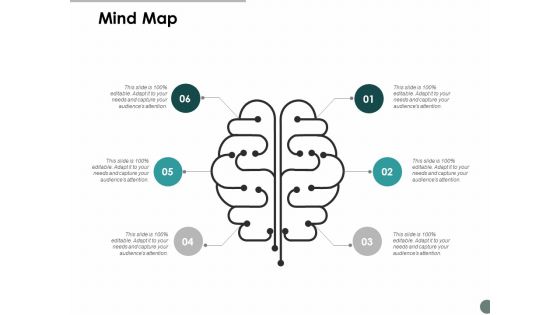
Mind Map Knowledge Ppt Powerpoint Presentation Pictures Slideshow
This is a mind map knowledge ppt powerpoint presentation pictures slideshow. This is a six stage process. The stages in this process are mind map knowledge, business, management.
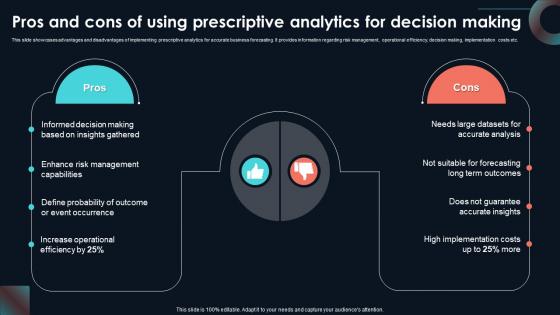
Pros And Cons Of Using Prescriptive Developing Strategic Insights Using Big Data Analytics SS V
This slide showcases advantages and disadvantages of implementing prescriptive analytics for accurate business forecasting. It provides information regarding risk management, operational efficiency, decision making, implementation costs etc. This Pros And Cons Of Using Prescriptive Developing Strategic Insights Using Big Data Analytics SS V is perfect for any presentation, be it in front of clients or colleagues. It is a versatile and stylish solution for organizing your meetings. The Pros And Cons Of Using Prescriptive Developing Strategic Insights Using Big Data Analytics SS V features a modern design for your presentation meetings. The adjustable and customizable slides provide unlimited possibilities for acing up your presentation. Slidegeeks has done all the homework before launching the product for you. So, do not wait, grab the presentation templates today This slide showcases advantages and disadvantages of implementing prescriptive analytics for accurate business forecasting. It provides information regarding risk management, operational efficiency, decision making, implementation costs etc.
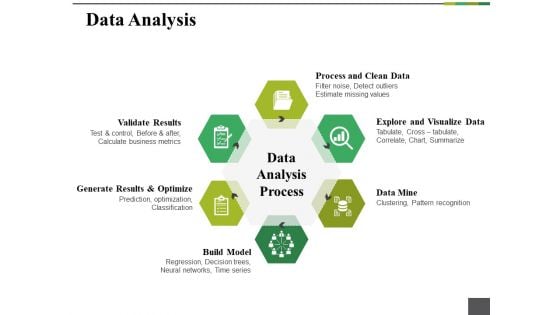
Data Analysis Ppt PowerPoint Presentation Outline Example Topics
This is a data analysis ppt powerpoint presentation outline example topics. This is a six stage process. The stages in this process are data mine, build model, validate results, process and clean data, data analysis process.
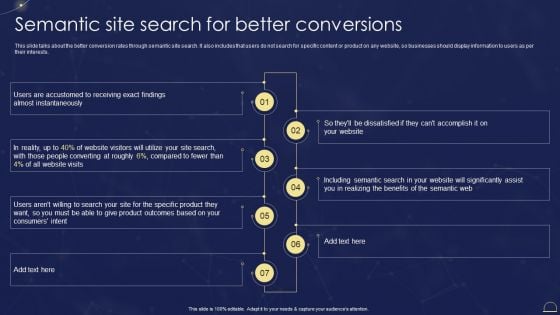
Semantic Web Technologies Semantic Site Search For Better Conversions Guidelines PDF
This slide talks about the better conversion rates through semantic site search. It also includes that users do not search for specific content or product on any website, so businesses should display information to users as per their interests. The Semantic Web Technologies Semantic Site Search For Better Conversions Guidelines PDF is a compilation of the most recent design trends as a series of slides. It is suitable for any subject or industry presentation, containing attractive visuals and photo spots for businesses to clearly express their messages. This template contains a variety of slides for the user to input data, such as structures to contrast two elements, bullet points, and slides for written information. Slidegeeks is prepared to create an impression.

Customer Mapping Touch Points Diagram Powerpoint Show
This is a customer mapping touch points diagram powerpoint show. This is a four stage process. The stages in this process are store, website, call center, post order.
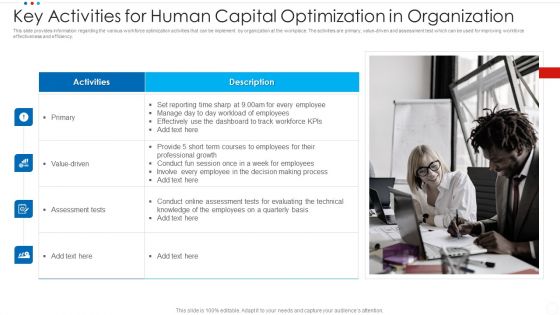
Key Activities For Human Capital Optimization In Organization Brochure PDF
Persuade your audience using this key activities for human capital optimization in organization brochure pdf. This PPT design covers four stages, thus making it a great tool to use. It also caters to a variety of topics including dashboard, evaluating, technical. Download this PPT design now to present a convincing pitch that not only emphasizes the topic but also showcases your presentation skills.
Lego Ppt PowerPoint Presentation Pictures Designs Download
This is a lego ppt powerpoint presentation pictures designs download. This is a five stage process. The stages in this process are lego icons, marketing, analysis, game, business, success.
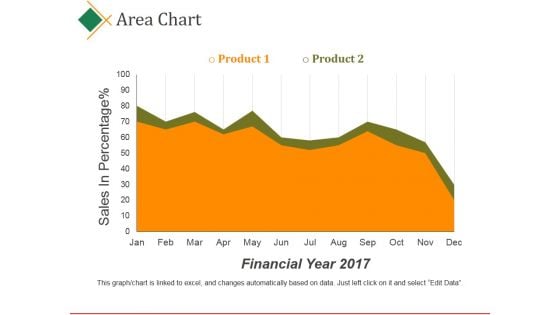
Area Chart Ppt PowerPoint Presentation Pictures Files
This is a area chart ppt powerpoint presentation pictures files. This is a two stage process. The stages in this process are product, sales, in percentage, financial year, business.
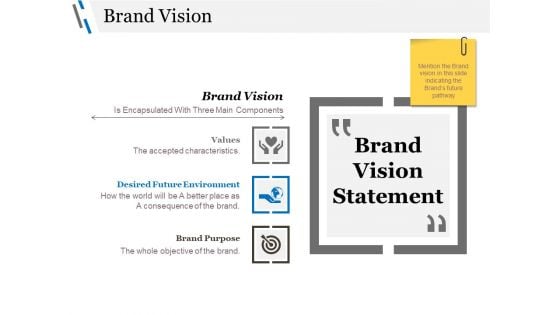
Brand Vision Ppt PowerPoint Presentation Pictures Files
This is a brand vision ppt powerpoint presentation pictures files. This is a three stage process. The stages in this process are values, desired future environment, brand purpose, business, quotes.

Clustered Bar Ppt PowerPoint Presentation Pictures Example
This is a clustered bar ppt powerpoint presentation pictures example. This is a three stage process. The stages in this process are product, unit count, clustered bar, business, marketing.
Tracking The Actual Sales Figures After Deal Strategic Sales Plan To Enhance Summary Pdf
This slide provides glimpse about dashboard analysis that can help the business to track the performance of the sales team. It includes KPIs such as revenues, profit, orders placed, conversion placed, conversion rate, customers, etc. Boost your pitch with our creative Tracking The Actual Sales Figures After Deal Strategic Sales Plan To Enhance Summary Pdf. Deliver an awe-inspiring pitch that will mesmerize everyone. Using these presentation templates you will surely catch everyones attention. You can browse the ppts collection on our website. We have researchers who are experts at creating the right content for the templates. So you do not have to invest time in any additional work. Just grab the template now and use them. This slide provides glimpse about dashboard analysis that can help the business to track the performance of the sales team. It includes KPIs such as revenues, profit, orders placed, conversion placed, conversion rate, customers, etc.
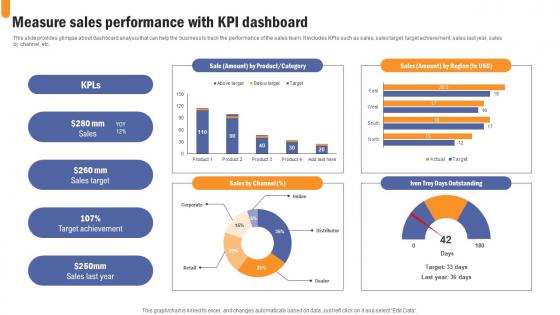
Measure Sales Performance With KPI Developing Extensive Sales And Operations Strategy Brochure Pdf
This slide provides glimpse about dashboard analysis that can help the business to track the performance of the sales team. It includes KPIs such as sales, sales target, target achievement, sales last year, sales by channel, etc. The best PPT templates are a great way to save time, energy, and resources. Slidegeeks have 100 percent editable powerpoint slides making them incredibly versatile. With these quality presentation templates, you can create a captivating and memorable presentation by combining visually appealing slides and effectively communicating your message. Download Measure Sales Performance With KPI Developing Extensive Sales And Operations Strategy Brochure Pdf from Slidegeeks and deliver a wonderful presentation. This slide provides glimpse about dashboard analysis that can help the business to track the performance of the sales team. It includes KPIs such as sales, sales target, target achievement, sales last year, sales by channel, etc.
Tracking The Actual Sales Developing Extensive Sales And Operations Strategy Designs Pdf
This slide provides glimpse about dashboard analysis that can help the business to track the performance of the sales team. It includes kpis such as revenues, profit, orders placed, conversion placed, conversion rate, customers, etc. There are so many reasons you need a Tracking The Actual Sales Developing Extensive Sales And Operations Strategy Designs Pdf. The first reason is you can not spend time making everything from scratch, Thus, Slidegeeks has made presentation templates for you too. You can easily download these templates from our website easily. This slide provides glimpse about dashboard analysis that can help the business to track the performance of the sales team. It includes kpis such as revenues, profit, orders placed, conversion placed, conversion rate, customers, etc.
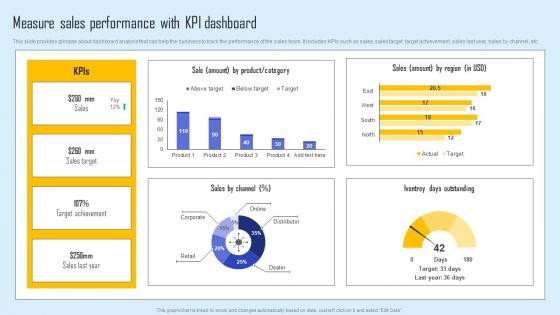
Measure Sales Performance Effective Sales Strategy To Enhance Customer Retention Diagrams Pdf
This slide provides glimpse about dashboard analysis that can help the business to track the performance of the sales team. It includes KPIs such as sales, sales target, target achievement, sales last year, sales by channel, etc. The best PPT templates are a great way to save time, energy, and resources. Slidegeeks have 100 percent editable powerpoint slides making them incredibly versatile. With these quality presentation templates, you can create a captivating and memorable presentation by combining visually appealing slides and effectively communicating your message. Download Measure Sales Performance Effective Sales Strategy To Enhance Customer Retention Diagrams Pdf from Slidegeeks and deliver a wonderful presentation. This slide provides glimpse about dashboard analysis that can help the business to track the performance of the sales team. It includes KPIs such as sales, sales target, target achievement, sales last year, sales by channel, etc.
Tracking The Actual Sales Effective Sales Strategy To Enhance Customer Retention Icons Pdf
This slide provides glimpse about dashboard analysis that can help the business to track the performance of the sales team. It includes KPIs such as revenues, profit, orders placed, conversion placed, conversion rate, customers, etc. Find a pre designed and impeccable Tracking The Actual Sales Effective Sales Strategy To Enhance Customer Retention Icons Pdf. The templates can ace your presentation without additional effort. You can download these easy to edit presentation templates to make your presentation stand out from others. So, what are you waiting for Download the template from Slidegeeks today and give a unique touch to your presentation. This slide provides glimpse about dashboard analysis that can help the business to track the performance of the sales team. It includes KPIs such as revenues, profit, orders placed, conversion placed, conversion rate, customers, etc.
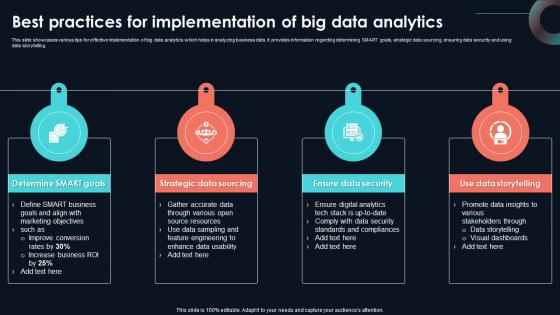
Best Practices For Implementation Of Developing Strategic Insights Using Big Data Analytics SS V
This slide showcases various tips for effective implementation of big data analytics which helps in analyzing business data. It provides information regarding determining SMART goals, strategic data sourcing, ensuring data security and using data storytelling. Present like a pro with Best Practices For Implementation Of Developing Strategic Insights Using Big Data Analytics SS V. Create beautiful presentations together with your team, using our easy-to-use presentation slides. Share your ideas in real-time and make changes on the fly by downloading our templates. So whether you are in the office, on the go, or in a remote location, you can stay in sync with your team and present your ideas with confidence. With Slidegeeks presentation got a whole lot easier. Grab these presentations today. This slide showcases various tips for effective implementation of big data analytics which helps in analyzing business data. It provides information regarding determining SMART goals, strategic data sourcing, ensuring data security and using data storytelling.
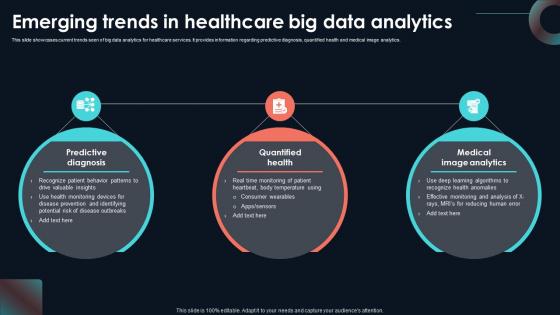
Emerging Trends In Healthcare Big Developing Strategic Insights Using Big Data Analytics SS V
This slide showcases current trends seen of big data analytics for healthcare services. It provides information regarding predictive diagnosis, quantified health and medical image analytics. Are you searching for a Emerging Trends In Healthcare Big Developing Strategic Insights Using Big Data Analytics SS V that is uncluttered, straightforward, and original Its easy to edit, and you can change the colors to suit your personal or business branding. For a presentation that expresses how much effort you have put in, this template is ideal With all of its features, including tables, diagrams, statistics, and lists, its perfect for a business plan presentation. Make your ideas more appealing with these professional slides. Download Emerging Trends In Healthcare Big Developing Strategic Insights Using Big Data Analytics SS V from Slidegeeks today. This slide showcases current trends seen of big data analytics for healthcare services. It provides information regarding predictive diagnosis, quantified health and medical image analytics.
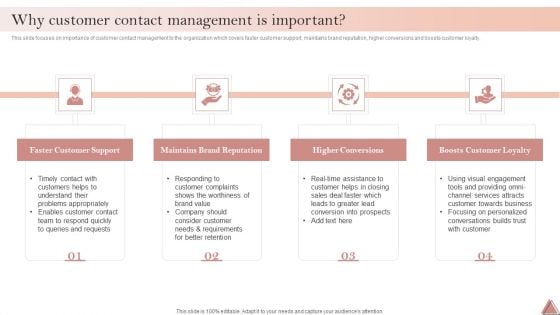
Enhancing Client Engagement Why Customer Contact Management Is Important Elements PDF
This slide focuses on importance of customer contact management to the organization which covers faster customer support, maintains brand reputation, higher conversions and boosts customer loyalty. The Enhancing Client Engagement Why Customer Contact Management Is Important Elements PDF is a compilation of the most recent design trends as a series of slides. It is suitable for any subject or industry presentation, containing attractive visuals and photo spots for businesses to clearly express their messages. This template contains a variety of slides for the user to input data, such as structures to contrast two elements, bullet points, and slides for written information. Slidegeeks is prepared to create an impression.
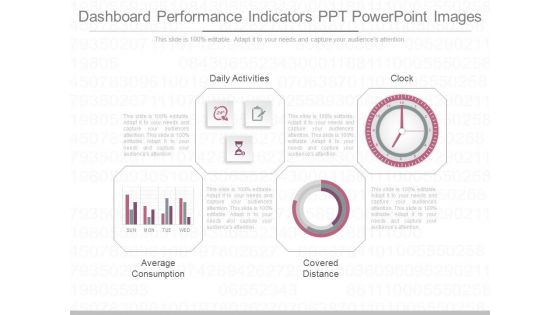
Dashboard Performance Indicators Ppt Powerpoint Images
This is a dashboard performance indicators ppt powerpoint images. This is a four stage process. The stages in this process are daily activities, average consumption, covered distance, clock.
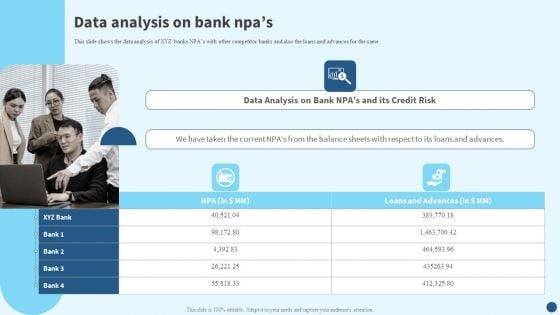
Credit Risk Management Data Analysis On Bank Npas Microsoft PDF
This slide shows the data analysis of XYZ banks NPAs with other competitor banks and also the loans and advances for the same. Whether you have daily or monthly meetings, a brilliant presentation is necessary. Credit Risk Management Data Analysis On Bank Npas Microsoft PDF can be your best option for delivering a presentation. Represent everything in detail using Credit Risk Management Data Analysis On Bank Npas Microsoft PDF and make yourself stand out in meetings. The template is versatile and follows a structure that will cater to your requirements. All the templates prepared by Slidegeeks are easy to download and edit. Our research experts have taken care of the corporate themes as well. So, give it a try and see the results.
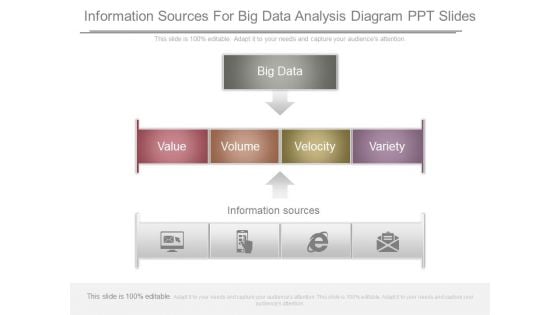
Information Sources For Big Data Analysis Diagram Ppt Slides
This is a information sources for big data analysis diagram ppt slides. This is a three stage process. The stages in this process are big data, value, volume, velocity, variety, information sources.
Stock Photo Enjoy Working With Team PowerPoint Template
Delight Them With Our Stock Photo Enjoy Working With Team Powerpoint Template Powerpoint Templates.

Stock Photo Stack Of 100 Dollars Bundles PowerPoint Slide
Delight Them With Our Stock Photo Stack Of 100 Dollars Bundles Powerpoint Slide Powerpoint Templates.
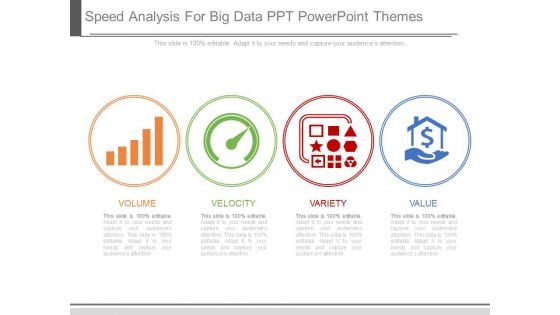
Speed Analysis For Big Data Ppt Powerpoint Themes
This is a speed analysis for big data ppt powerpoint themes. This is a four stage process. The stages in this process are volume, velocity, variety, value.

Insight Of Data Governance Framework Diagram Powerpoint Guide
This is a insight of data governance framework diagram powerpoint guide. This is a four stage process. The stages in this process are analytics applied, information management, analytic insights, performance optimization.
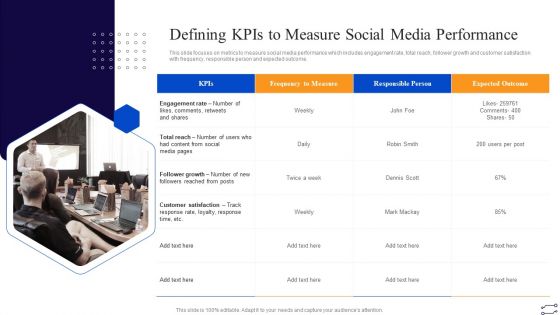
Online Marketing Tactics To Enhance Sales Defining Kpis To Measure Social Media Performance Elements PDF
This slide focuses on metrics to measure social media performance which includes engagement rate, total reach, follower growth and customer satisfaction with frequency, responsible person and expected outcome. Presenting Online Marketing Tactics To Enhance Sales Defining Kpis To Measure Social Media Performance Elements PDF to provide visual cues and insights. Share and navigate important information on one stages that need your due attention. This template can be used to pitch topics like Frequency To Measure, Responsible Person, Kpis. In addtion, this PPT design contains high resolution images, graphics, etc, that are easily editable and available for immediate download.

Pie Chart With Increasing Percentage Values Powerpoint Slides
This PowerPoint template has been designed with diagram of pie chart with increasing percentage values. This PPT slide can be used to prepare presentations for profit growth report and also for financial data analysis. You can download finance PowerPoint template to prepare awesome presentations.
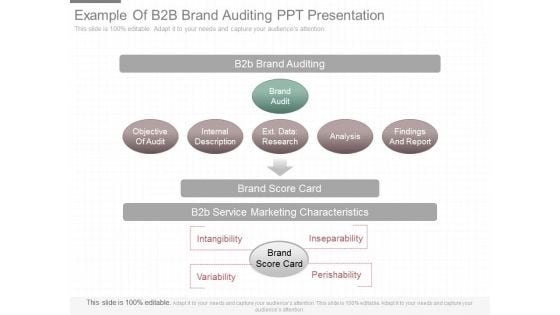
Example Of B2b Brand Auditing Ppt Presentation
This is a example of b2b brand auditing ppt presentation. This is a six stage process. The stages in this process are b2b brand auditing, brand audit, objective of audit, internal description, ext data research, analysis, findings and report, brand score card, b2b service marketing characteristics, intangibility, variability, inseparability, perishability, brand score card.
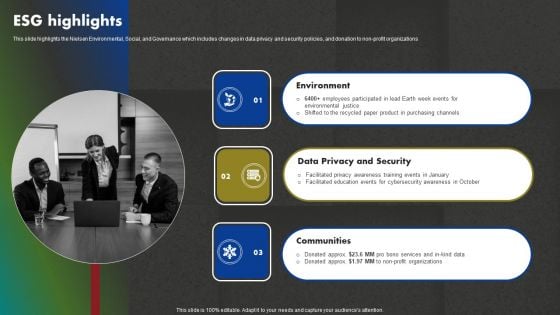
Data And Customer Analysis Company Outline ESG Highlights Structure PDF
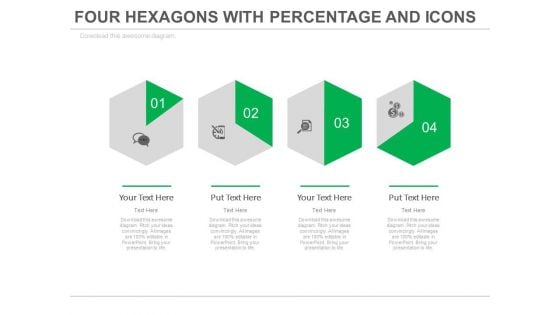
Four Steps Of Financial Growth Analysis Powerpoint Slides
This PowerPoint template with multiple Hexagons can be creatively used to present a timeline in a visual manner. This slide can also help the audience understand a 6 step process in an easier manner. The icons are totally customizable and can be edited to represent the particular process happening at that stage. It can also be used to represent different times or different activities to be carried out at different times in in a day in an office or an organization (e.g. - Medicine schedule) since the hexagon represents a clock and change of shade moves in a clockwise manner. The diagram can be used to represent a comparison or a report or an analysis of the data.
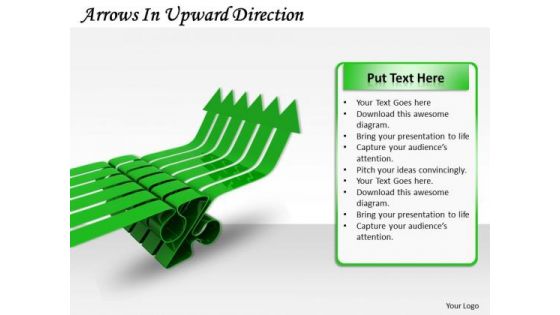
Stock Photo Arrows In Upward Direction Ppt Template
Our Stock Photo Arrows In Upward Direction PPT template Powerpoint Templates Abhor Doodling. They Never Let The Interest Flag.

Stock Photo Learn About Dna Structure Ppt Template
Touch Base With Our Stock Photo Learn About DNA Structure PPT template Powerpoint Templates. Review Your Growth With Your Audience.

Stock Photo Speak Up For Your Rights Ppt Template
Our Stock Photo Speak Up For Your Rights PPT template Powerpoint Templates Enjoy Drama. They Provide Entertaining Backdrops.

Stock Photo Time To Study Books Ppt Template
Draw It Out On Our Stock Photo Time To Study Books PPT template Powerpoint Templates. Provide Inspiration To Your Colleagues.

Stock Photo Time To Read Books PowerPoint Template
Our stock photo Time To Read Books powerpoint template Powerpoint Templates Abhor Doodling. They Never Let The Interest Flag.

Stock Photo Books And Clock Graphic Design PowerPoint Template
Get The Doers Into Action. Activate Them With Our Stock Photo Books And Clock Graphic Design Powerpoint Template Powerpoint Templates.
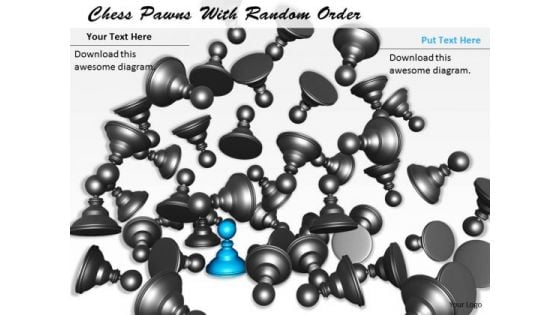
Stock Photo Chess Pawns With Random Order PowerPoint Template
Our Stock Photo Chess Pawns With Random Order Powerpoint Template Powerpoint Templates Abhor Doodling. They Never Let The Interest Flag.
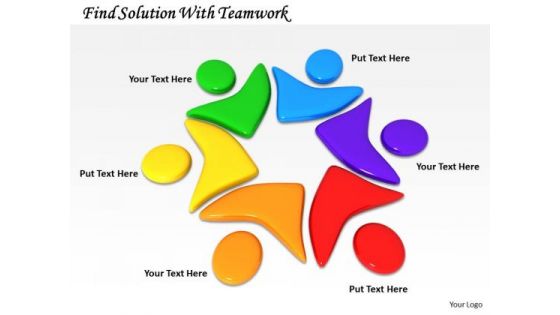
Stock Photo Find Solution With Teamwork PowerPoint Template
Our Stock Photo Find Solution With Teamwork Powerpoint Template Powerpoint Templates Heighten Concentration. Your Audience Will Be On The Edge.
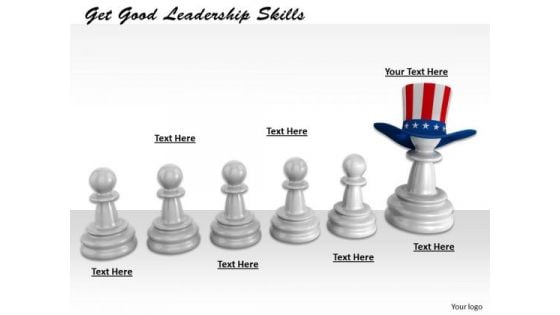
Stock Photo Get Good Leadership Skills PowerPoint Template
Make Some Dough With Our Stock Photo Get Good Leadership Skills Powerpoint Template Powerpoint Templates. Your Assets Will Rise Significantly.
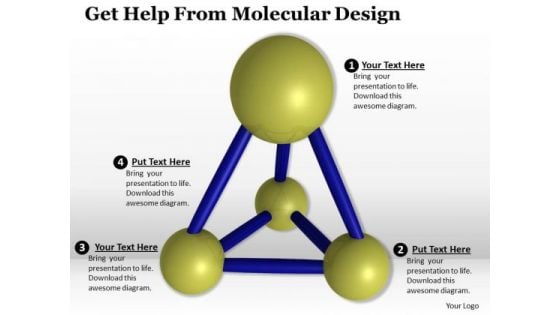
Stock Photo Get Help From Molecular Design PowerPoint Template
Our Stock Photo Get Help From Molecular Design Powerpoint Template Powerpoint Templates Enjoy Drama. They Provide Entertaining Backdrops.
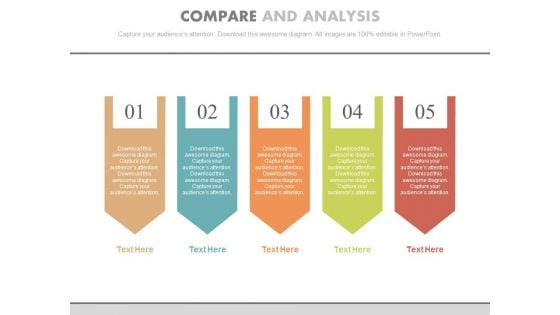
Five Steps For Data Compare And Analysis Powerpoint Template
Our above slide contains graphics of five steps chart. This PowerPoint template is useful for data compare and analysis. Use this diagram to impart more clarity to subject and to create more sound impact on viewers.
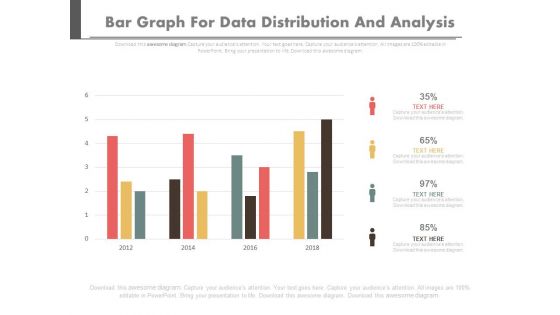
Bar Graph For Data Distribution And Analysis Powerpoint Slides
This PowerPoint template has been designed with bar graph. This PowerPoint diagram is useful for data distribution and analysis This diagram slide can be used to make impressive presentations.
Data Collection And Analysis Ppt Powerpoint Presentation Icon Example Topics
This is a data collection and analysis ppt powerpoint presentation icon example topics. This is a four stage process. The stages in this process are productivity improvement, output improvement, productivity enhancement.
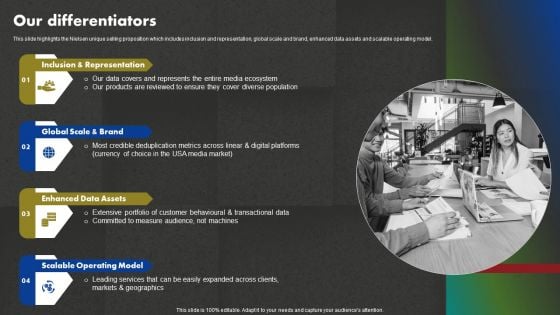
Data And Customer Analysis Company Outline Our Differentiators Elements PDF
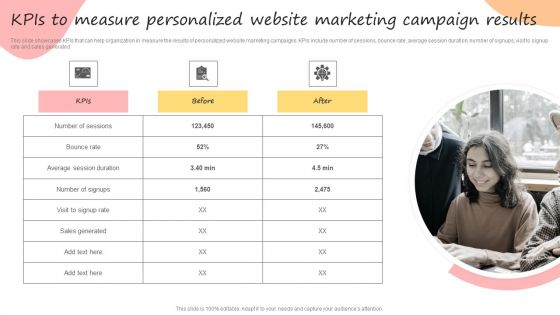
Developing Promotional Strategic Plan For Online Marketing Kpis To Measure Personalized Website Marketing Diagrams PDF
The best PPT templates are a great way to save time, energy, and resources. Slidegeeks have 100 percent editable powerpoint slides making them incredibly versatile. With these quality presentation templates, you can create a captivating and memorable presentation by combining visually appealing slides and effectively communicating your message. Download Developing Promotional Strategic Plan For Online Marketing Kpis To Measure Personalized Website Marketing Diagrams PDF from Slidegeeks and deliver a wonderful presentation.


 Continue with Email

 Home
Home


