Business Snapshot
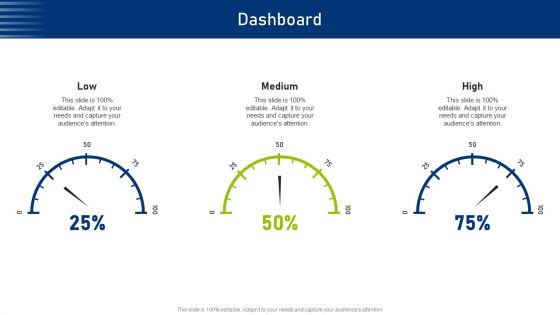
Six Components For Consumer Centric Techniques Dashboard Ppt Ideas Clipart Images PDF
This is a six components for consumer centric techniques dashboard ppt ideas clipart images pdf template with various stages. Focus and dispense information on three stages using this creative set, that comes with editable features. It contains large content boxes to add your information on topics like low, medium, high. You can also showcase facts, figures, and other relevant content using this PPT layout. Grab it now.
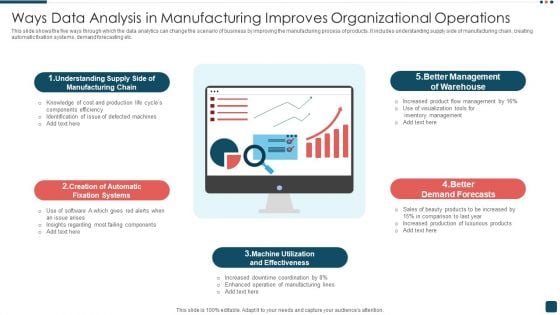
Ways Data Analysis In Manufacturing Improves Organizational Operations Formats PDF
This slide shows the five ways through which the data analytics can change the scenario of business by improving the manufacturing process of products. It includes understanding supply side of manufacturing chain, creating automatic fixation systems, demand forecasting etc. Persuade your audience using this Ways Data Analysis In Manufacturing Improves Organizational Operations Formats PDF. This PPT design covers five stages, thus making it a great tool to use. It also caters to a variety of topics including Manufacturing Chain, Better Management, Demand Forecasts. Download this PPT design now to present a convincing pitch that not only emphasizes the topic but also showcases your presentation skills.
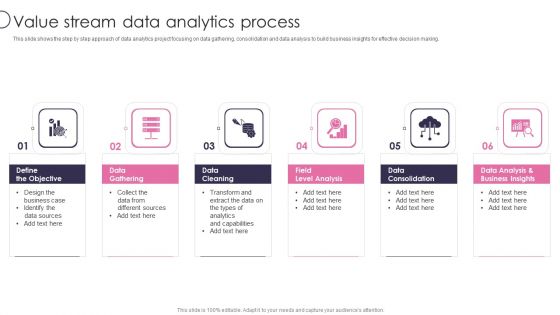
Information Transformation Process Toolkit Value Stream Data Analytics Process Demonstration PDF
This slide shows the step by step approach of data analytics project focusing on data gathering, consolidation and data analysis to build business insights for effective decision making. Presenting Information Transformation Process Toolkit Value Stream Data Analytics Process Demonstration PDF to provide visual cues and insights. Share and navigate important information on six stages that need your due attention. This template can be used to pitch topics like Data Cleaning, Field Level Analysis, Data Consolidation, Data Gathering. In addtion, this PPT design contains high resolution images, graphics, etc, that are easily editable and available for immediate download.
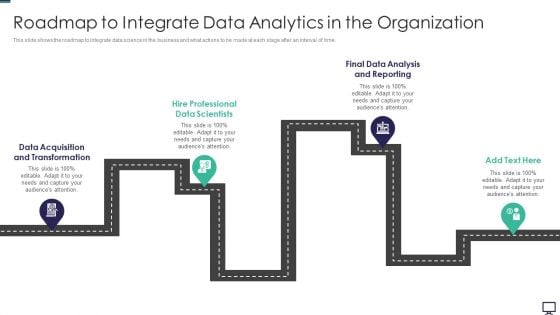
Roadmap To Integrate Data Analytics In The Organization Ppt Show Background Images PDF
This slide shows the roadmap to integrate data science in the business and what actions to be made at each stage after an interval of time. Presenting roadmap to integrate data analytics in the organization ppt show background images pdf to provide visual cues and insights. Share and navigate important information on four stages that need your due attention. This template can be used to pitch topics like data acquisition, analysis, data. In addtion, this PPT design contains high resolution images, graphics, etc, that are easily editable and available for immediate download.

Performance Review Powerpoint Presentation Slides
Increase your chances of writing a winning business proposal and grabbing your prospects attention with this well-crafted, innovative Performance Review Powerpoint Presentation Slides. This Employee Evaluation, Productivity Assessment, Performance Metrics, Post Performance Survey, Performance Analysis, Evaluation Criteria-slide presentation template comes with in-built content to help you outline a presentation that can serve as an industry benchmark. The complete deck also makes use of an impressive color scheme to create a visual impact and hook the audience. Use this PPT to plan how your business can be the Numero uno in its segment within no time at all. Download now to showcase your brand USP and offerings to engage your client. Boost your market performance by sing our comprehensive and professionally designed PowerPoint presentation Performance Review Process Powerpoint Presentation Slides that includes key features such as tools for employee assessments, promotions, appraisals, cost accounting, and confidential record management, ensuring a holistic approach to performance improvement. This PPT offers data driven insights to streamline overall performance strategy. The performance coaching presentation template helps you to review the productivity and profitability of your organization.Download this performance management presentation deck and achieve your business target in an effective manner.
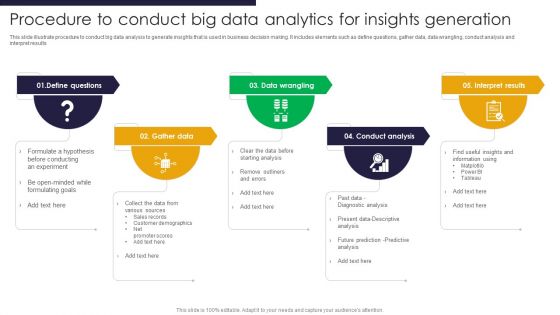
Procedure To Conduct Big Data Analytics For Insights Generation Introduction PDF
This slide illustrate procedure to conduct big data analysis to generate insights that is used in business decision making. It includes elements such as define questions, gather data, data wrangling, conduct analysis and interpret results Persuade your audience using this Procedure To Conduct Big Data Analytics For Insights Generation Introduction PDF. This PPT design covers six stages, thus making it a great tool to use. It also caters to a variety of topics including Define Questions, Gather Data, Data Wrangling. Download this PPT design now to present a convincing pitch that not only emphasizes the topic but also showcases your presentation skills.
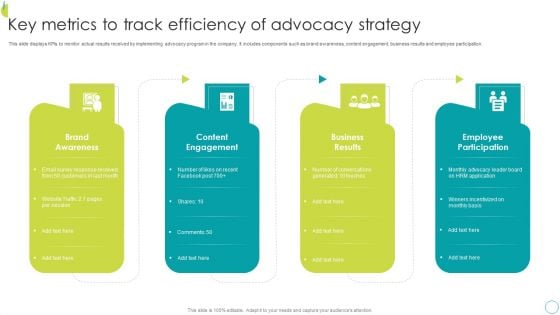
Key Metrics To Track Efficiency Of Advocacy Strategy Brochure PDF
This slide displays KPIs to monitor actual results received by implementing advocacy program in the company. It includes components such as brand awareness, content engagement, business results and employee participation. Presenting Key Metrics To Track Efficiency Of Advocacy Strategy Brochure PDF to dispense important information. This template comprises four stages. It also presents valuable insights into the topics including Strategy, Efficiency, Advocacy. This is a completely customizable PowerPoint theme that can be put to use immediately. So, download it and address the topic impactfully.
Recruitment Hiring Analysis Report For New Employees Ppt PowerPoint Presentation Icon Infographics PDF
Presenting this set of slides with name recruitment hiring analysis report for new employees ppt powerpoint presentation icon infographics pdf. This is a three stage process. The stages in this process are recruitment hiring analysis report for new employees. This is a completely editable PowerPoint presentation and is available for immediate download. Download now and impress your audience.
Recruitment Report Sheet Analysis Icon To Identify Resource Gaps Clipart PDF
Persuade your audience using this Recruitment Report Sheet Analysis Icon To Identify Resource Gaps Clipart PDF. This PPT design covers Three stages, thus making it a great tool to use. It also caters to a variety of topics including Recruitment Report, Sheet Analysis, Identify Resource Gaps. Download this PPT design now to present a convincing pitch that not only emphasizes the topic but also showcases your presentation skills.
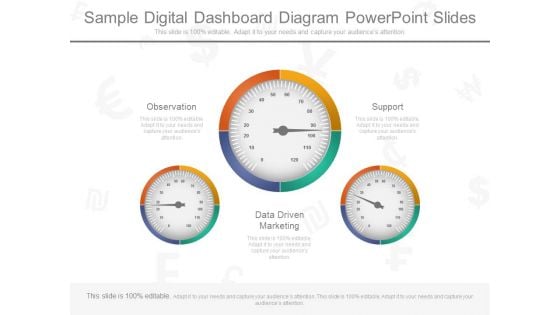
Sample Digital Dashboard Diagram Powerpoint Slides
This is a sample digital dashboard diagram powerpoint slides. This is a three stage process. The stages in this process are observation, support , data driven marketing.
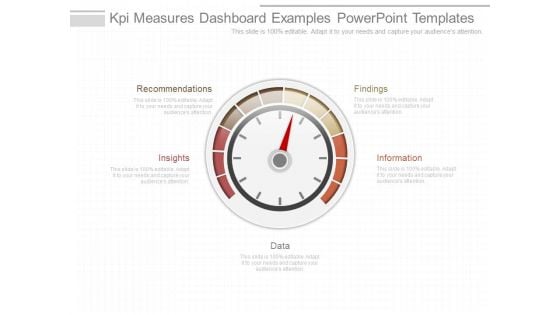
Kpi Measures Dashboard Examples Powerpoint Templates
This is a kpi measures dashboard examples powerpoint templates. This is a four stage process. The stages in this process are recommendations, insights, data, information, findings.
Operational Risk Metrics Dashboard Icon Mockup PDF
Presenting Operational Risk Metrics Dashboard Icon Mockup PDF to dispense important information. This template comprises four stages. It also presents valuable insights into the topics including Operational Risk Metrics Dashboard Icon. This is a completely customizable PowerPoint theme that can be put to use immediately. So, download it and address the topic impactfully.
KPI Dashboard Metrics Security Icon Download PDF
Persuade your audience using this KPI Dashboard Metrics Security Icon Download PDF. This PPT design covers two stages, thus making it a great tool to use. It also caters to a variety of topics including Kpi Dashboard, Metrics Security Icon. Download this PPT design now to present a convincing pitch that not only emphasizes the topic but also showcases your presentation skills.
Maintenance Performance Metrics Dashboard Icon Inspiration PDF
Presenting Maintenance Performance Metrics Dashboard Icon Inspiration PDF to dispense important information. This template comprises three stages. It also presents valuable insights into the topics including Maintenance Performance, Metrics Dashboard Icon. This is a completely customizable PowerPoint theme that can be put to use immediately. So, download it and address the topic impactfully.
Data Lake Development With Azure Cloud Software Use Cases Of Centralized Repository Data Lake Icons PDF
This slide depicts the use cases of data lakes such as data in place analytics, machine learning model training and archival and historical data storage. Presenting Data Lake Development With Azure Cloud Software Use Cases Of Centralized Repository Data Lake Icons PDF to provide visual cues and insights. Share and navigate important information on five stages that need your due attention. This template can be used to pitch topics like Business Metrics, Economic, Analysis. In addtion, this PPT design contains high resolution images, graphics, etc, that are easily editable and available for immediate download.
Icons Slide Data Analytics Company Outline Sample PDF
Introducing our well designed Icons Slide Data Analytics Company Outline Sample PDF set of slides. The slide displays editable icons to enhance your visual presentation. The icons can be edited easily. So customize according to your business to achieve a creative edge. Download and share it with your audience. The following slide highlights the list of industries that are served by kantar company to provide expert services as research and consulting firm. The industries included are automotive and mobility, consumer packaged goods, energy and utilities, fashion, beauty and luxury, finance, government and public sector, health, hospitality, leisure and travel media, retail, sport and leisure and technology and telecoms.
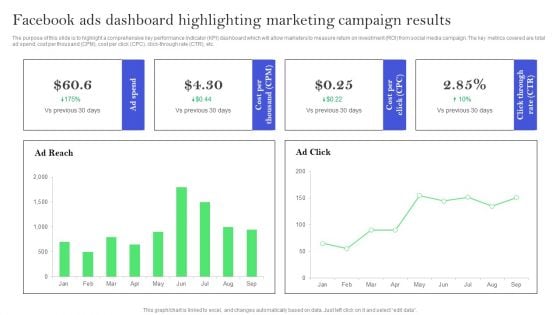
Facebook Ads Dashboard Highlighting Marketing Campaign Results Slides PDF
The purpose of this slide is to highlight a comprehensive key performance indicator KPI dashboard which will allow marketers to measure return on investment ROI from social media campaign. The key metrics covered are total ad spend, cost per thousand CPM, cost per click CPC, click through rate CTR, etc. From laying roadmaps to briefing everything in detail, our templates are perfect for you. You can set the stage with your presentation slides. All you have to do is download these easy to edit and customizable templates. Facebook Ads Dashboard Highlighting Marketing Campaign Results Slides PDF will help you deliver an outstanding performance that everyone would remember and praise you for. Do download this presentation today.
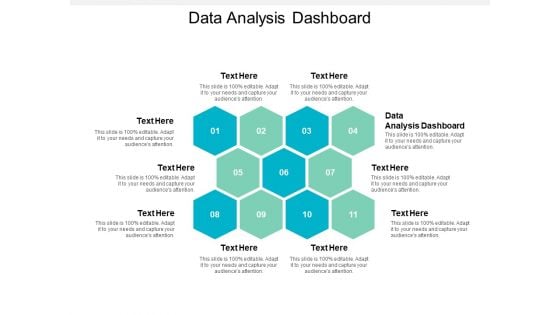
Data Analysis Dashboard Ppt PowerPoint Presentation Styles Maker Cpb
This is a data analysis dashboard ppt powerpoint presentation styles maker cpb. This is a eleven stage process. The stages in this process are data analysis dashboard.
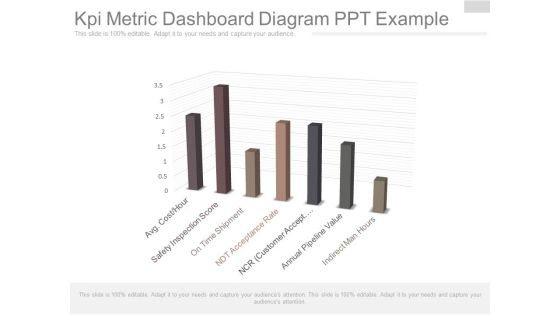
Kpi Metric Dashboard Diagram Ppt Example
This is a kpi metric dashboard diagram ppt example. This is a seven stage process. The stages in this process are avg cost hour, safety inspection score, on time shipment, ndt acceptance rate, ncr customer accept, annual pipeline value, indirect man hours.
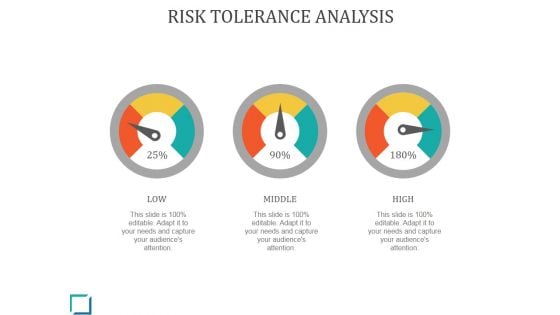
Risk Tolerance Analysis Ppt PowerPoint Presentation Background Image
This is a risk tolerance analysis ppt powerpoint presentation background image. This is a three stage process. The stages in this process are high, low, middle, dashboard, measurement.
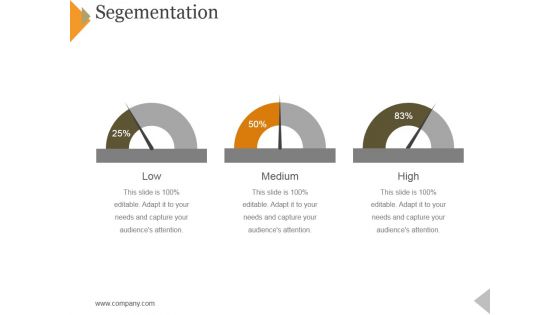
Segementation Ppt PowerPoint Presentation Infographic Template Smartart
This is a segementation ppt powerpoint presentation infographic template smartart. This is a three stage process. The stages in this process are low, medium, high, dashboard, measurement.
Data Analysis Project Plan Transformation Toolkit Competitive Intelligence Information Analysis Icons PDF
The slide outline the key steps for data analytics methodology. It initiates with defining business objectives to data understanding, modelling and ends at data visualization and presentation. Boost your pitch with our creative Data Analysis Project Plan Transformation Toolkit Competitive Intelligence Information Analysis Icons PDF. Deliver an awe inspiring pitch that will mesmerize everyone. Using these presentation templates you will surely catch everyones attention. You can browse the ppts collection on our website. We have researchers who are experts at creating the right content for the templates. So you do not have to invest time in any additional work. Just grab the template now and use them.

Case Competition Customer Attrition In A BPO Powerpoint Presentation Slides
Use this Case Competition Customer Attrition In A BPO Powerpoint Presentation Slides to ensure the business world gets to know you as a presentation expert with tremendous recall value. With its focus on providing the worlds best designs to highlight business ideas that have the potential to change the world, this PPT Template is sure to win you clients. The complete deck in Customer Attrition, BPO, Customer Analysis, Strategy slides is a compendium of information, structured in a manner that provides the best framework for a presentation. Use this completely editable and customizable presentation to make an impact and improve your order book. Download now. Design an engaging presentation with our case competition customer attrition in a BPO PowerPoint presentation slides. It is essential for the working-class to be well versed with the current market situation in order to function smoothly, therefore, this consumer attrition PowerPoint layout has it on an easy access. Including SWOT analysis, company overview, company estimated future targets, challenges, solutions, key metrics, and much more, this customer abrasion PPT deck is a must have in your organization. This PowerPoint bundle showcases the figures on consumer satisfaction level, decrease in revenue, and average consumer queue time in order for the audience to be well attentive regarding the same. The helpful slides in this buyer attenuation creative PPT set includes all the persisting or possible problems that might occur in the business, along with corrective measures for each and every problem that will help the company to grow.
Tracking The Improvements Exhaustive Guide Of Pay Per Click Advertising Initiatives Topics Pdf
This slide showcases the KPIs that would help the business organization to evaluate Pay Per Click PPC marketing campaigns improvements. It includes Google Ads conversion rate, funnel, leads converted vs. cost trend, Cost Per Click CPC, etc. Do you know about Slidesgeeks Tracking The Improvements Exhaustive Guide Of Pay Per Click Advertising Initiatives Topics Pdf These are perfect for delivering any kind od presentation. Using it, create PowerPoint presentations that communicate your ideas and engage audiences. Save time and effort by using our pre designed presentation templates that are perfect for a wide range of topic. Our vast selection of designs covers a range of styles, from creative to business, and are all highly customizable and easy to edit. Download as a PowerPoint template or use them as Google Slides themes. This slide showcases the KPIs that would help the business organization to evaluate Pay Per Click PPC marketing campaigns improvements. It includes Google Ads conversion rate, funnel, leads converted vs. cost trend, Cost Per Click CPC, etc.
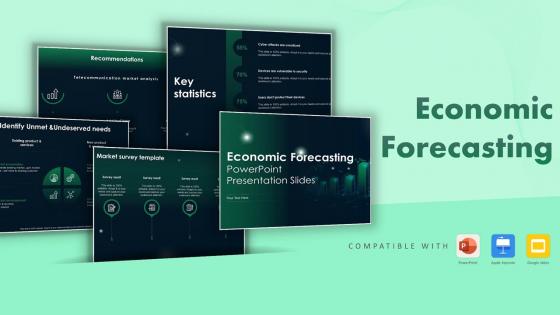
Economic Forecasting Powerpoint Presentation Slides

Statistical Analysis Impact On Data Analytics For Informed Decision Ppt PowerPoint
This slide illustrates the business impact of performing statistical analysis. The parameters described in this slide are data-driven decision-making, operational efficiency, customer insights, quality control, revenue optimization, risk management, etc. Presenting this PowerPoint presentation, titled Statistical Analysis Impact On Data Analytics For Informed Decision Ppt PowerPoint, with topics curated by our researchers after extensive research. This editable presentation is available for immediate download and provides attractive features when used. Download now and captivate your audience. Presenting this Statistical Analysis Impact On Data Analytics For Informed Decision Ppt PowerPoint. Our researchers have carefully researched and created these slides with all aspects taken into consideration. This is a completely customizable Statistical Analysis Impact On Data Analytics For Informed Decision Ppt PowerPoint that is available for immediate downloading. Download now and make an impact on your audience. Highlight the attractive features available with our PPTs. This slide illustrates the business impact of performing statistical analysis. The parameters described in this slide are data-driven decision-making, operational efficiency, customer insights, quality control, revenue optimization, risk management, etc.
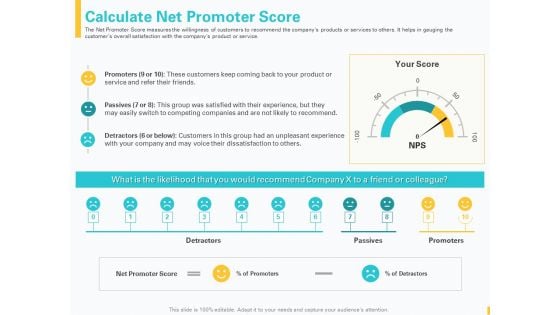
Designing Great Client Experience Action Plan Calculate Net Promoter Score Ppt Gallery Ideas PDF
The Net Promoter Score measures the willingness of customers to recommend the companys products or services to others. It helps in gauging the customers overall satisfaction with the companys product or service. This is a designing great client experience action plan calculate net promoter score ppt gallery ideas pdf template with various stages. Focus and dispense information on one stages using this creative set, that comes with editable features. It contains large content boxes to add your information on topics like promoters, passives, detractors, customers, net promoter score. You can also showcase facts, figures, and other relevant content using this PPT layout. Grab it now.
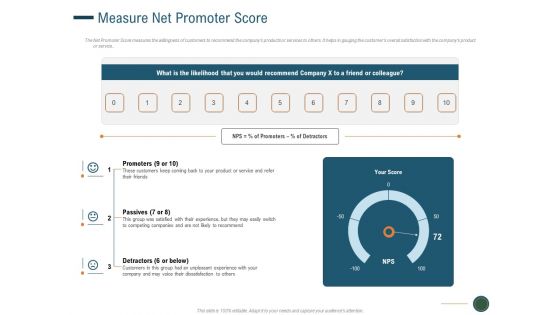
Enhance Profit Client Journey Analysis Measure Net Promoter Score Clipart PDF
The Net Promoter Score measures the willingness of customers to recommend the companys products or services to others. It helps in gauging the customers overall satisfaction with the companys product or service. This is a enhance profit client journey analysis measure net promoter score clipart pdf template with various stages. Focus and dispense information on three stages using this creative set, that comes with editable features. It contains large content boxes to add your information on topics like promoters, passives, detractors. You can also showcase facts, figures, and other relevant content using this PPT layout. Grab it now.
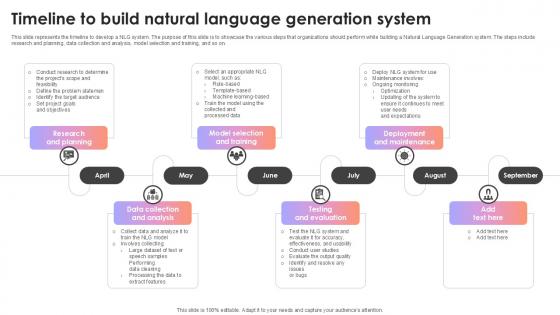
Timeline To Build Natural Language Generation System AI Content Creation It Ppt Sample
This slide represents the timeline to develop a NLG system. The purpose of this slide is to showcase the various steps that organizations should perform while building a Natural Language Generation system. The steps include research and planning, data collection and analysis, model selection and training, and so on. Make sure to capture your audiences attention in your business displays with our gratis customizable Timeline To Build Natural Language Generation System AI Content Creation It Ppt Sample These are great for business strategies, office conferences, capital raising or task suggestions. If you desire to acquire more customers for your tech business and ensure they stay satisfied, create your own sales presentation with these plain slides. This slide represents the timeline to develop a NLG system. The purpose of this slide is to showcase the various steps that organizations should perform while building a Natural Language Generation system. The steps include research and planning, data collection and analysis, model selection and training, and so on.
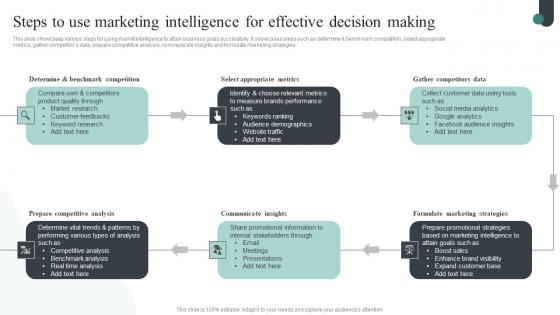
Competitive Intelligence Guide To Determine Market Steps To Use Marketing Intelligence Structure Pdf
This slide showcases various steps for using market intelligence to attain business goals successfully. It showcases steps such as determine and benchmark competition, select appropriate metrics, gather competitors data, prepare competitive analysis, communicate insights and formulate marketing strategies. Retrieve professionally designed Competitive Intelligence Guide To Determine Market Steps To Use Marketing Intelligence Structure Pdf to effectively convey your message and captivate your listeners. Save time by selecting pre-made slideshows that are appropriate for various topics, from business to educational purposes. These themes come in many different styles, from creative to corporate, and all of them are easily adjustable and can be edited quickly. Access them as PowerPoint templates or as Google Slides themes. You do not have to go on a hunt for the perfect presentation because Slidegeeks got you covered from everywhere. This slide showcases various steps for using market intelligence to attain business goals successfully. It showcases steps such as determine and benchmark competition, select appropriate metrics, gather competitors data, prepare competitive analysis, communicate insights and formulate marketing strategies.
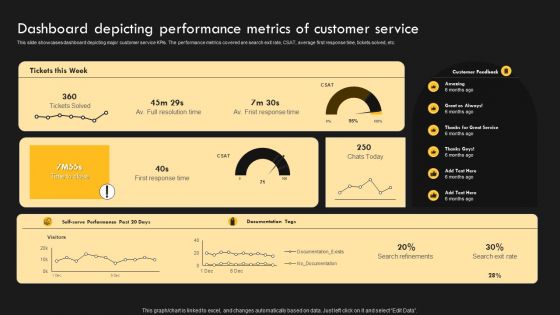
Service Improvement Techniques For Client Retention Dashboard Depicting Performance Metrics Diagrams PDF
This slide provides an overview of customer feedback survey conducted to evaluate their satisfaction level. It includes description, steps and benefits which are measure customer satisfaction This modern and well arranged Service Improvement Techniques For Client Retention Dashboard Depicting Performance Metrics Diagrams PDF provides lots of creative possibilities. It is very simple to customize and edit with the Powerpoint Software. Just drag and drop your pictures into the shapes. All facets of this template can be edited with Powerpoint no extra software is necessary. Add your own material, put your images in the places assigned for them, adjust the colors, and then you can show your slides to the world, with an animated slide included.
Vendor Performance KPI Analytical Dashboard Icon For Data Management Background PDF
Persuade your audience using this Vendor Performance KPI Analytical Dashboard Icon For Data Management Background PDF. This PPT design covers three stages, thus making it a great tool to use. It also caters to a variety of topics including Vendor Performance, KPI Analytical Dashboard, Icon Data Management. Download this PPT design now to present a convincing pitch that not only emphasizes the topic but also showcases your presentation skills.
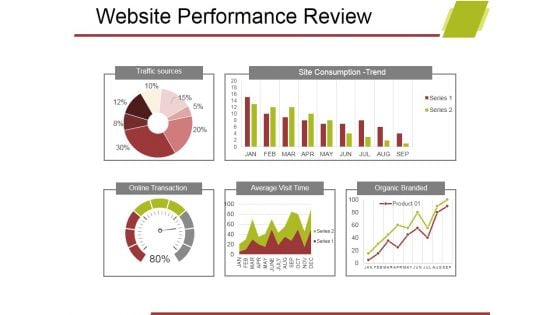
Website Performance Review Template 1 Ppt PowerPoint Presentation Portfolio Master Slide
This is a website performance review template 1 ppt powerpoint presentation portfolio master slide. This is a five stage process. The stages in this process are traffic sources, site consumption trend, online transaction, average visit time, organic branded.
Magnifying Glass With Tax Report Ppt PowerPoint Presentation Gallery Design Templates PDF
Presenting magnifying glass with tax report ppt powerpoint presentation gallery design templates pdf to dispense important information. This template comprises three stages. It also presents valuable insights into the topics including magnifying glass with tax report. This is a completely customizable PowerPoint theme that can be put to use immediately. So, download it and address the topic impactfully.
Environmental Social And Governance Reporting Evaluation For IT Industry Icon Portrait PDF
Persuade your audience using this Environmental Social And Governance Reporting Evaluation For IT Industry Icon Portrait PDF. This PPT design covers four stages, thus making it a great tool to use. It also caters to a variety of topics including Environmental, Social, Governance Reporting Evaluation, IT Industry Icon. Download this PPT design now to present a convincing pitch that not only emphasizes the topic but also showcases your presentation skills.
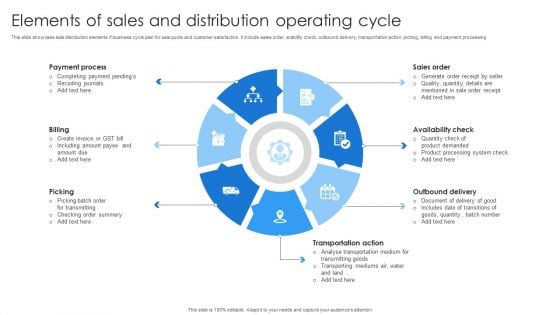
Elements Of Sales And Distribution Operating Cycle Microsoft PDF
This slide showcase sale distribution elements if business cycle plan for sale quote and customer satisfaction. It include sales order, arability check, outbound delivery, transportation action, picking, billing and payment processing.Presenting Elements Of Sales And Distribution Operating Cycle Microsoft PDF to dispense important information. This template comprises seven stages. It also presents valuable insights into the topics including Document Delivery, Includes Date, Goods Quantity. This is a completely customizable PowerPoint theme that can be put to use immediately. So, download it and address the topic impactfully.
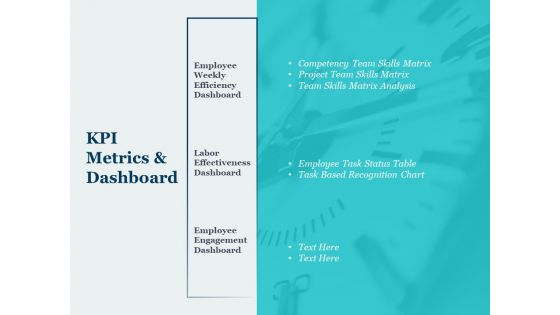
Kpi Metrics And Dashboard Ppt PowerPoint Presentation Inspiration Design Ideas
This is a kpi metrics and dashboard ppt powerpoint presentation inspiration design ideas. This is a three stage process. The stages in this process are business, management, marketing.
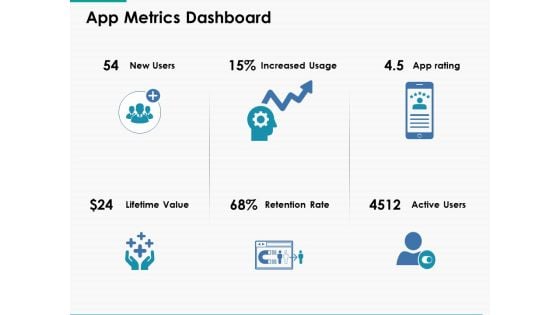
App Metrics Dashboard Ppt Powerpoint Presentation Layouts Portrait
This is a app metrics dashboard ppt powerpoint presentation layouts portrait. This is a six stage process. The stages in this process are business, management, planning, strategy, marketing.

App Metrics Dashboard Ppt PowerPoint Presentation Inspiration Design Inspiration
This is a app metrics dashboard ppt powerpoint presentation inspiration design inspiration. This is a six stage process. The stages in this process are business, management, marketing.
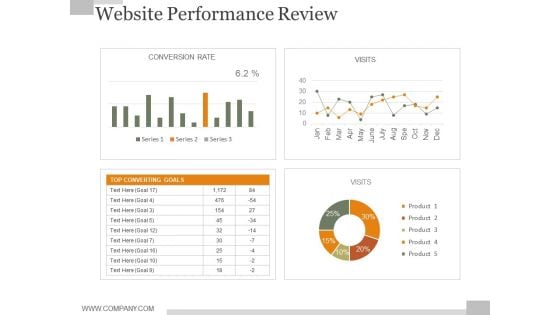
Website Performance Review Slide Ppt PowerPoint Presentation Example 2015
This is a website performance review slide ppt powerpoint presentation example 2015. This is a four stage process. The stages in this process are traffic source, online transaction, conversion rate, average visit time.
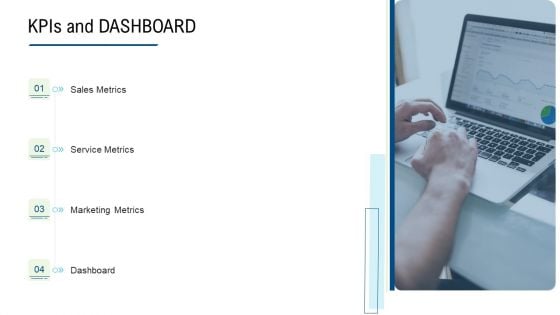
Product Commercialization Action Plan Kpis And DASHBOARD Clipart PDF
Presenting product commercialization action plan KPIs and DASHBOARD clipart pdf to provide visual cues and insights. Share and navigate important information on four stages that need your due attention. This template can be used to pitch topics like sales metrics, service metrics, marketing metrics, dashboard. In addtion, this PPT design contains high resolution images, graphics, etc, that are easily editable and available for immediate download.
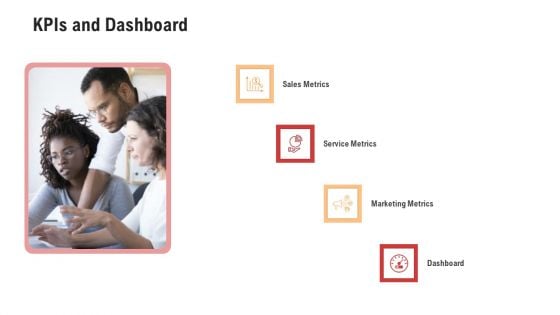
Competitor Assessment In Product Development Kpis And Dashboard Download PDF
This is a competitor assessment in product development kpis and dashboard download pdf. template with various stages. Focus and dispense information on four stages using this creative set, that comes with editable features. It contains large content boxes to add your information on topics like sales metrics, service metrics, marketing metrics, dashboard. You can also showcase facts, figures, and other relevant content using this PPT layout. Grab it now.
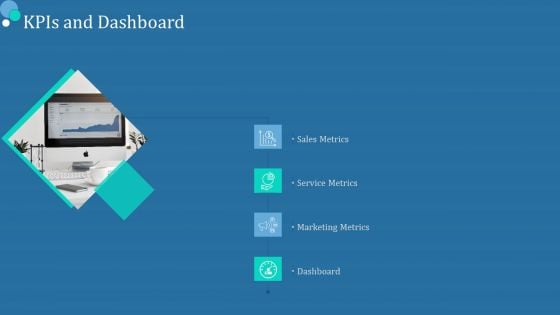
Commodity Category Analysis Kpis And Dashboard Ppt Styles Ideas PDF
Presenting commodity category analysis kpis and dashboard ppt styles ideas pdf to provide visual cues and insights. Share and navigate important information on four stages that need your due attention. This template can be used to pitch topics like sales metrics, service metrics, marketing metrics, dashboard. In addtion, this PPT design contains high resolution images, graphics, etc, that are easily editable and available for immediate download.
Commodity Channel Segmentation Kpis And Dashboard Ppt Styles Information PDF
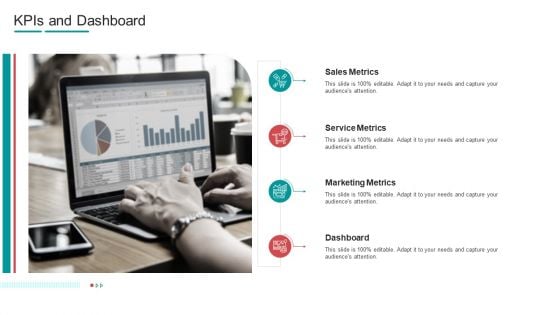
Presenting commodity channel segmentation kpis and dashboard ppt styles information pdf to provide visual cues and insights. Share and navigate important information on four stages that need your due attention. This template can be used to pitch topics like sales metrics, service metrics, marketing metrics, dashboard. In addtion, this PPT design contains high resolution images, graphics, etc, that are easily editable and available for immediate download.
Facilitating IT Intelligence Architecture Determine Overview Of Established Security Centre Introduction PDF
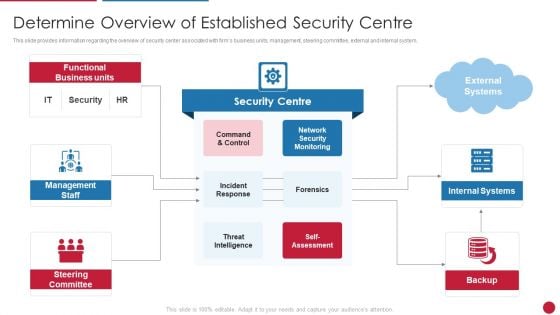
This slide provides information regarding the overview of security center associated with firms business units, management, steering committee, external and internal system. This is a Facilitating IT Intelligence Architecture Determine Overview Of Established Security Centre Introduction PDF template with various stages. Focus and dispense information on three stages using this creative set, that comes with editable features. It contains large content boxes to add your information on topics like Network Security Monitoring, Internal Systems, Steering Committee You can also showcase facts, figures, and other relevant content using this PPT layout. Grab it now.
Analytics Solutions Sample Of Ppt Presentation
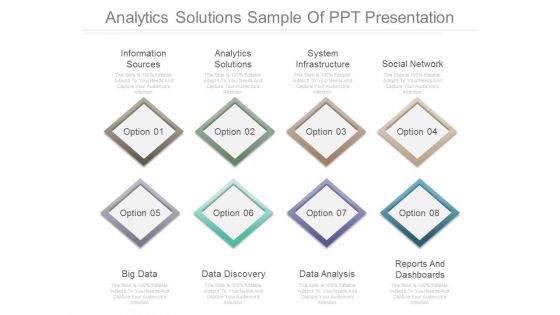
This is a analytics solutions sample of ppt presentation. This is a eight stage process. The stages in this process are information sources, analytics solutions, system infrastructure, social network, big data, data discovery, data analysis, reports and dashboards.
Coca Cola Emotional Marketing Strategy Magnifying Glass Ppt Infographics Graphics Example PDF
Welcome to our selection of the Coca Cola Emotional Marketing Strategy Magnifying Glass Ppt Infographics Graphics Example PDF. These are designed to help you showcase your creativity and bring your sphere to life. Planning and Innovation are essential for any business that is just starting out. This collection contains the designs that you need for your everyday presentations. All of our PowerPoints are 100 percent editable, so you can customize them to suit your needs. This multi-purpose template can be used in various situations. Grab these presentation templates today
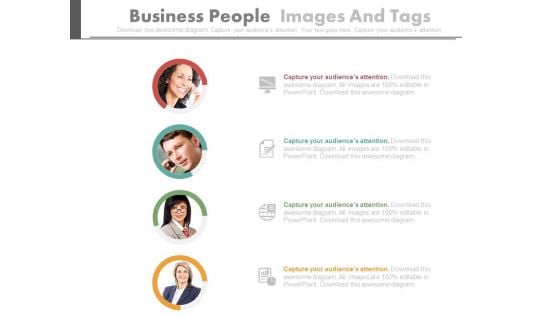
Circles With Team Photos Powerpoint Slides
This dashboard template contains graphics of circles with team photos. This dashboard PowerPoint template conveys employees performance in a visual manner. Download this PPT slide for quick decision-making.

Employee Photo With Percentage Bars Powerpoint Slides
This dashboard template contains employee photo with percentage bars. This dashboard PowerPoint template conveys employees performance in a visual manner. Download this PPT slide for quick decision-making.
Project Management Dashboard Vector Icon Ppt PowerPoint Presentation Slides Files PDF
Presenting this set of slides with name project management dashboard vector icon ppt powerpoint presentation slides files pdf. This is a one stage process. The stage in this process is project management dashboard vector icon. This is a completely editable PowerPoint presentation and is available for immediate download. Download now and impress your audience.
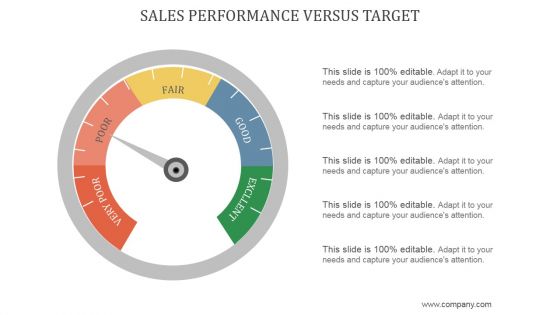
Sales Performance Versus Target Ppt PowerPoint Presentation Example
This is a sales performance versus target ppt powerpoint presentation example. This is a five stage process. The stages in this process are excllen, very poor, poor, fair, good.
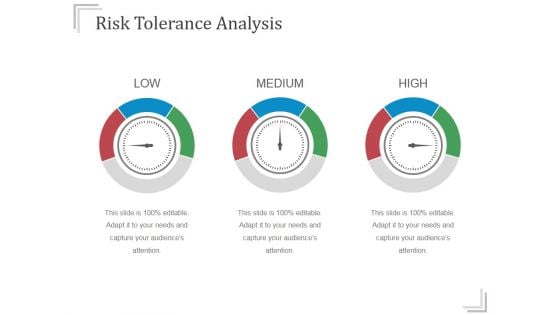
Risk Tolerance Analysis Templates 1 Ppt PowerPoint Presentation Designs
This is a risk tolerance analysis templates 1 ppt powerpoint presentation designs. This is a three stage process. The stages in this process are low, medium, high.
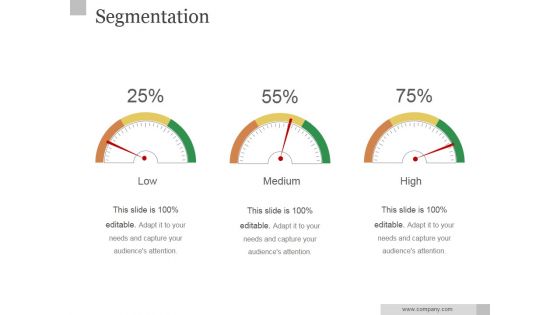
Segmentation Ppt PowerPoint Presentation Infographic Template
This is a segmentation ppt powerpoint presentation infographic template. This is a three stage process. The stages in this process are low, medium, high.
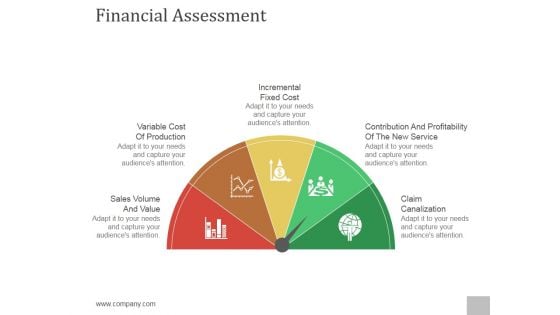
Financial Assessment Ppt PowerPoint Presentation Styles
This is a financial assessment ppt powerpoint presentation styles. This is a five stage process. The stages in this process are sales volume and value, variable cost of production, incremental fixed cost, contribution and profitability of the new service, claim canalization.
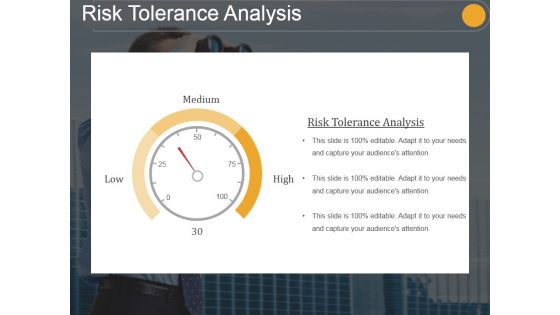
Risk Tolerance Analysis Template 1 Ppt PowerPoint Presentation Design Ideas
This is a risk tolerance analysis template 1 ppt powerpoint presentation design ideas. This is a one stage process. The stages in this process are risk tolerance analysis, low, medium, high.
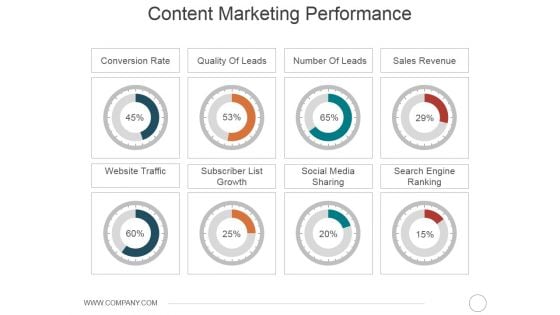
Content Marketing Performance Template 1 Ppt PowerPoint Presentation Styles Infographics
This is a content marketing performance template 1 ppt powerpoint presentation styles infographics. This is a eight stage process. The stages in this process are conversion rate, quality of leads, number of leads, sales revenue, website traffic, subscriber list growth, social media sharing, search engine ranking.
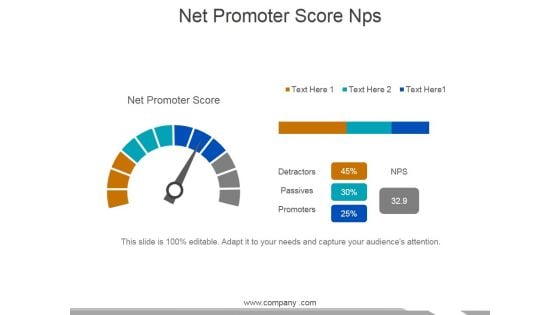
Net Promoter Score Nps Template 2 Ppt PowerPoint Presentation Portfolio Ideas
This is a net promoter score nps template 2 ppt powerpoint presentation portfolio ideas. This is a four stage process. The stages in this process are detractors, promoters, passives, net promoter score.
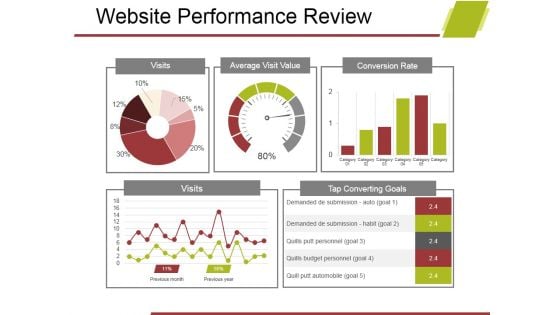
Website Performance Review Template 2 Ppt PowerPoint Presentation Model File Formats
This is a website performance review template 2 ppt powerpoint presentation model file formats. This is a five stage process. The stages in this process are visits, average visit value, conversion rate, visits, tap converting goals.
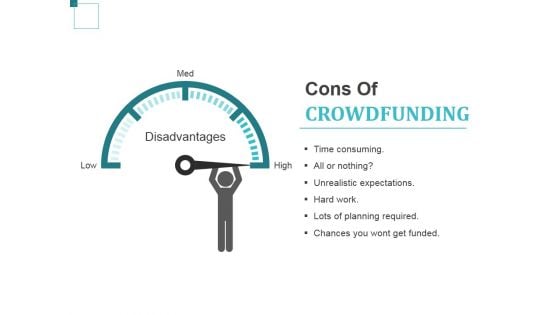
Cons Of Crowdfunding Ppt PowerPoint Presentation Gallery Layout Ideas
This is a cons of crowdfunding ppt powerpoint presentation gallery layout ideas. This is a five stage process. The stages in this process are disadvantages, time consuming, unrealistic expectations, hard work, chances you wont get funded, lots of planning required.
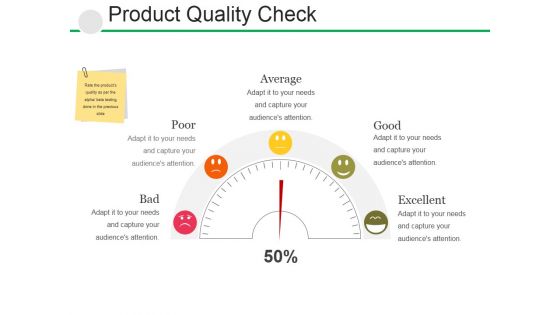
Product Quality Check Ppt PowerPoint Presentation Ideas Outline
This is a product quality check ppt powerpoint presentation ideas outline. This is a five stage process. The stages in this process are bad, poor, average, good, excellent.


 Continue with Email

 Home
Home


