Business Trends
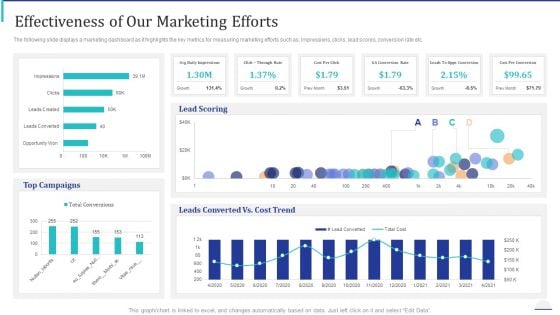
How Make Impactful Product Marketing Message Build Product Differentiation Effectiveness Of Our Marketing Efforts Themes PDF
The following slide displays a marketing dashboard as it highlights the key metrics for measuring marketing efforts such as Impressions, clicks, lead scores, conversion rate etc. Deliver an awe inspiring pitch with this creative how make impactful product marketing message build product differentiation effectiveness of our marketing efforts themes pdf bundle. Topics like top campaigns, lead scoring, leads converted vs cost trend can be discussed with this completely editable template. It is available for immediate download depending on the needs and requirements of the user.
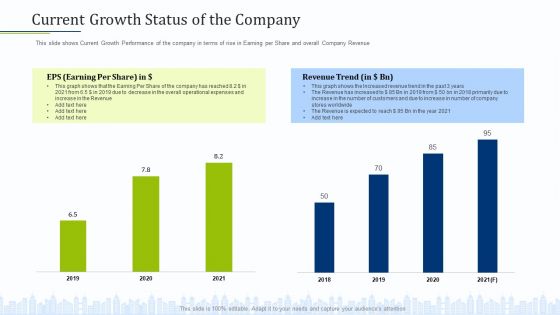
Pitch Deck To Draw External Capital From Commercial Banking Institution Current Growth Status Of The Company Template PDF
This slide shows Current Growth Performance of the company in terms of rise in Earning per Share and overall Company Revenue Deliver and pitch your topic in the best possible manner with this pitch deck to draw external capital from commercial banking institution current growth status of the company template pdf. Use them to share invaluable insights on overall operational expenses and increase, increase in number of company stores worldwide, revenue trend and impress your audience. This template can be altered and modified as per your expectations. So, grab it now.
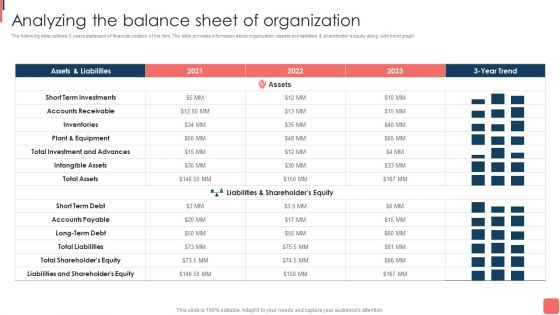
Effective Financial Planning Assessment Techniques Analyzing The Balance Sheet Of Organization Slides PDF
The following slide outlines 3 years statement of financial position of the firm. The slide provides information about organization assets and liabilities shareholders equity along with trend graph. From laying roadmaps to briefing everything in detail, our templates are perfect for you. You can set the stage with your presentation slides. All you have to do is download these easy-to-edit and customizable templates. Effective Financial Planning Assessment Techniques Analyzing The Balance Sheet Of Organization Slides PDF will help you deliver an outstanding performance that everyone would remember and praise you for. Do download this presentation today.
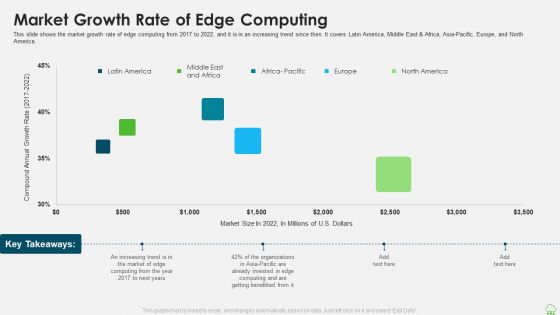
Distributed Computing IT Market Growth Rate Of Edge Computing Information PDF
This slide shows the market growth rate of edge computing from 2017 to 2022, and it is in an increasing trend since then. It covers Latin America, Middle East and Africa, Asia-Pacific, Europe, and North America. Deliver and pitch your topic in the best possible manner with this distributed computing it market growth rate of edge computing information pdf. Use them to share invaluable insights on organizations, market, growth rate and impress your audience. This template can be altered and modified as per your expectations. So, grab it now.
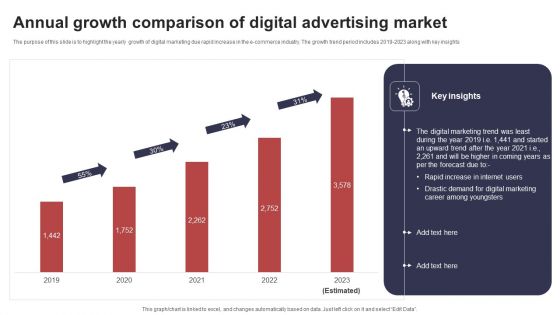
Annual Growth Comparison Of Digital Advertising Market Summary PDF
The purpose of this slide is to highlight the yearly growth of digital marketing due rapid increase in the e commerce industry. The growth trend period includes 2019 2023 along with key insights. Pitch your topic with ease and precision using this Annual Growth Comparison Of Digital Advertising Market Summary PDF. This layout presents information on Digital Marketing, Internet Users, Career Among Youngsters. It is also available for immediate download and adjustment. So, changes can be made in the color, design, graphics or any other component to create a unique layout.
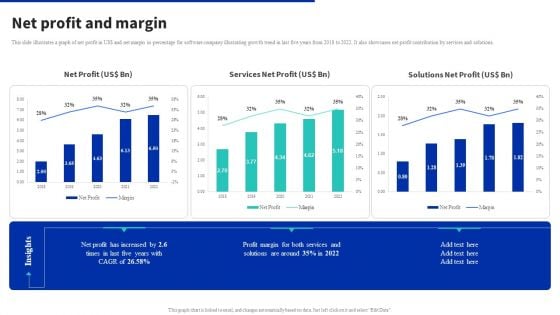
Digital Products Company Outline Net Profit And Margin Summary PDF
This slide illustrates a graph of net profit in US dollar and net margin in percentage for software company illustrating growth trend in last five years from 2018 to 2022. It also showcases net profit contribution by services and solutions. From laying roadmaps to briefing everything in detail, our templates are perfect for you. You can set the stage with your presentation slides. All you have to do is download these easy to edit and customizable templates. Digital Products Company Outline Net Profit And Margin Summary PDF will help you deliver an outstanding performance that everyone would remember and praise you for. Do download this presentation today.
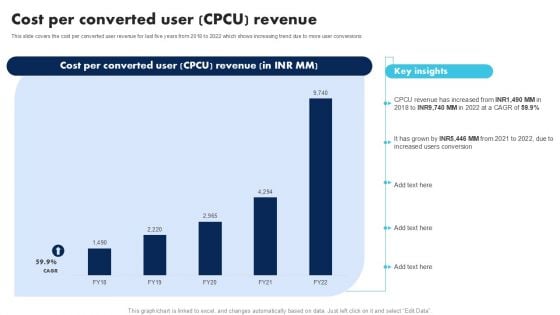
Information Technology Solutions Company Outline Cost Per Converted User CPCU Revenue Topics PDF
Market Insights Research Results With KPI Dashboard Ppt PowerPoint Presentation Icon File Formats PDF
The given below slide highlights the KPAs of market research associated with customer satisfaction. It includes net promoter score, customer effort score, monthly NPS and CES trend etc.Pitch your topic with ease and precision using this Market Insights Research Results With KPI Dashboard Ppt PowerPoint Presentation Icon File Formats PDF. This layout presents information on Satisfaction Score, Customer Effort, Customer Score. It is also available for immediate download and adjustment. So, changes can be made in the color, design, graphics or any other component to create a unique layout.
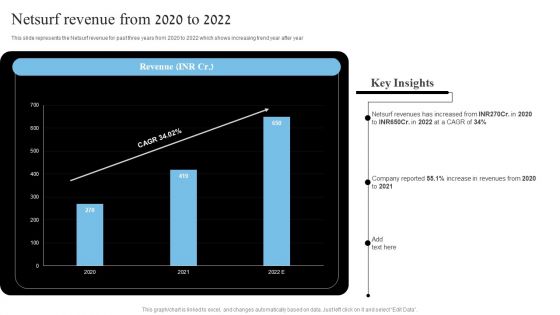
Network Marketing Company Profile Netsurf Revenue From 2020 To 2022 Elements PDF
This slide represents the Netsurf revenue for past three years from 2020 to 2022 which shows increasing trend year after year Get a simple yet stunning designed Network Marketing Company Profile Netsurf Revenue From 2020 To 2022 Elements PDF. It is the best one to establish the tone in your meetings. It is an excellent way to make your presentations highly effective. So, download this PPT today from Slidegeeks and see the positive impacts. Our easy to edit Network Marketing Company Profile Netsurf Revenue From 2020 To 2022 Elements PDF can be your go to option for all upcoming conferences and meetings. So, what are you waiting for Grab this template today.
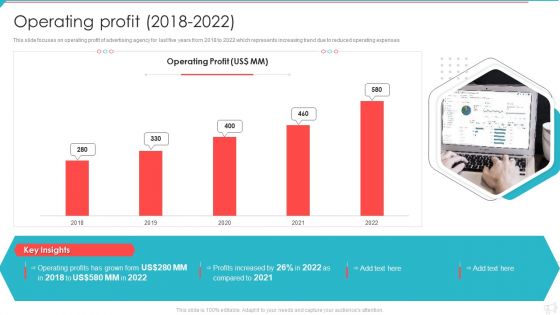
Advertisement And Marketing Agency Company Profile Operating Profit 2018 To 2022 Infographics PDF
This slide focuses on operating profit of advertising agency for last five years from 2018 to 2022 which represents increasing trend due to reduced operating expenses. Deliver and pitch your topic in the best possible manner with this Advertisement And Marketing Agency Company Profile Operating Profit 2018 To 2022 Infographics PDF. Use them to share invaluable insights on Operating Profit, Profits Increased, 2018 To 2022 and impress your audience. This template can be altered and modified as per your expectations. So, grab it now.

Makeup And Beauty Care Products Company Profile Annual Revenue 2018 To 2022 Sample PDF
This slide highlights the annual revenue of our company in last five years with CAGR from 2018 to 2022 which shows increasing trend due to improved product sales.Deliver and pitch your topic in the best possible manner with this Makeup And Beauty Care Products Company Profile Annual Revenue 2018 To 2022 Sample PDF Use them to share invaluable insights on Revenue Increased, Company Reported, Annual Revenue and impress your audience. This template can be altered and modified as per your expectations. So, grab it now.
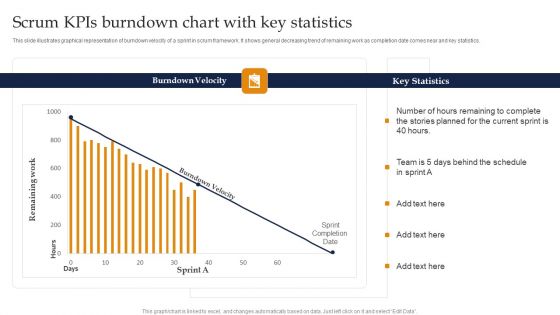
Scrum Kpis Burndown Chart With Key Statistics Ppt Pictures Visual Aids PDF
This slide illustrates graphical representation of burndown velocity of a sprint in scrum framework. It shows general decreasing trend of remaining work as completion date comes near and key statistics. Pitch your topic with ease and precision using this Scrum Kpis Burndown Chart With Key Statistics Ppt Pictures Visual Aids PDF. This layout presents information on Burndown Velocity, Key Statistics, Current Sprint. It is also available for immediate download and adjustment. So, changes can be made in the color, design, graphics or any other component to create a unique layout.
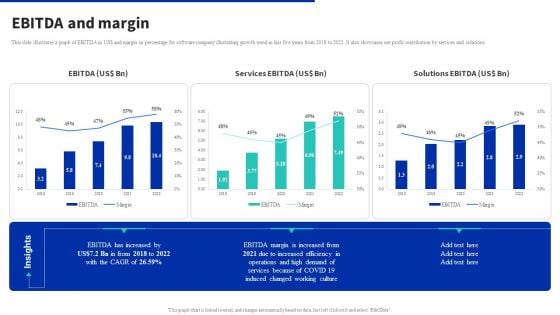
Digital Products Company Outline Ebitda And Margin Inspiration PDF
This slide illustrates a graph of EBITDA in US dollar and margin in percentage for software company illustrating growth trend in last five years from 2018 to 2022. It also showcases net profit contribution by services and solutions. Take your projects to the next level with our ultimate collection of Digital Products Company Outline Ebitda And Margin Inspiration PDF. Slidegeeks has designed a range of layouts that are perfect for representing task or activity duration, keeping track of all your deadlines at a glance. Tailor these designs to your exact needs and give them a truly corporate look with your own brand colors they will make your projects stand out from the rest.
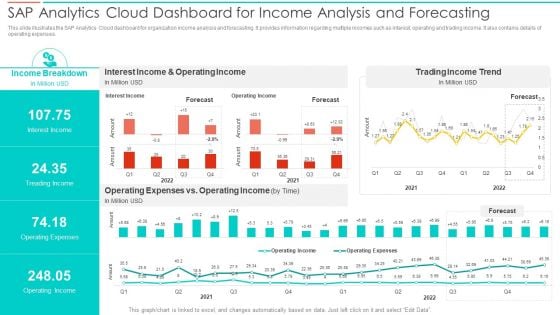
SAC Planning And Implementation SAP Analytics Cloud Dashboard For Income Analysis Summary PDF
This slide illustrates the SAP Analytics Cloud dashboard for organization income analysis and forecasting. It provides information regarding multiple incomes such as interest, operating and trading income. It also contains details of operating expenses. Deliver an awe inspiring pitch with this creative SAC Planning And Implementation SAP Analytics Cloud Dashboard For Income Analysis Summary PDF bundle. Topics like Income Breakdown, Interest Income, Operating Income, Trading Income Trend can be discussed with this completely editable template. It is available for immediate download depending on the needs and requirements of the user.
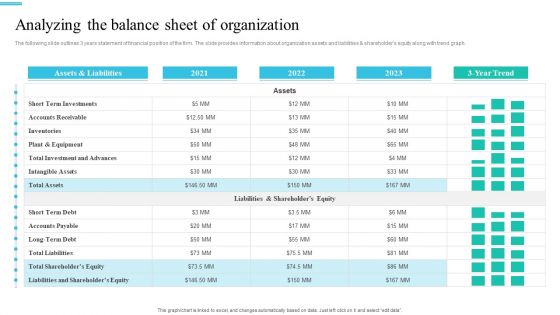
Monetary Planning And Evaluation Guide Analyzing The Balance Sheet Of Organization Ppt Model Graphics Pictures PDF
The following slide outlines 3 years statement of financial position of the firm. The slide provides information about organization assets and liabilities and shareholders equity along with trend graph. Want to ace your presentation in front of a live audience. Our Monetary Planning And Evaluation Guide Analyzing The Balance Sheet Of Organization Ppt Model Graphics Pictures PDF can help you do that by engaging all the users towards you. Slidegeeks experts have put their efforts and expertise into creating these impeccable powerpoint presentations so that you can communicate your ideas clearly. Moreover, all the templates are customizable, and easy-to-edit and downloadable. Use these for both personal and commercial use.
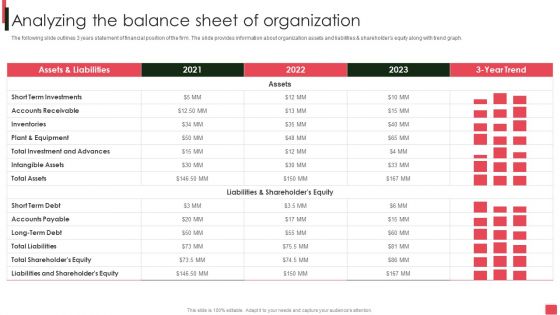
Overview Of Organizational Analyzing The Balance Sheet Of Organization Professional PDF
The following slide outlines 3 years statement of financial position of the firm. The slide provides information about organization assets and liabilities and shareholders equity along with trend graph. Boost your pitch with our creative Overview Of Organizational Analyzing The Balance Sheet Of Organization Professional PDF. Deliver an awe-inspiring pitch that will mesmerize everyone. Using these presentation templates you will surely catch everyones attention. You can browse the ppts collection on our website. We have researchers who are experts at creating the right content for the templates. So you dont have to invest time in any additional work. Just grab the template now and use them.
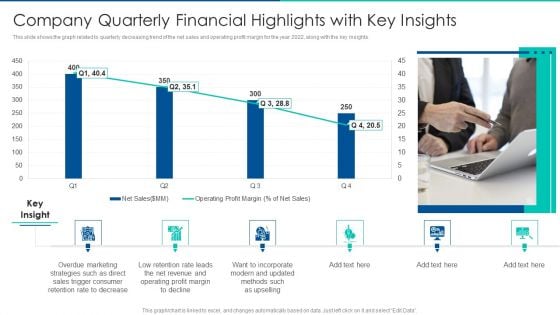
Sales Promotion Of Upgraded Product Through Upselling Company Quarterly Financial Highlights With Key Insights Ideas PDF
This slide shows the graph related to quarterly decreasing trend of the net sales and operating profit margin for the year 2022, along with the key insights. Deliver an awe inspiring pitch with this creative sales promotion of upgraded product through upselling company quarterly financial highlights with key insights ideas pdf bundle. Topics like company quarterly financial highlights with key insights can be discussed with this completely editable template. It is available for immediate download depending on the needs and requirements of the user.
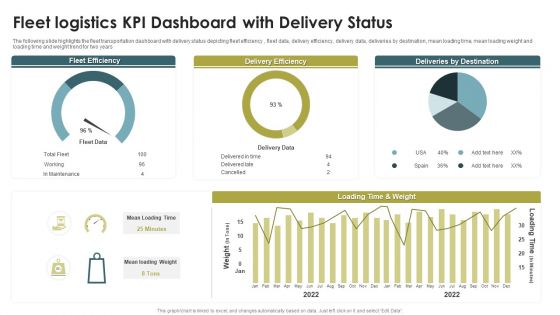
Fleet Logistics KPI Dashboard With Delivery Status Ppt Model Guide PDF
The following slide highlights the fleet transportation dashboard with delivery status depicting fleet efficiency , fleet data, delivery efficiency, delivery data, deliveries by destination, mean loading time, mean loading weight and loading time and weight trend for two years. Pitch your topic with ease and precision using this Fleet Logistics KPI Dashboard With Delivery Status Ppt Model Guide PDF. This layout presents information on Fleet Efficiency, Delivery Efficiency, Deliveries By Destination. It is also available for immediate download and adjustment. So, changes can be made in the color, design, graphics or any other component to create a unique layout.

Personal Care Company Profile Annual Revenue 2018 To 2022 Graphics PDF
This slide highlights the annual revenue of our company in last five years with CAGR from 2018 to 2022 which shows increasing trend due to improved product sales. Deliver and pitch your topic in the best possible manner with this Personal Care Company Profile Annual Revenue 2018 To 2022 Graphics PDF. Use them to share invaluable insights on Annual Revenue, Key Insights, Annual Revenue, 2018 To 2022 and impress your audience. This template can be altered and modified as per your expectations. So, grab it now.
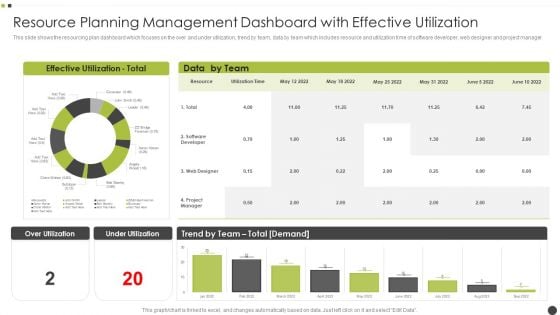
Resource Planning Management Dashboard With Effective Utilization Mockup PDF
This slide shows the resourcing plan dashboard which focuses on the over and under utilization, trend by team, data by team which includes resource and utilization time of software developer, web designer and project manager. Pitch your topic with ease and precision using this Resource Planning Management Dashboard With Effective Utilization Mockup PDF. This layout presents information on Web Designer, Software Developer, Team. It is also available for immediate download and adjustment. So, changes can be made in the color, design, graphics or any other component to create a unique layout.
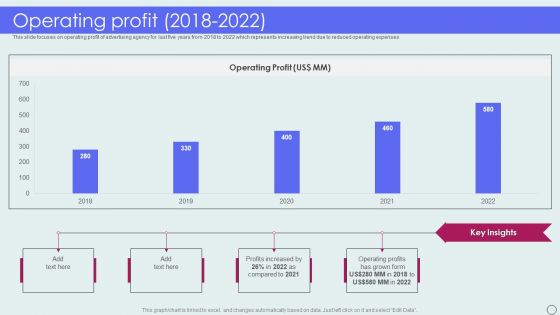
Advertising Solutions Company Details Operating Profit 2018 To 2022 Ppt PowerPoint Presentation Gallery Themes PDF
This slide focuses on operating profit of advertising agency for last five years from 2018 to 2022 which represents increasing trend due to reduced operating expenses. Deliver and pitch your topic in the best possible manner with this Advertising Solutions Company Details Operating Profit 2018 To 2022 Ppt PowerPoint Presentation Gallery Themes PDF. Use them to share invaluable insights on Operating Profit, 2018 To 2022, Profits Increased and impress your audience. This template can be altered and modified as per your expectations. So, grab it now.
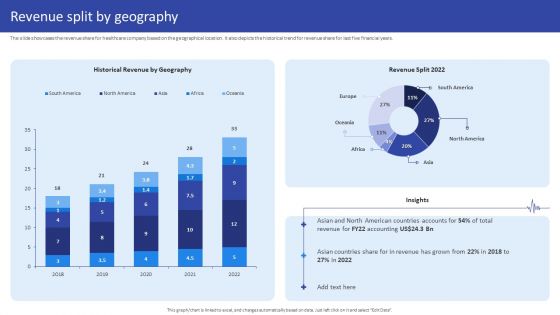
Hospital Medical Research Company Profile Revenue Split By Geography Portrait PDF
The slide showcases the revenue share for healthcare company based on the geographical location. It also depicts the historical trend for revenue share for last five financial years. Deliver and pitch your topic in the best possible manner with this Hospital Medical Research Company Profile Revenue Split By Geography Portrait PDF. Use them to share invaluable insights on Historical Revenue Geography, Revenue Split 2022, 2018 To 2022 and impress your audience. This template can be altered and modified as per your expectations. So, grab it now.
Infotech Solutions Research And Development Company Summary Company Patent Grants Icons PDF
This slide highlights the total patents granted to company in 2022 in multiple categories of IT, which includes AL and ML. cloud services, network design, cyber security and others. It also depicts historical patent trend with key insights. Deliver an awe inspiring pitch with this creative Infotech Solutions Research And Development Company Summary Company Patent Grants Icons PDF bundle. Topics like Network Design, Cyber Security, Cloud Services can be discussed with this completely editable template. It is available for immediate download depending on the needs and requirements of the user.
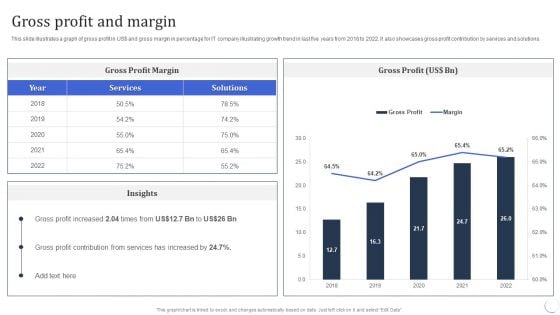
Infotech Solutions Research And Development Company Summary Gross Profit And Margin Ideas PDF
This slide illustrates a graph of gross profit in US dollar and gross margin in percentage for IT company illustrating growth trend in last five years from 2018 to 2022. It also showcases gross profit contribution by services and solutions. Deliver an awe inspiring pitch with this creative Infotech Solutions Research And Development Company Summary Gross Profit And Margin Ideas PDF bundle. Topics like Services, Gross Profit Margin can be discussed with this completely editable template. It is available for immediate download depending on the needs and requirements of the user.
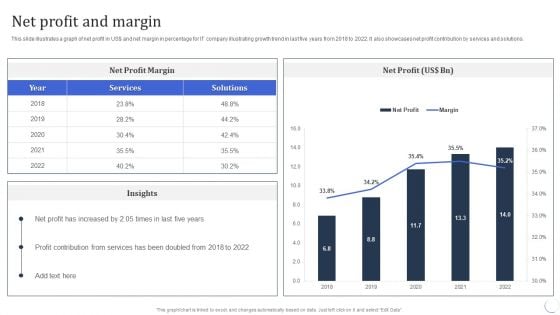
Infotech Solutions Research And Development Company Summary Net Profit And Margin Information PDF
This slide illustrates a graph of net profit in US dollar and net margin in percentage for IT company illustrating growth trend in last five years from 2018 to 2022. It also showcases net profit contribution by services and solutions. Deliver and pitch your topic in the best possible manner with this Infotech Solutions Research And Development Company Summary Net Profit And Margin Information PDF. Use them to share invaluable insights on Profit Contribution, Services, Net Profit and impress your audience. This template can be altered and modified as per your expectations. So, grab it now.
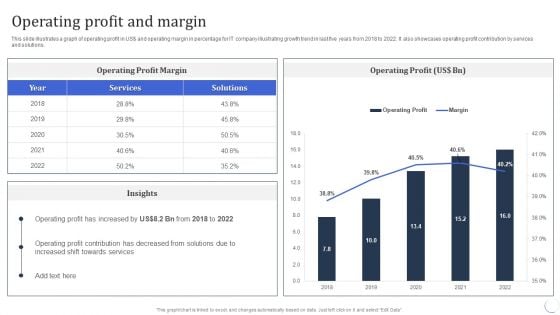
Infotech Solutions Research And Development Company Summary Operating Profit And Margin Download PDF
This slide illustrates a graph of operating profit in US dollar and operating margin in percentage for IT company illustrating growth trend in last five years from 2018 to 2022. It also showcases operating profit contribution by services and solutions. Deliver an awe inspiring pitch with this creative Infotech Solutions Research And Development Company Summary Operating Profit And Margin Download PDF bundle. Topics like Services, Operating Profit can be discussed with this completely editable template. It is available for immediate download depending on the needs and requirements of the user.
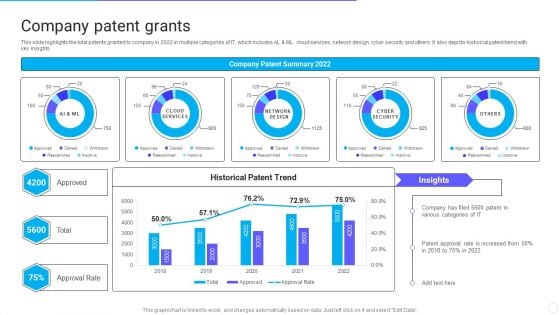
IT Application Services Company Outline Company Patent Grants Introduction PDF
This slide highlights the total patents granted to company in 2022 in multiple categories of IT, which includes AL and ML. cloud services, network design, cyber security and others. It also depicts historical patent trend with key insights. Deliver an awe inspiring pitch with this creative IT Application Services Company Outline Company Patent Grants Introduction PDF bundle. Topics like Approval Rate, Company Patent Grants can be discussed with this completely editable template. It is available for immediate download depending on the needs and requirements of the user.
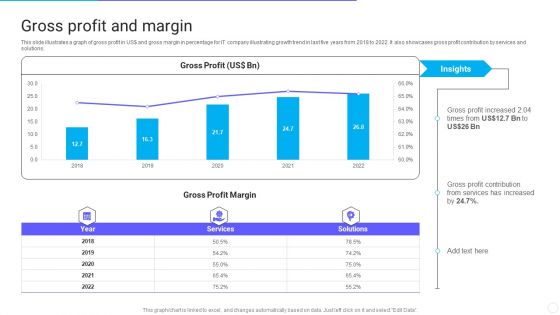
IT Application Services Company Outline Gross Profit And Margin Elements PDF
This slide illustrates a graph of gross profit in US dollar and gross margin in percentage for IT company illustrating growth trend in last five years from 2018 to 2022. It also showcases gross profit contribution by services and solutions. Deliver an awe inspiring pitch with this creative IT Application Services Company Outline Gross Profit And Margin Elements PDF bundle. Topics like Gross Profit Margin, Services can be discussed with this completely editable template. It is available for immediate download depending on the needs and requirements of the user.
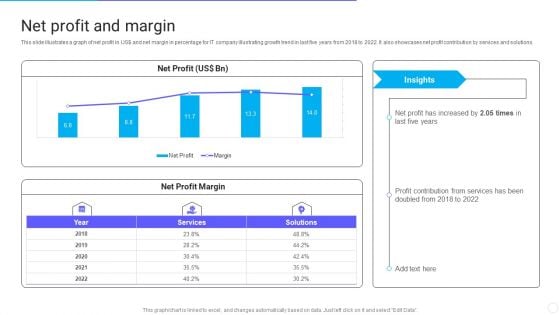
IT Application Services Company Outline Net Profit And Margin Structure PDF
This slide illustrates a graph of net profit in US dollar and net margin in percentage for IT company illustrating growth trend in last five years from 2018 to 2022. It also showcases net profit contribution by services and solutions. Deliver and pitch your topic in the best possible manner with this IT Application Services Company Outline Net Profit And Margin Structure PDF. Use them to share invaluable insights on Net Profit Margin, Services, Margin and impress your audience. This template can be altered and modified as per your expectations. So, grab it now.
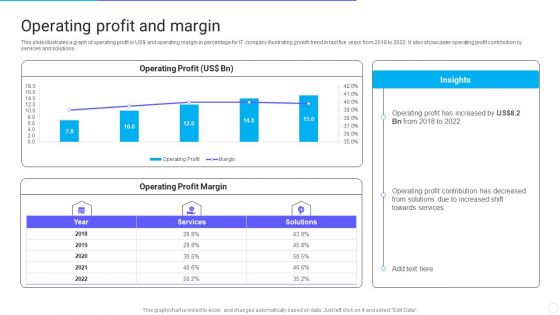
IT Application Services Company Outline Operating Profit And Margin Structure PDF
This slide illustrates a graph of operating profit in US dollar and operating margin in percentage for IT company illustrating growth trend in last five years from 2018 to 2022. It also showcases operating profit contribution by services and solutions. Deliver an awe inspiring pitch with this creative IT Application Services Company Outline Operating Profit And Margin Structure PDF bundle. Topics like Operating Profit And Margin can be discussed with this completely editable template. It is available for immediate download depending on the needs and requirements of the user.
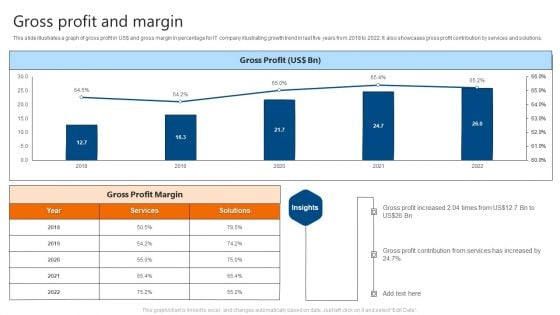
Gross Profit And Margin IT Software Development Company Profile Slides PDF
This slide illustrates a graph of gross profit in US doller and gross margin in percentage for IT company illustrating growth trend in last five years from 2018 to 2022. It also showcases gross profit contribution by services and solutions. Deliver and pitch your topic in the best possible manner with this Gross Profit And Margin IT Software Development Company Profile Slides PDF. Use them to share invaluable insights on Gross Profit, Margin and impress your audience. This template can be altered and modified as per your expectations. So, grab it now.
Net Profit And Margin IT Software Development Company Profile Icons PDF
This slide illustrates a graph of net profit in US doller and net margin in percentage for IT company illustrating growth trend in last five years from 2018 to 2022. It also showcases net profit contribution by services and solutions. Deliver an awe inspiring pitch with this creative Net Profit And Margin IT Software Development Company Profile Icons PDF bundle. Topics like Net Profit, Net Profit Margin can be discussed with this completely editable template. It is available for immediate download depending on the needs and requirements of the user.
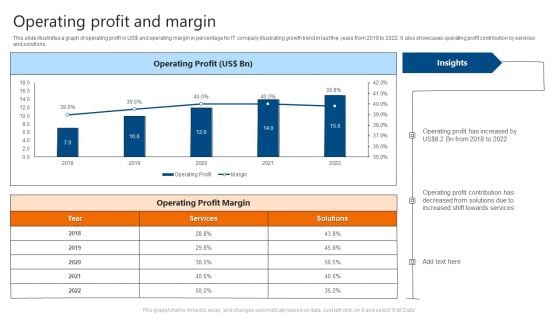
Operating Profit And Margin IT Software Development Company Profile Guidelines PDF
This slide illustrates a graph of operating profit in US doller and operating margin in percentage for IT company illustrating growth trend in last five years from 2018 to 2022. It also showcases operating profit contribution by services and solutions. Deliver and pitch your topic in the best possible manner with this Operating Profit And Margin IT Software Development Company Profile Guidelines PDF. Use them to share invaluable insights on Operating Profit, Operating Profit Margin and impress your audience. This template can be altered and modified as per your expectations. So, grab it now.
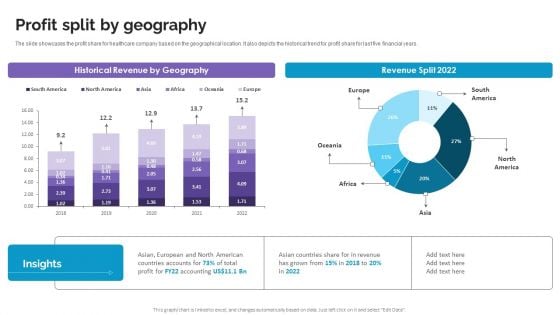
Profit Split By Geography Life Science And Healthcare Solutions Company Profile Graphics PDF
The slide showcases the profit share for healthcare company based on the geographical location. It also depicts the historical trend for profit share for last five financial years. If your project calls for a presentation, then Slidegeeks is your go-to partner because we have professionally designed, easy-to-edit templates that are perfect for any presentation. After downloading, you can easily edit Profit Split By Geography Life Science And Healthcare Solutions Company Profile Graphics PDF and make the changes accordingly. You can rearrange slides or fill them with different images. Check out all the handy templates
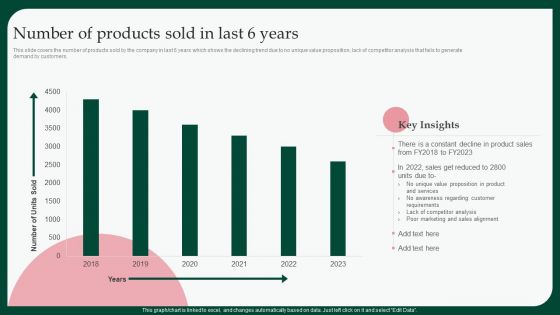
Boosting Product Sales Through Branding Number Of Products Sold In Last Summary PDF
This slide covers the number of products sold by the company in last 6 years which shows the declining trend due to no unique value proposition, lack of competitor analysis that fails to generate demand by customers. If your project calls for a presentation, then Slidegeeks is your go-to partner because we have professionally designed, easy-to-edit templates that are perfect for any presentation. After downloading, you can easily edit Boosting Product Sales Through Branding Number Of Products Sold In Last Summary PDF and make the changes accordingly. You can rearrange slides or fill them with different images. Check out all the handy templates.
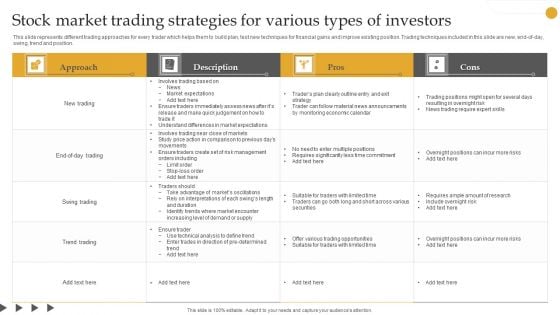
Stock Market Trading Strategies For Various Types Of Investors Demonstration PDF
This slide represents different trading approaches for every trader which helps them to build plan, test new techniques for financial gains and improve existing position. Trading techniques included in this slide are new, end-of-day, swing, trend and position. Pitch your topic with ease and precision using this Stock Market Trading Strategies For Various Types Of Investors Demonstration PDF. This layout presents information on Market Expectations, Risk Management, Price. It is also available for immediate download and adjustment. So, changes can be made in the color, design, graphics or any other component to create a unique layout.
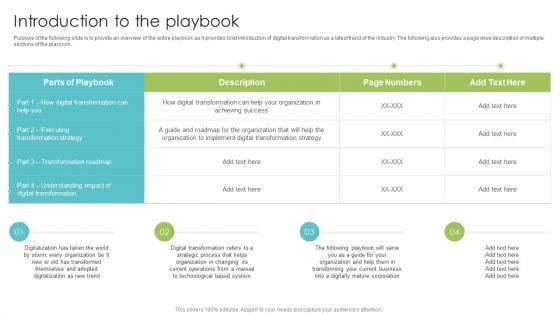
Playbook For Enterprise Transformation Administration Introduction To The Playbook Graphics PDF
Purpose of the following slide is to provide an overview of the entire playbook as it provides brief introduction of digital transformation as a latest trend of the industry. The following also provides a page wise description of multiple sections of the playbook. Deliver an awe inspiring pitch with this creative Playbook For Enterprise Transformation Administration Introduction To The Playbook Graphics PDF bundle. Topics like Organization, Technological, Strategic Process can be discussed with this completely editable template. It is available for immediate download depending on the needs and requirements of the user.
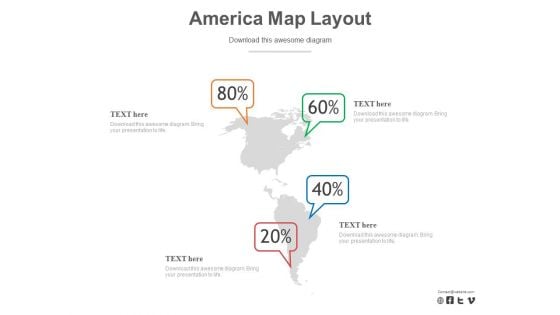
Map Of America With Percentage Data PowerPoint Slides
Nothing can explain locations better than a map itself. Then why not use it to make your PowerPoint presentation more visual, interesting and the one which leaves a good impression. If you have business around North and South America or your company or organization has clients or industries located in these 2 continents, then we have the perfect slide for you. You can effectively use this slide to show the distribution of clients or any other factor in percentage basis. The creatively designed map can also be used to show a comparison of your user?s location. This can also be an ideal slide to explain the travel and tourism trend prevailing in the continents. This slide is customizable and the icons can be placed anywhere on the map as per the need of the presentation.

Salon Marketing Plan To Optimize Examining Impact Of Clients Frequency Of Visit Strategy SS V
This slide analyzes the relationship between frequency of client visits and business revenue. It includes two tables showcasing current projections and what if analysis covering metrics such as average weekly service sales, average number of visits per year, number of new clients per month, etc. The Salon Marketing Plan To Optimize Examining Impact Of Clients Frequency Of Visit Strategy SS V is a compilation of the most recent design trends as a series of slides. It is suitable for any subject or industry presentation, containing attractive visuals and photo spots for businesses to clearly express their messages. This template contains a variety of slides for the user to input data, such as structures to contrast two elements, bullet points, and slides for written information. Slidegeeks is prepared to create an impression. This slide analyzes the relationship between frequency of client visits and business revenue. It includes two tables showcasing current projections and what if analysis covering metrics such as average weekly service sales, average number of visits per year, number of new clients per month, etc.
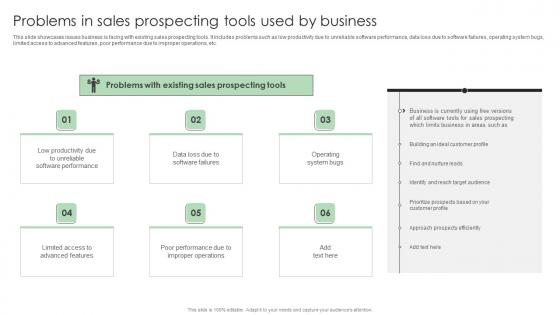
Performance Enhancement Plan Problems In Sales Prospecting Tools Used Ideas Pdf
This slide showcases issues business is facing with existing sales prospecting tools. It includes problems such as low productivity due to unreliable software performance, data loss due to software failures, operating system bugs, limited access to advanced features, poor performance due to improper operations, etc. The Performance Enhancement Plan Problems In Sales Prospecting Tools Used Ideas Pdf is a compilation of the most recent design trends as a series of slides. It is suitable for any subject or industry presentation, containing attractive visuals and photo spots for businesses to clearly express their messages. This template contains a variety of slides for the user to input data, such as structures to contrast two elements, bullet points, and slides for written information. Slidegeeks is prepared to create an impression. This slide showcases issues business is facing with existing sales prospecting tools. It includes problems such as low productivity due to unreliable software performance, data loss due to software failures, operating system bugs, limited access to advanced features, poor performance due to improper operations, etc.
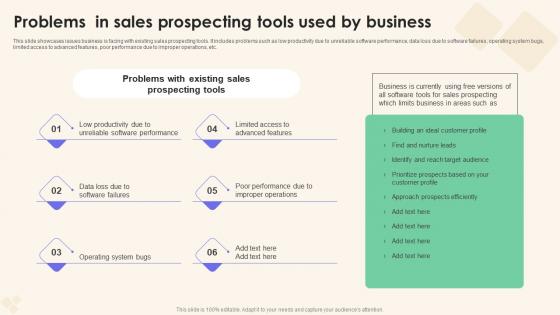
Problems In Sales Prospecting Tools Sales Performance Enhancement Elements Pdf
This slide showcases issues business is facing with existing sales prospecting tools. It includes problems such as low productivity due to unreliable software performance, data loss due to software failures, operating system bugs, limited access to advanced features, poor performance due to improper operations, etc. The Problems In Sales Prospecting Tools Sales Performance Enhancement Elements Pdf is a compilation of the most recent design trends as a series of slides. It is suitable for any subject or industry presentation, containing attractive visuals and photo spots for businesses to clearly express their messages. This template contains a variety of slides for the user to input data, such as structures to contrast two elements, bullet points, and slides for written information. Slidegeeks is prepared to create an impression. This slide showcases issues business is facing with existing sales prospecting tools. It includes problems such as low productivity due to unreliable software performance, data loss due to software failures, operating system bugs, limited access to advanced features, poor performance due to improper operations, etc.
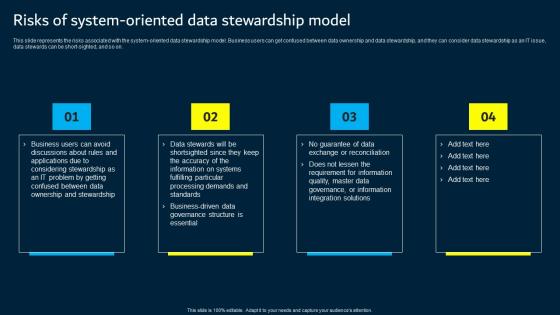
Risks Of System Oriented Data Stewardship Model Data Custodianship Information Pdf
This slide represents the risks associated with the system oriented data stewardship model. Business users can get confused between data ownership and data stewardship, and they can consider data stewardship as an IT issue, data stewards can be short sighted, and so on. The Risks Of System Oriented Data Stewardship Model Data Custodianship Information Pdf is a compilation of the most recent design trends as a series of slides. It is suitable for any subject or industry presentation, containing attractive visuals and photo spots for businesses to clearly express their messages. This template contains a variety of slides for the user to input data, such as structures to contrast two elements, bullet points, and slides for written information. Slidegeeks is prepared to create an impression. This slide represents the risks associated with the system oriented data stewardship model. Business users can get confused between data ownership and data stewardship, and they can consider data stewardship as an IT issue, data stewards can be short sighted, and so on.
Strategies To Develop Effective Cyber Security Plan Ppt Powerpoint Presentation File Icon Pdf
This slide represents the techniques to be adopted by administration to effectively manage cyber security incidents in order to reduce their impact on business operations. It includes strategies to develop cyber security plan such as establish IR team, conduct threat analysis etc. The Strategies To Develop Effective Cyber Security Plan Ppt Powerpoint Presentation File Icon Pdf is a compilation of the most recent design trends as a series of slides. It is suitable for any subject or industry presentation, containing attractive visuals and photo spots for businesses to clearly express their messages. This template contains a variety of slides for the user to input data, such as structures to contrast two elements, bullet points, and slides for written information. Slidegeeks is prepared to create an impression. This slide represents the techniques to be adopted by administration to effectively manage cyber security incidents in order to reduce their impact on business operations. It includes strategies to develop cyber security plan such as establish IR team, conduct threat analysis etc.
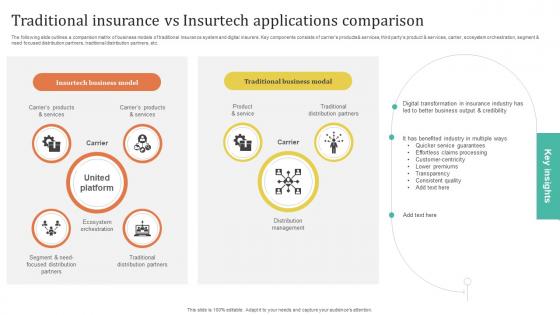
Improving Customer Satisfaction Traditional Insurance Vs Insurtech Applications Comparison
The following slide outlines a comparison matrix of business models of traditional insurance system and digital insurers. Key components consists of carriers products and services, third partys product and services, carrier, ecosystem orchestration, segment and need focused distribution partners, traditional distribution partners, etc. The Improving Customer Satisfaction Traditional Insurance Vs Insurtech Applications Comparison is a compilation of the most recent design trends as a series of slides. It is suitable for any subject or industry presentation, containing attractive visuals and photo spots for businesses to clearly express their messages. This template contains a variety of slides for the user to input data, such as structures to contrast two elements, bullet points, and slides for written information. Slidegeeks is prepared to create an impression. The following slide outlines a comparison matrix of business models of traditional insurance system and digital insurers. Key components consists of carriers products and services, third partys product and services, carrier, ecosystem orchestration, segment and need focused distribution partners, traditional distribution partners, etc.
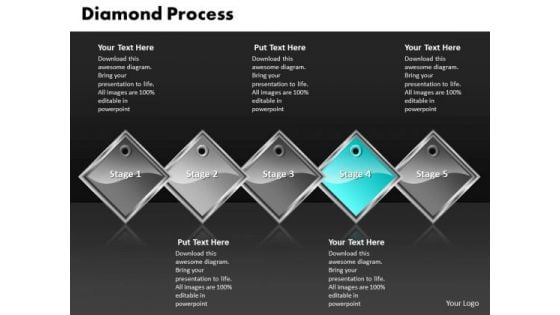
Ppt Cyan Diamond Successive Procedure 5 Power Point Stage PowerPoint Templates
PPT cyan diamond successive procedure 5 power point stage PowerPoint Templates-Develop competitive advantage with our above template which contains a diamond diagram illustrating five stages in a process. It helps to lay the base of your trend of thought.-PPT cyan diamond successive procedure 5 power point stage PowerPoint Templates-Advertise, Advertisement, Badge, Box, Business, Card, Collection, Column, Corporate, Costing, Counting, Design, Discount, Element, Featured, Finance, Grid, Hosting, Information, List, Message, Placard, Plan, Price, Pricing, Rectangle, Report, Round Arrest doubts with our Ppt Cyan Diamond Successive Procedure 5 Power Point Stage PowerPoint Templates. You will come out on top.
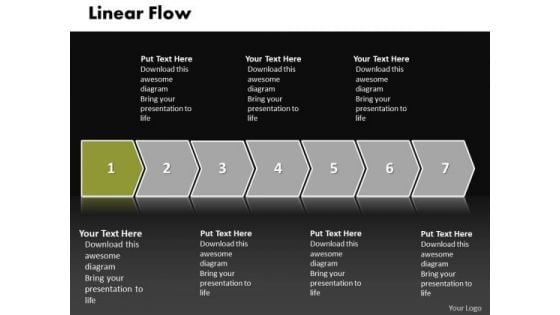
Ppt Linear Flow Illustration Practice The PowerPoint Macro Steps Of An Action Templates
PPT linear flow illustration practice the powerpoint macro steps of an action Templates-This image represents the concept of structured analysis technique that employs a set of visual representations of the data that moves through the organization. This helps you to lay the base of your trend of thought-PPT linear flow illustration practice the powerpoint macro steps of an action Templates-3d, Arrow, Background, Banner, Business, Chart, Colorful, Diagram, Direction, Element, Financial, Flow, Gradient, Illustration, Isolated, Mirrored, Placeholder, Presentation, Process, Steps Our Ppt Linear Flow Illustration Practice The PowerPoint Macro Steps Of An Action Templates cater for different factions. They assist in finding common ground.
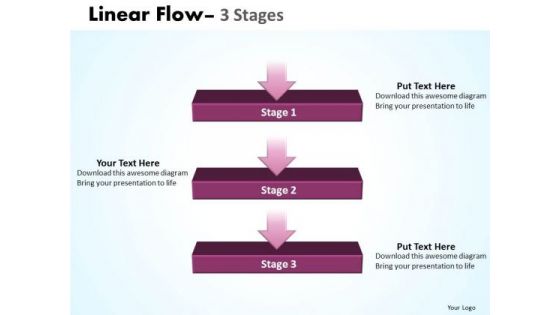
Usa Ppt Theme Linear Flow 3 State Diagram Time Management PowerPoint 1 Design
USA PPT Theme linear flow 3 state diagram time management powerpoint 1 design-Use this diagram to show sequential steps in a task. It helps to lay the base of your trend of thought and enhance the essence of your viable ideas. -USA PPT Theme linear flow 3 state diagram time management powerpoint 1 design-Arrow, Background, Business, Chart, Diagram, Financial, Flow, Graphic, Gray, Icon, Illustration, Linear, Management, Orange, Perspective, Process, Reflection, Shapes, Stage, Text Erroneous beliefs can be a bane. Be correct and accurate with our Usa Ppt Theme Linear Flow 3 State Diagram Time Management PowerPoint 1 Design.
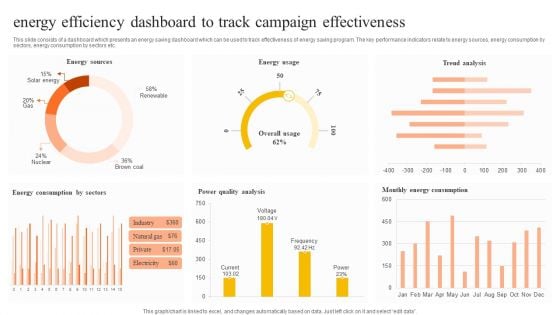
Energy Efficiency Dashboard To Track Campaign Effectiveness Pictures PDF
This slide consists of a dashboard which presents an energy saving dashboard which can be used to track effectiveness of energy saving program. The key performance indicators relate to energy sources, energy consumption by sectors, energy consumption by sectors etc. Pitch your topic with ease and precision using this Energy Efficiency Dashboard To Track Campaign Effectiveness Pictures PDF. This layout presents information on Energy Sources, Energy Usage, Trend Analysis. It is also available for immediate download and adjustment. So, changes can be made in the color, design, graphics or any other component to create a unique layout.
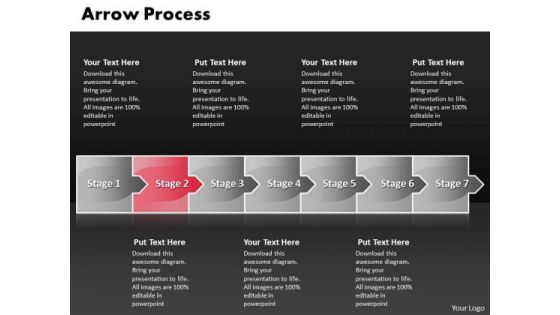
Editable Ppt Theme Arrow Process 7 Stages Operations Management PowerPoint 3 Graphic
editable PPT Theme arrow process 7 stages operations management powerpoint 3 Graphic-This arrow process diagram is a type of graphics that shows how items are related to one another. Use this graphic to represent a continuing sequence of stages, tasks, or events. It helps to lay the base of your trend of thought.-editable PPT Theme arrow process 7 stages operations management powerpoint 3 Graphic-Advertising, Arrow, Concept, Corporate, Creative, Design, Direction, Flow, Illustration, Info, Graphic, Instruction, Label, Layout, Manual, Modern, Number, Offer, Order, Pointer, Product, Progress, Promotion, Sequence, Special, Step, Symbol Feel free to air your views. Get that allowance with our Editable Ppt Theme Arrow Process 7 Stages Operations Management PowerPoint 3 Graphic.
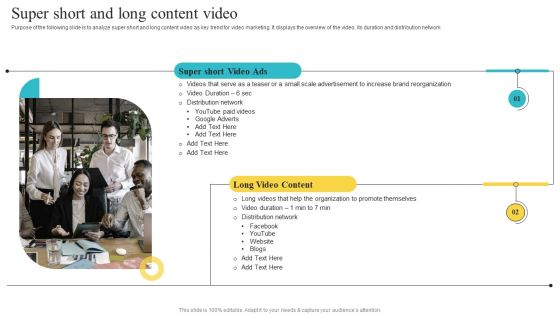
Super Short And Long Content Video Playbook For Social Media Platform Video Marketing Template PDF
Purpose of the following slide is to analyze super short and long content video as key trend for video marketing. It displays the overview of the video, its duration and distribution network. Presenting Super Short And Long Content Video Playbook For Social Media Platform Video Marketing Template PDF to provide visual cues and insights. Share and navigate important information on one stage that need your due attention. This template can be used to pitch topics like Advertisement Increase, Brand Reorganization, Distribution Network. In addtion, this PPT design contains high resolution images, graphics, etc, that are easily editable and available for immediate download.
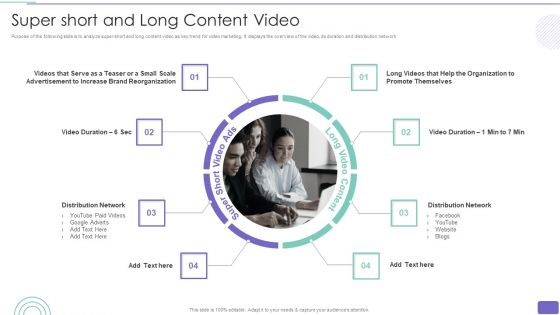
Youtube Advertising Strategy Playbook Super Short And Long Content Video Guidelines PDF
Purpose of the following slide is to analyze super short and long content video as key trend for video marketing. It displays the overview of the video, its duration and distribution network. Presenting Youtube Advertising Strategy Playbook Super Short And Long Content Video Guidelines PDF to provide visual cues and insights. Share and navigate important information on eight stages that need your due attention. This template can be used to pitch topics like Distribution Network, Organization, Distribution Network. In addtion, this PPT design contains high resolution images, graphics, etc, that are easily editable and available for immediate download.
Departments Of Visualization Research Information Visualization Research Branch Clipart PDF
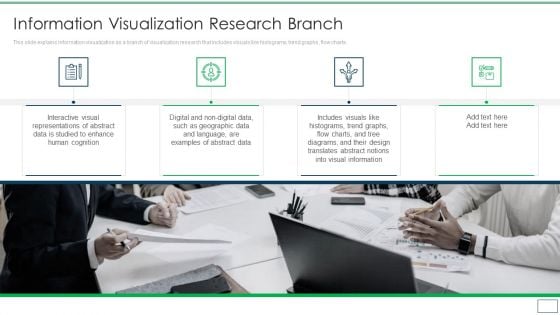
This slide explains information visualization as a branch of visualization research that includes visuals like histograms, trend graphs, flow charts.Presenting Departments Of Visualization Research Information Visualization Research Branch Clipart PDF to provide visual cues and insights. Share and navigate important information on four stages that need your due attention. This template can be used to pitch topics like Interactive Visual, Representations Of Abstract, Information In addtion, this PPT design contains high resolution images, graphics, etc, that are easily editable and available for immediate download.

Most Common Google Keyword Assessment Challenges With Solutions Introduction PDF
Following slide illustrates various challenges faced by research analyst in keyword analysis with respective solutions to increase business competitive advantage. It includes challenges such as key usage in content, keyword quality, trend impact on keywords and keyword relevance for SEO and social media Persuade your audience using this Most Common Google Keyword Assessment Challenges With Solutions Introduction PDF. This PPT design covers two stages, thus making it a great tool to use. It also caters to a variety of topics including Determine Keyword Quality, Requirement, Keyword Optimization. Download this PPT design now to present a convincing pitch that not only emphasizes the topic but also showcases your presentation skills.
Editable PowerPoint Template Parellel Representation Of 8 Issues Graphic
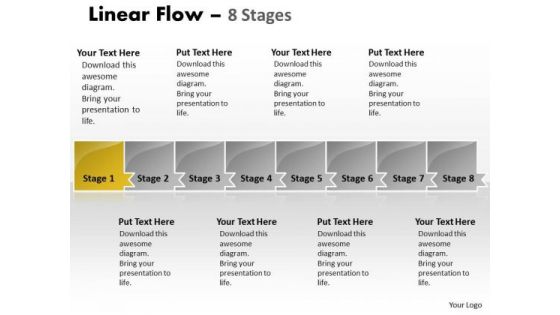
We present our editable PowerPoint template parellel representation of 8 issues Graphic.Use our Arrows PowerPoint Templates because, they help to lay the base of your trend of thought. Use our Symbol PowerPoint Templates because, Our Template designs are State of the Art. Use our Business PowerPoint Templates because, Business 3D Circular Puzzle: - Your business and plans for its growth consist of processes that are highly co-related. Use our Process and flows PowerPoint Templates because, Now you have to coordinate and motivate your team. Use our Marketing PowerPoint Templates because, However it requires care and diligence to function well. Use these PowerPoint slides for presentations relating to Arrow, background, business, chart, diagram, financial, flow, graphic, gray, icon, management, orange, perspective, process, reflection, spheres, shapes, symbol, and marketing. The prominent colors used in the PowerPoint template are Yellow, Gray, and White Apply your brains in the correct direction. Our Editable PowerPoint Template Parellel Representation Of 8 Issues Graphic will align them accurately.
Flow PowerPoint Template Parellel Demonstration Of 7 Concepts Graphics
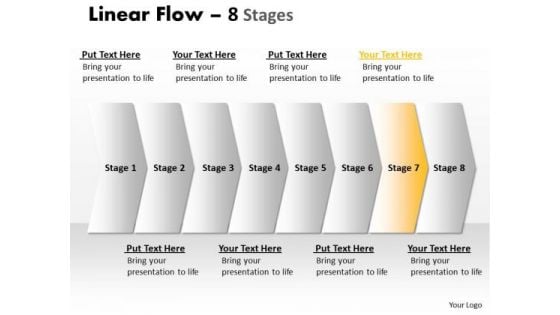
We present our flow PowerPoint template parallel demonstration of 7 concepts graphics. Use our Symbol PowerPoint Templates because, Team Efforts Business Template: - The concept and strategy is your strength. Use our Metaphor PowerPoint Templates because, they help to lay the base of your trend of thought. Use our Process and Flows PowerPoint Templates because, Now you have to coordinate and motivate your team. Use our Business PowerPoint Templates because, Marketing Strategy Business Template: - Maximizing sales of your product is the intended destination. Use our Arrows PowerPoint Templates because, Heighten the anticipation of your audience with this slide listing .Use these PowerPoint slides for presentations relating to Arrow, Background, Business, Chart, Diagram, Financial, Flow, Graphic, Gray, Icon, Illustration, Linear, Management, Orange, Perspective, Process, Reflection, Spheres, Stage, Text. The prominent colors used in the PowerPoint template are Yellow, Gray, and White Upgrade your presentation with our Flow PowerPoint Template Parellel Demonstration Of 7 Concepts Graphics. Download without worries with our money back guaranteee.
Ebitda And Margin Financial Performance Report Of Software Firm Pictures PDF
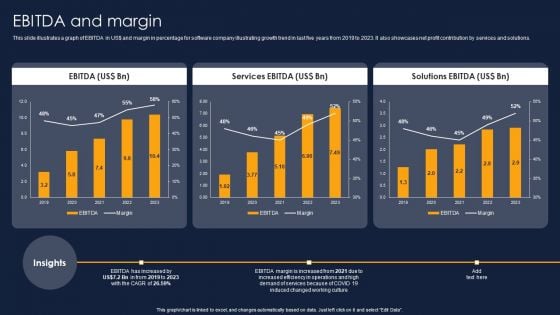
This slide illustrates a graph of EBITDA in US doller and margin in percentage for software company illustrating growth trend in last five years from 2019 to 2023. It also showcases net profit contribution by services and solutions. Get a simple yet stunning designed Ebitda And Margin Financial Performance Report Of Software Firm Pictures PDF. It is the best one to establish the tone in your meetings. It is an excellent way to make your presentations highly effective. So, download this PPT today from Slidegeeks and see the positive impacts. Our easy-to-edit Ebitda And Margin Financial Performance Report Of Software Firm Pictures PDF can be your go-to option for all upcoming conferences and meetings. So, what are you waiting for Grab this template today.

Net Profit And Margin Financial Performance Report Of Software Firm Demonstration PDF
This slide illustrates a graph of net profit in US doller and net margin in percentage for software company illustrating growth trend in last five years from 2019 to 2023. It also showcases net profit contribution by services and solutions. Present like a pro with Net Profit And Margin Financial Performance Report Of Software Firm Demonstration PDF Create beautiful presentations together with your team, using our easy-to-use presentation slides. Share your ideas in real-time and make changes on the fly by downloading our templates. So whether you are in the office, on the go, or in a remote location, you can stay in sync with your team and present your ideas with confidence. With Slidegeeks presentation got a whole lot easier. Grab these presentations today.
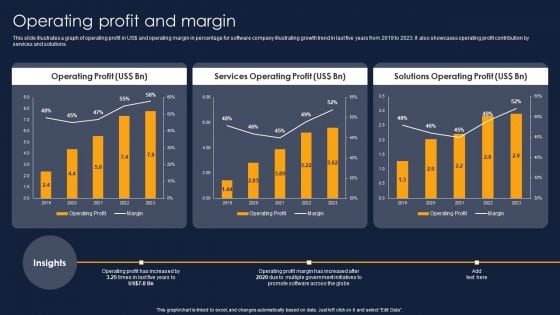
Operating Profit And Margin Financial Performance Report Of Software Firm Themes PDF
This slide illustrates a graph of operating profit in US doller and operating margin in percentage for software company illustrating growth trend in last five years from 2019 to 2023. It also showcases operating profit contribution by services and solutions. Slidegeeks is here to make your presentations a breeze with Operating Profit And Margin Financial Performance Report Of Software Firm Themes PDF With our easy-to-use and customizable templates, you can focus on delivering your ideas rather than worrying about formatting. With a variety of designs to choose from, you are sure to find one that suits your needs. And with animations and unique photos, illustrations, and fonts, you can make your presentation pop. So whether you are giving a sales pitch or presenting to the board, make sure to check out Slidegeeks first.

Global Cosmetics Market Future Outlook Ppt Show Graphics Template PDF
This slide consists of a graph that depicts the Global Cosmetics Market Size trend from the years 2017 to 2025 along with the key facts of the industry. Presenting global cosmetics market future outlook ppt show graphics template pdf to provide visual cues and insights. Share and navigate important information on one stage that need your due attention. This template can be used to pitch topics like market growth, product manufacturers, market size. In addition, this PPT design contains high-resolution images, graphics, etc, that are easily editable and available for immediate download.
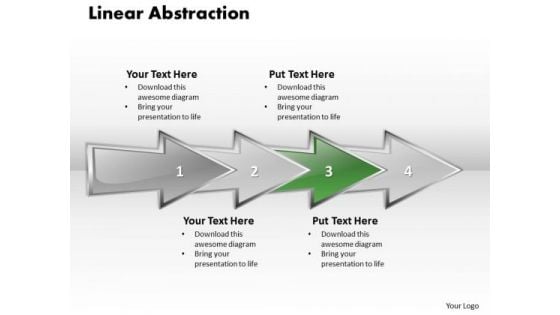
Ppt Linear Abstraction Arrow Animated Graph PowerPoint 2007 Templates
PPT linear abstraction arrow animated graph powerpoint 2007 Templates-Use this diagram to show a progression or sequential steps in a task, process, or workflow. They help to lay the base of your trend of thought and enhance the essence of your viable ideas. Create captivating presentations to deliver comparative and weighted arguments.-PPT linear abstraction arrow animated graph powerpoint 2007 Templates-analysis, arrow, background, business, chart, communication, concept, construction, delivery, design, development, engineering, fabrication, feasibiliti, generated, growth, idea, industry, making, production, products, science, sequence, shape Realign your team with our Ppt Linear Abstraction Arrow Animated Graph PowerPoint 2007 Templates. Download without worries with our money back guaranteee.


 Continue with Email

 Home
Home


