Checklist Icon
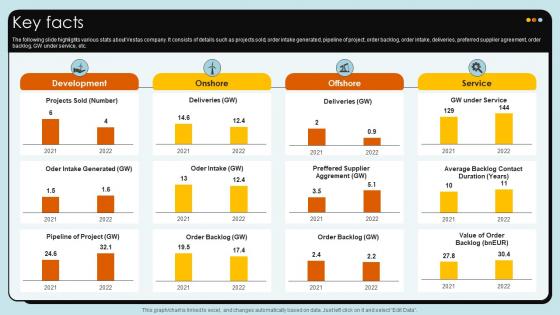
Key Facts Wind Turbines Manufacturer Company Profile CP SS V
The following slide highlights various stats about Vestas company. It consists of details such as projects sold, order intake generated, pipeline of project, order backlog, order intake, deliveries, preferred supplier agreement, order backlog, GW under service, etc.Make sure to capture your audiences attention in your business displays with our gratis customizable Key Facts Wind Turbines Manufacturer Company Profile CP SS V. These are great for business strategies, office conferences, capital raising or task suggestions. If you desire to acquire more customers for your tech business and ensure they stay satisfied, create your own sales presentation with these plain slides. The following slide highlights various stats about Vestas company. It consists of details such as projects sold, order intake generated, pipeline of project, order backlog, order intake, deliveries, preferred supplier agreement, order backlog, GW under service, etc.
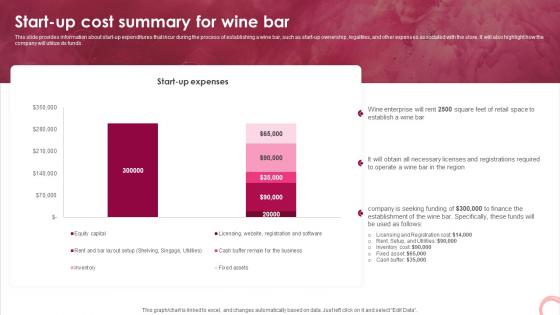
Wine Lounge Business Plan Start Up Cost Summary For Wine Bar BP SS V
This slide provides information about start-up expenditures that incur during the process of establishing a wine bar, such as start-up ownership, legalities, and other expenses associated with the store. It will also highlight how the company will utilize its funds. Take your projects to the next level with our ultimate collection of Wine Lounge Business Plan Start Up Cost Summary For Wine Bar BP SS V. Slidegeeks has designed a range of layouts that are perfect for representing task or activity duration, keeping track of all your deadlines at a glance. Tailor these designs to your exact needs and give them a truly corporate look with your own brand colors they will make your projects stand out from the rest This slide provides information about start-up expenditures that incur during the process of establishing a wine bar, such as start-up ownership, legalities, and other expenses associated with the store. It will also highlight how the company will utilize its funds.

Increasing Business Awareness Introducing Social Media Marketing For Creating Strategy SS V
This slide presents an overview of social media marketing. It also include a graph showcasing the associated benefits of social media for insurers such as marketing, customer service, new sales leads, fraud detection and risk selection. Take your projects to the next level with our ultimate collection of Increasing Business Awareness Introducing Social Media Marketing For Creating Strategy SS V. Slidegeeks has designed a range of layouts that are perfect for representing task or activity duration, keeping track of all your deadlines at a glance. Tailor these designs to your exact needs and give them a truly corporate look with your own brand colors they will make your projects stand out from the rest This slide presents an overview of social media marketing. It also include a graph showcasing the associated benefits of social media for insurers such as marketing, customer service, new sales leads, fraud detection and risk selection
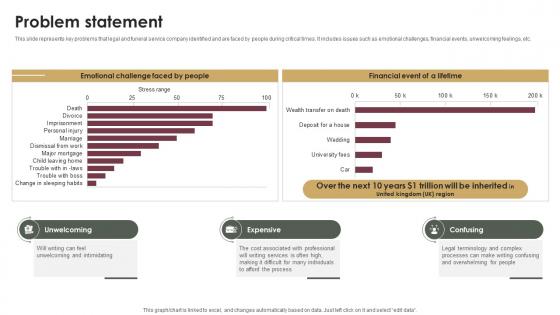
Problem Statement Probate Assistance Solutions Company Investor Funding Elevator Pitch Deck
This slide represents key problems that legal and funeral service company identified and are faced by people during critical times. It includes issues such as emotional challenges, financial events, unwelcoming feelings, etc.Make sure to capture your audiences attention in your business displays with our gratis customizable Problem Statement Probate Assistance Solutions Company Investor Funding Elevator Pitch Deck. These are great for business strategies, office conferences, capital raising or task suggestions. If you desire to acquire more customers for your tech business and ensure they stay satisfied, create your own sales presentation with these plain slides. This slide represents key problems that legal and funeral service company identified and are faced by people during critical times. It includes issues such as emotional challenges, financial events, unwelcoming feelings, etc.
Managing Technical And Non Various Kpis For Tracking Business Performance
Mentioned slide provide insights into various key performance indicators to determine business performance. It includes KPIs such as business financials, website traffic, customer case, customer engagement, conversion rate, customer retention, customer bounce rate, employee turnover, etc. Make sure to capture your audiences attention in your business displays with our gratis customizable Managing Technical And Non Various Kpis For Tracking Business Performance. These are great for business strategies, office conferences, capital raising or task suggestions. If you desire to acquire more customers for your tech business and ensure they stay satisfied, create your own sales presentation with these plain slides. Mentioned slide provide insights into various key performance indicators to determine business performance. It includes KPIs such as business financials, website traffic, customer case, customer engagement, conversion rate, customer retention, customer bounce rate, employee turnover, etc.
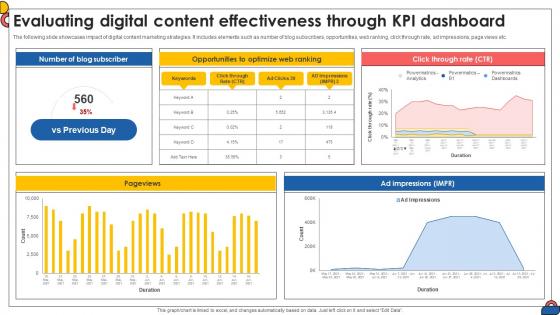
Evaluating Digital Content Effectiveness Through Kpi Comprehensive Guide To Implement Strategy SS V
The following slide showcases impact of digital content marketing strategies. It includes elements such as number of blog subscribers, opportunities, web ranking, click through rate, ad impressions, page views etc. Make sure to capture your audiences attention in your business displays with our gratis customizable Evaluating Digital Content Effectiveness Through Kpi Comprehensive Guide To Implement Strategy SS V. These are great for business strategies, office conferences, capital raising or task suggestions. If you desire to acquire more customers for your tech business and ensure they stay satisfied, create your own sales presentation with these plain slides. The following slide showcases impact of digital content marketing strategies. It includes elements such as number of blog subscribers, opportunities, web ranking, click through rate, ad impressions, page views etc.
Unlocking Potential Enhancing Team Members Performance Tracking Dashboards
This slide depicts performance tracking dashboard for project manager to analyze work being done by the team. It includes average rating for the week, total work done and weekly change, employee rating and work done. Take your projects to the next level with our ultimate collection of Unlocking Potential Enhancing Team Members Performance Tracking Dashboards. Slidegeeks has designed a range of layouts that are perfect for representing task or activity duration, keeping track of all your deadlines at a glance. Tailor these designs to your exact needs and give them a truly corporate look with your own brand colors they will make your projects stand out from the rest This slide depicts performance tracking dashboard for project manager to analyze work being done by the team. It includes average rating for the week, total work done and weekly change, employee rating and work done.
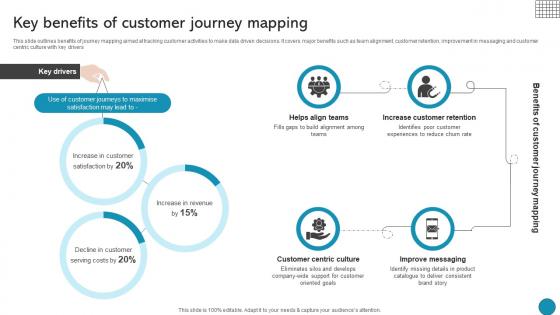
Key Benefits Of Customer Journey Mapping Driving Business Success Integrating Product
This slide outlines benefits of journey mapping aimed at tracking customer activities to make data driven decisions. It covers major benefits such as team alignment, customer retention, improvement in messaging and customer centric culture with key drivers Take your projects to the next level with our ultimate collection of Key Benefits Of Customer Journey Mapping Driving Business Success Integrating Product. Slidegeeks has designed a range of layouts that are perfect for representing task or activity duration, keeping track of all your deadlines at a glance. Tailor these designs to your exact needs and give them a truly corporate look with your own brand colors they will make your projects stand out from the rest This slide outlines benefits of journey mapping aimed at tracking customer activities to make data driven decisions. It covers major benefits such as team alignment, customer retention, improvement in messaging and customer centric culture with key drivers
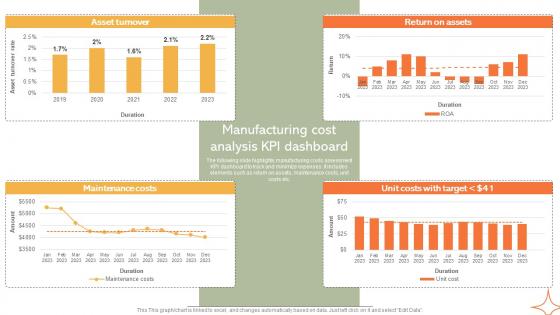
Manufacturing Cost Analysis KPI Dashboard Implementing Manufacturing Strategy SS V
The following slide highlights manufacturing costs assessment KPI dashboard to track and minimize expenses. It includes elements such as return on assets, maintenance costs, unit costs etc. Make sure to capture your audiences attention in your business displays with our gratis customizable Manufacturing Cost Analysis KPI Dashboard Implementing Manufacturing Strategy SS V. These are great for business strategies, office conferences, capital raising or task suggestions. If you desire to acquire more customers for your tech business and ensure they stay satisfied, create your own sales presentation with these plain slides. The following slide highlights manufacturing costs assessment KPI dashboard to track and minimize expenses. It includes elements such as return on assets, maintenance costs, unit costs etc.
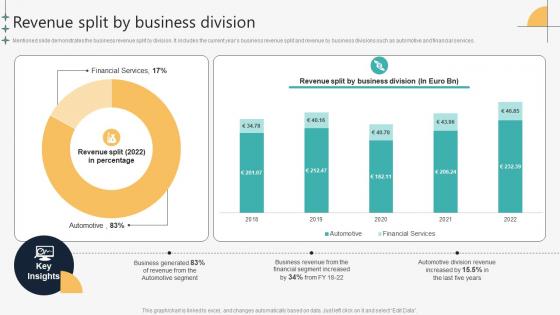
Revenue Split By Business Division Automotive Manufacturing Company Profile CP SS V
Mentioned slide demonstrates the business revenue split by division. It includes the current years business revenue split and revenue by business divisions such as automotive and financial services.Take your projects to the next level with our ultimate collection of Revenue Split By Business Division Automotive Manufacturing Company Profile CP SS V. Slidegeeks has designed a range of layouts that are perfect for representing task or activity duration, keeping track of all your deadlines at a glance. Tailor these designs to your exact needs and give them a truly corporate look with your own brand colors they will make your projects stand out from the rest Mentioned slide demonstrates the business revenue split by division. It includes the current years business revenue split and revenue by business divisions such as automotive and financial services.
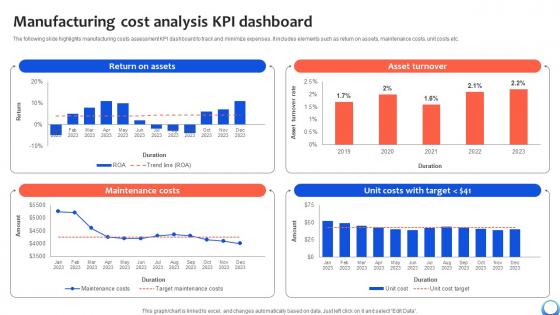
Manufacturing Cost Analysis KPI Dashboard Automating Production Process Strategy SS V
The following slide highlights manufacturing costs assessment KPI dashboard to track and minimize expenses. It includes elements such as return on assets, maintenance costs, unit costs etc. Make sure to capture your audiences attention in your business displays with our gratis customizable Manufacturing Cost Analysis KPI Dashboard Automating Production Process Strategy SS V. These are great for business strategies, office conferences, capital raising or task suggestions. If you desire to acquire more customers for your tech business and ensure they stay satisfied, create your own sales presentation with these plain slides. The following slide highlights manufacturing costs assessment KPI dashboard to track and minimize expenses. It includes elements such as return on assets, maintenance costs, unit costs etc.
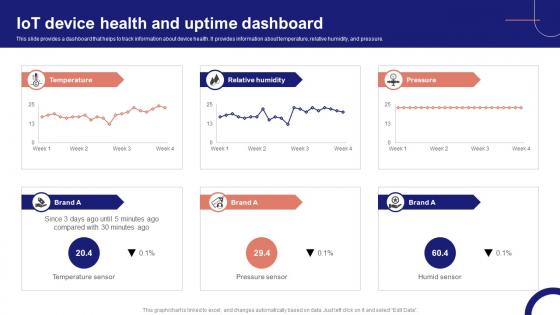
IoT Device Management Fundamentals IoT Device Health And Uptime Dashboard IoT Ss V
This slide provides a dashboard that helps to track information about device health. It provides information about temperature, relative humidity, and pressure. Take your projects to the next level with our ultimate collection of IoT Device Management Fundamentals IoT Device Health And Uptime Dashboard IoT SS V. Slidegeeks has designed a range of layouts that are perfect for representing task or activity duration, keeping track of all your deadlines at a glance. Tailor these designs to your exact needs and give them a truly corporate look with your own brand colors they will make your projects stand out from the rest This slide provides a dashboard that helps to track information about device health. It provides information about temperature, relative humidity, and pressure.
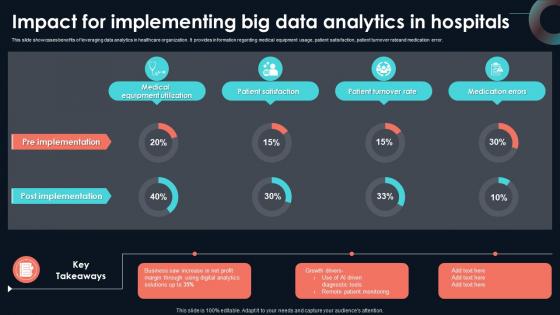
Impact For Implementing Big Data Analytics Developing Strategic Insights Using Big Data Analytics SS V
This slide showcases benefits of leveraging data analytics in healthcare organization. It provides information regarding medical equipment usage, patient satisfaction, patient turnover rateand medication error. Take your projects to the next level with our ultimate collection of Impact For Implementing Big Data Analytics Developing Strategic Insights Using Big Data Analytics SS V. Slidegeeks has designed a range of layouts that are perfect for representing task or activity duration, keeping track of all your deadlines at a glance. Tailor these designs to your exact needs and give them a truly corporate look with your own brand colors they will make your projects stand out from the rest This slide showcases benefits of leveraging data analytics in healthcare organization. It provides information regarding medical equipment usage, patient satisfaction, patient turnover rateand medication error.
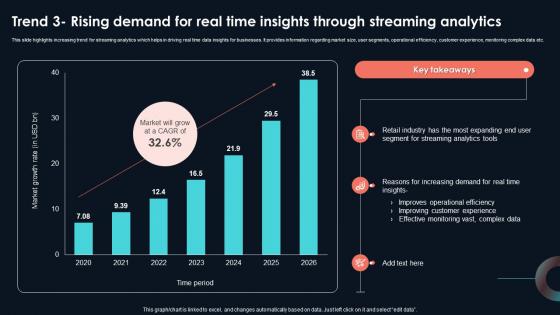
Trend 3 Rising Demand For Real Time Insights Developing Strategic Insights Using Big Data Analytics SS V
This slide highlights increasing trend for streaming analytics which helps in driving real time data insights for businesses. It provides information regarding market size, user segments, operational efficiency, customer experience, monitoring complex data etc. Take your projects to the next level with our ultimate collection of Trend 3 Rising Demand For Real Time Insights Developing Strategic Insights Using Big Data Analytics SS V. Slidegeeks has designed a range of layouts that are perfect for representing task or activity duration, keeping track of all your deadlines at a glance. Tailor these designs to your exact needs and give them a truly corporate look with your own brand colors they will make your projects stand out from the rest This slide highlights increasing trend for streaming analytics which helps in driving real time data insights for businesses. It provides information regarding market size, user segments, operational efficiency, customer experience, monitoring complex data etc.
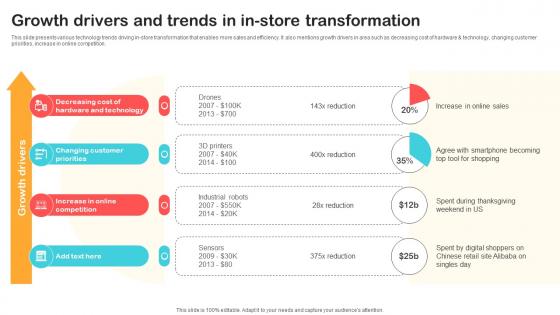
Growth Drivers And Trends In In Store Transformation Optimizing Retail Operations With Digital DT SS V
This slide presents various technology trends driving in-store transformation that enables more sales and efficiency. It also mentions growth drivers in area such as decreasing cost of hardware and technology, changing customer priorities, increase in online competition.Take your projects to the next level with our ultimate collection of Growth Drivers And Trends In In Store Transformation Optimizing Retail Operations With Digital DT SS V. Slidegeeks has designed a range of layouts that are perfect for representing task or activity duration, keeping track of all your deadlines at a glance. Tailor these designs to your exact needs and give them a truly corporate look with your own brand colors they will make your projects stand out from the rest This slide presents various technology trends driving in-store transformation that enables more sales and efficiency. It also mentions growth drivers in area such as decreasing cost of hardware and technology, changing customer priorities, increase in online competition.
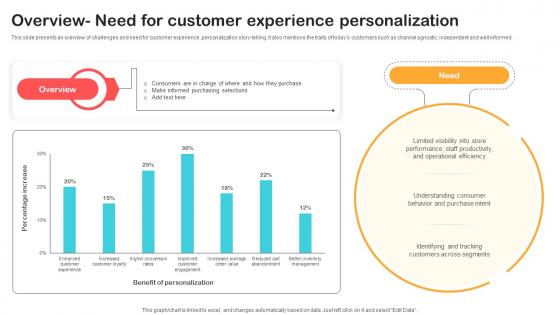
Overview Need For Customer Experience Personalization Optimizing Retail Operations With Digital DT SS V
This slide presents an overview of challenges and need for customer experience ,personalization story-telling. It also mentions the traits of todays customers such as channel agnostic, independent and well informed.Make sure to capture your audiences attention in your business displays with our gratis customizable Overview Need For Customer Experience Personalization Optimizing Retail Operations With Digital DT SS V. These are great for business strategies, office conferences, capital raising or task suggestions. If you desire to acquire more customers for your tech business and ensure they stay satisfied, create your own sales presentation with these plain slides. This slide presents an overview of challenges and need for customer experience ,personalization story-telling. It also mentions the traits of todays customers such as channel agnostic, independent and well informed.
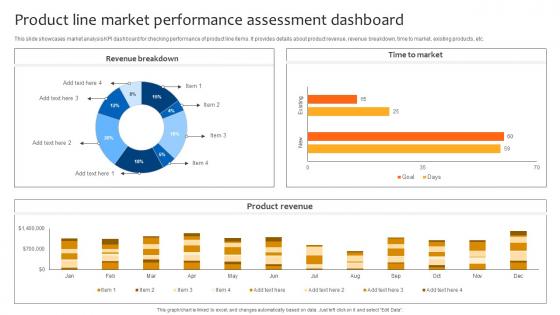
Deploying Strategies For Business Product Line Market Performance Assessment Dashboard Strategy SS V
This slide showcases market analysis KPI dashboard for checking performance of product line items. It provides details about product revenue, revenue breakdown, time to market, existing products, etc. Take your projects to the next level with our ultimate collection of Deploying Strategies For Business Product Line Market Performance Assessment Dashboard Strategy SS V. Slidegeeks has designed a range of layouts that are perfect for representing task or activity duration, keeping track of all your deadlines at a glance. Tailor these designs to your exact needs and give them a truly corporate look with your own brand colors they will make your projects stand out from the rest This slide showcases market analysis KPI dashboard for checking performance of product line items. It provides details about product revenue, revenue breakdown, time to market, existing products, etc.
Unlocking Potential IoTs Application Dashboard For Tracking IoT Devices Performance IoT SS V
This slide provides a dashboard for monitoring IoT devices that enhance agricultural practices. It incorporates IoT sensors to measure water tank capacity, Live crop monitoring, temperature and humidity measurements, control sprinklers, etc. Make sure to capture your audiences attention in your business displays with our gratis customizable Unlocking Potential IoTs Application Dashboard For Tracking IoT Devices Performance IoT SS V. These are great for business strategies, office conferences, capital raising or task suggestions. If you desire to acquire more customers for your tech business and ensure they stay satisfied, create your own sales presentation with these plain slides. This slide provides a dashboard for monitoring IoT devices that enhance agricultural practices. It incorporates IoT sensors to measure water tank capacity, Live crop monitoring, temperature and humidity measurements, control sprinklers, etc.
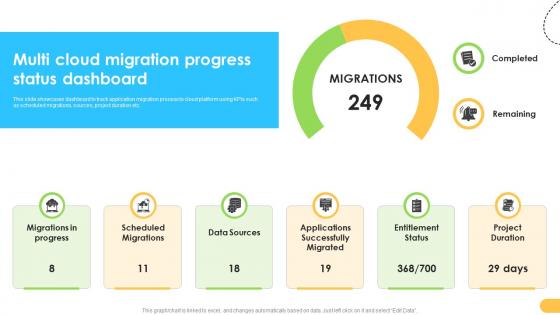
Multi Cloud Migration Progress Status Dashboard Data Migration From On Premises
This slide showcases dashboard to track application migration process to cloud platform using KPIs such as scheduled migrations, sources, project duration etc. Take your projects to the next level with our ultimate collection of Multi Cloud Migration Progress Status Dashboard Data Migration From On Premises. Slidegeeks has designed a range of layouts that are perfect for representing task or activity duration, keeping track of all your deadlines at a glance. Tailor these designs to your exact needs and give them a truly corporate look with your own brand colors they will make your projects stand out from the rest This slide showcases dashboard to track application migration process to cloud platform using KPIs such as scheduled migrations, sources, project duration etc.
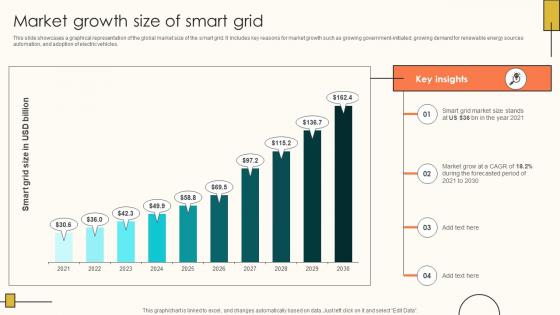
Market Growth Size Of Smart Grid Internet Of Things Solutions To Enhance Energy IoT SS V
This slide showcases a graphical representation of the global market size of the smart grid. It Includes key reasons for market growth such as growing government-initiated, growing demand for renewable energy sources automation, and adoption of electric vehicles. Take your projects to the next level with our ultimate collection of Market Growth Size Of Smart Grid Internet Of Things Solutions To Enhance Energy IoT SS V. Slidegeeks has designed a range of layouts that are perfect for representing task or activity duration, keeping track of all your deadlines at a glance. Tailor these designs to your exact needs and give them a truly corporate look with your own brand colors they will make your projects stand out from the rest This slide showcases a graphical representation of the global market size of the smart grid. It Includes key reasons for market growth such as growing government-initiated, growing demand for renewable energy sources automation, and adoption of electric vehicles.
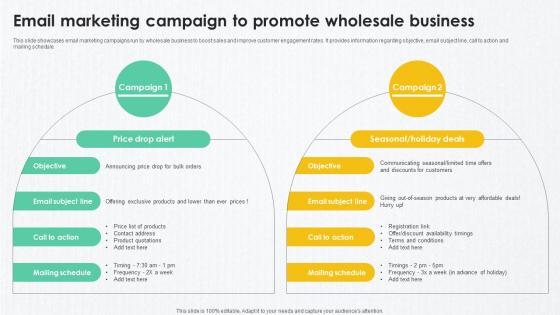
B2B Marketing Techniques To Email Marketing Campaign To Promote Wholesale
This slide showcases email marketing campaigns run by wholesale business to boost sales and improve customer engagement rates. It provides information regarding objective, email subject line, call to action and mailing schedule. Take your projects to the next level with our ultimate collection of B2B Marketing Techniques To Email Marketing Campaign To Promote Wholesale. Slidegeeks has designed a range of layouts that are perfect for representing task or activity duration, keeping track of all your deadlines at a glance. Tailor these designs to your exact needs and give them a truly corporate look with your own brand colors they will make your projects stand out from the rest This slide showcases email marketing campaigns run by wholesale business to boost sales and improve customer engagement rates. It provides information regarding objective, email subject line, call to action and mailing schedule.
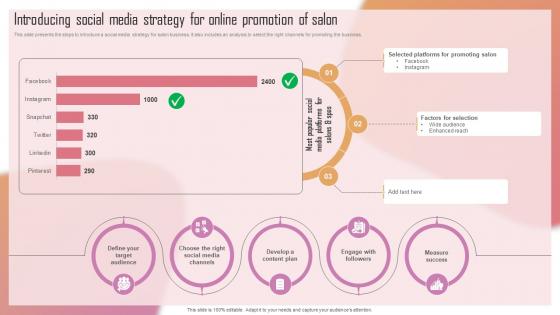
Customizing The Salon Experience Introducing Social Media Strategy For Online Promotion Strategy SS V
This slide presents the steps to introduce a social media strategy for salon business. It also includes an analysis to select the right channels for promoting the business. Take your projects to the next level with our ultimate collection of Customizing The Salon Experience Introducing Social Media Strategy For Online Promotion Strategy SS V. Slidegeeks has designed a range of layouts that are perfect for representing task or activity duration, keeping track of all your deadlines at a glance. Tailor these designs to your exact needs and give them a truly corporate look with your own brand colors they will make your projects stand out from the rest This slide presents the steps to introduce a social media strategy for salon business. It also includes an analysis to select the right channels for promoting the business.
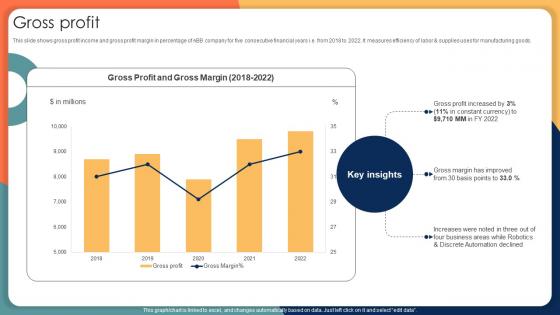
Gross Profit Engineering Solution Provider Company Profile CP SS V
This slide shows gross profit income and gross profit margin in percentage of ABB company for five consecutive financial years i.e. from 2018 to 2022. It measures efficiency of labor and supplies uses for manufacturing goods. Make sure to capture your audiences attention in your business displays with our gratis customizable Gross Profit Engineering Solution Provider Company Profile CP SS V. These are great for business strategies, office conferences, capital raising or task suggestions. If you desire to acquire more customers for your tech business and ensure they stay satisfied, create your own sales presentation with these plain slides. This slide shows gross profit income and gross profit margin in percentage of ABB company for five consecutive financial years i.e. from 2018 to 2022. It measures efficiency of labor and supplies uses for manufacturing goods.
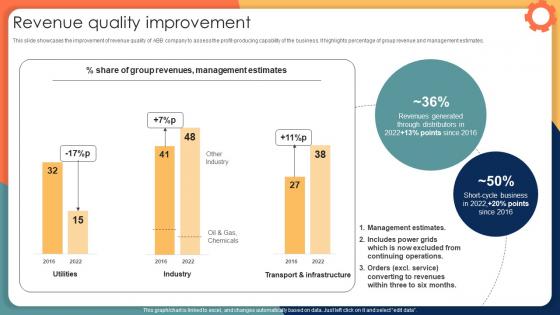
Revenue Quality Improvement Engineering Solution Provider Company Profile CP SS V
This slide showcases the improvement of revenue quality of ABB company to assess the profit-producing capability of the business. It highlights percentage of group revenue and management estimates. Take your projects to the next level with our ultimate collection of Revenue Quality Improvement Engineering Solution Provider Company Profile CP SS V. Slidegeeks has designed a range of layouts that are perfect for representing task or activity duration, keeping track of all your deadlines at a glance. Tailor these designs to your exact needs and give them a truly corporate look with your own brand colors they will make your projects stand out from the rest This slide showcases the improvement of revenue quality of ABB company to assess the profit-producing capability of the business. It highlights percentage of group revenue and management estimates.
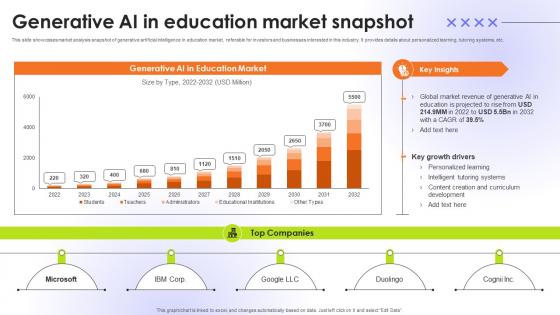
Generative AI In Education Market Snapshot Educational Transformation Through AI SS V
This slide showcases market analysis snapshot of generative artificial intelligence in education market, referable for investors and businesses interested in this industry. It provides details about personalized learning, tutoring systems, etc. Take your projects to the next level with our ultimate collection of Generative AI In Education Market Snapshot Educational Transformation Through AI SS V. Slidegeeks has designed a range of layouts that are perfect for representing task or activity duration, keeping track of all your deadlines at a glance. Tailor these designs to your exact needs and give them a truly corporate look with your own brand colors they will make your projects stand out from the rest This slide showcases market analysis snapshot of generative artificial intelligence in education market, referable for investors and businesses interested in this industry. It provides details about personalized learning, tutoring systems, etc.

Remote Sales Plan For Ideal Time For Customer Cold Calling Strategy SS V
This slide highlights graphs that can help organization to determine ideal time and day for cold calling customers. Identifying ideal time for cold calling can help to increase the conversation sales of inside sales strategy. Make sure to capture your audiences attention in your business displays with our gratis customizable Remote Sales Plan For Ideal Time For Customer Cold Calling Strategy SS V. These are great for business strategies, office conferences, capital raising or task suggestions. If you desire to acquire more customers for your tech business and ensure they stay satisfied, create your own sales presentation with these plain slides. This slide highlights graphs that can help organization to determine ideal time and day for cold calling customers. Identifying ideal time for cold calling can help to increase the conversation sales of inside sales strategy.

Marketing Growth Strategy Performance Dashboard To Measure Marketing Strategy SS V
The following slide outlines key performance indicator KPI dashboard that can assist digital marketers to evaluate marketing campaign performance. The success metrics outlined in slide are total spend on advertisement, cost per thousand CPM, cost per click CPC, click-through rate CTR, etc. Take your projects to the next level with our ultimate collection of Marketing Growth Strategy Performance Dashboard To Measure Marketing Strategy SS V. Slidegeeks has designed a range of layouts that are perfect for representing task or activity duration, keeping track of all your deadlines at a glance. Tailor these designs to your exact needs and give them a truly corporate look with your own brand colors they will make your projects stand out from the rest The following slide outlines key performance indicator KPI dashboard that can assist digital marketers to evaluate marketing campaign performance. The success metrics outlined in slide are total spend on advertisement, cost per thousand CPM, cost per click CPC, click-through rate CTR, etc.
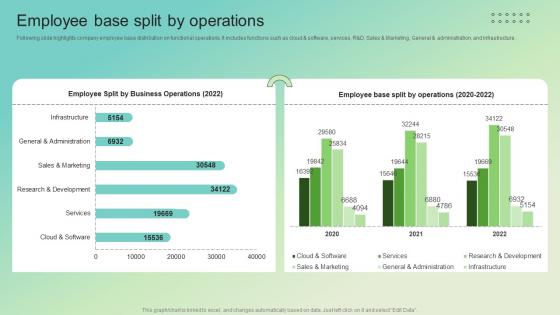
Employee Base Split By Operations Enterprise Software Solution Providing Company Profile CP SS V
Following slide highlights company employee base distribution on functional operations. It includes functions such as cloud and software, services, RandD, Sales and Marketing, General and administration, and infrastructure. Make sure to capture your audiences attention in your business displays with our gratis customizable Employee Base Split By Operations Enterprise Software Solution Providing Company Profile CP SS V. These are great for business strategies, office conferences, capital raising or task suggestions. If you desire to acquire more customers for your tech business and ensure they stay satisfied, create your own sales presentation with these plain slides. Following slide highlights company employee base distribution on functional operations. It includes functions such as cloud and software, services, RandD, Sales and Marketing, General and administration, and infrastructure.
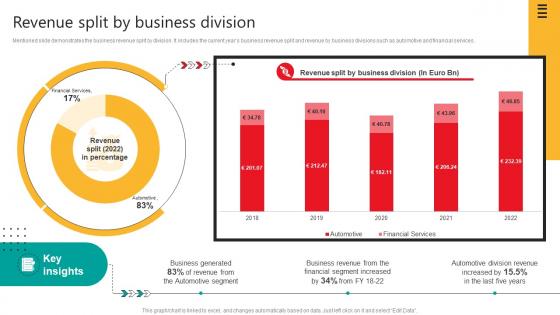
Revenue Split By Business Division Automobile Development Company Profile CP SS V
Mentioned slide demonstrates the business revenue split by division. It includes the current years business revenue split and revenue by business divisions such as automotive and financial services.Take your projects to the next level with our ultimate collection of Revenue Split By Business Division Automobile Development Company Profile CP SS V. Slidegeeks has designed a range of layouts that are perfect for representing task or activity duration, keeping track of all your deadlines at a glance. Tailor these designs to your exact needs and give them a truly corporate look with your own brand colors they will make your projects stand out from the rest Mentioned slide demonstrates the business revenue split by division. It includes the current years business revenue split and revenue by business divisions such as automotive and financial services.
Driving Results Designing A Team Training And Development Program Tracking Dashboard
This slide depicts team development program tracking dashboard to analyze the impact of implementing training plan for the members. It includes training satisfaction rate, engagement score, drop-out rate and top 5 trainees. Take your projects to the next level with our ultimate collection of Driving Results Designing A Team Training And Development Program Tracking Dashboard. Slidegeeks has designed a range of layouts that are perfect for representing task or activity duration, keeping track of all your deadlines at a glance. Tailor these designs to your exact needs and give them a truly corporate look with your own brand colors they will make your projects stand out from the rest This slide depicts team development program tracking dashboard to analyze the impact of implementing training plan for the members. It includes training satisfaction rate, engagement score, drop-out rate and top 5 trainees.
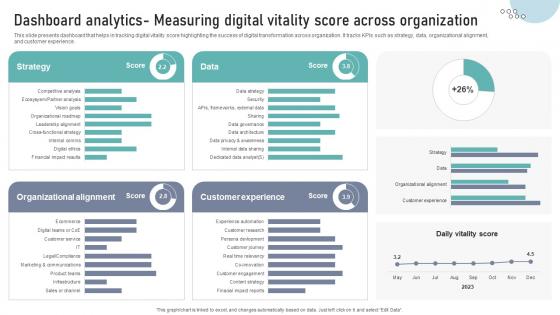
Dashboard Analytics Measuring Digital Vitality Score Across Organization DT SS V
This slide presents dashboard that helps in tracking digital vitality score highlighting the success of digital transformation across organization. It tracks KPIs such as strategy, data, organizational alignment,and customer experience.Make sure to capture your audiences attention in your business displays with our gratis customizable Dashboard Analytics Measuring Digital Vitality Score Across Organization DT SS V. These are great for business strategies, office conferences, capital raising or task suggestions. If you desire to acquire more customers for your tech business and ensure they stay satisfied, create your own sales presentation with these plain slides. This slide presents dashboard that helps in tracking digital vitality score highlighting the success of digital transformation across organization. It tracks KPIs such as strategy, data, organizational alignment,and customer experience.
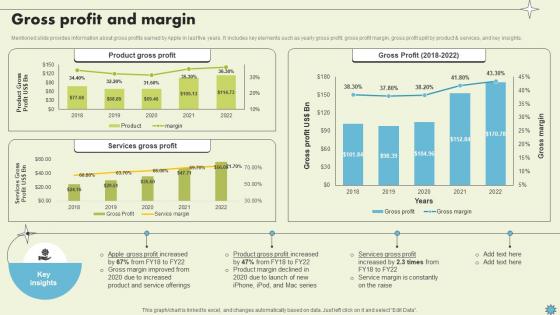
Gross Profit And Margin Consumer Electronics Company Profile CP SS V
Mentioned slide provides information about gross profits earned by Apple in last five years. It includes key elements such as yearly gross profit, gross profit margin, gross profit split by product and services, and key insights.Take your projects to the next level with our ultimate collection of Gross Profit And Margin Consumer Electronics Company Profile CP SS V. Slidegeeks has designed a range of layouts that are perfect for representing task or activity duration, keeping track of all your deadlines at a glance. Tailor these designs to your exact needs and give them a truly corporate look with your own brand colors they will make your projects stand out from the rest Mentioned slide provides information about gross profits earned by Apple in last five years. It includes key elements such as yearly gross profit, gross profit margin, gross profit split by product and services, and key insights.
Comprehensive Guide For Website Various Kpis For Tracking Business Performance
Mentioned slide provide insights into various key performance indicators to determine business performance. It includes KPIs such as business financials, website traffic, customer case, customer engagement, conversion rate, customer retention, customer bounce rate, employee turnover, etc. Make sure to capture your audiences attention in your business displays with our gratis customizable Comprehensive Guide For Website Various Kpis For Tracking Business Performance. These are great for business strategies, office conferences, capital raising or task suggestions. If you desire to acquire more customers for your tech business and ensure they stay satisfied, create your own sales presentation with these plain slides. Mentioned slide provide insights into various key performance indicators to determine business performance. It includes KPIs such as business financials, website traffic, customer case, customer engagement, conversion rate, customer retention, customer bounce rate, employee turnover, etc.
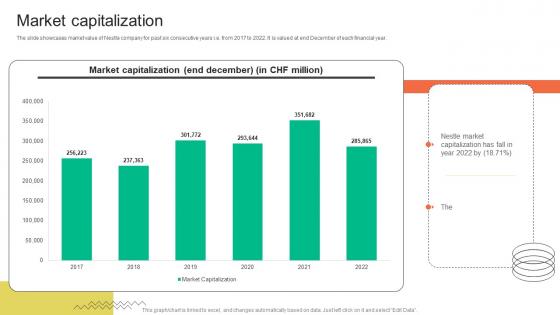
Market Capitalization FMCG Provider Company Profile CP SS V
The slide showcases market value of Nestle company for past six consecutive years i.e. from 2017 to 2022. It is valued at end December of each financial year. Make sure to capture your audiences attention in your business displays with our gratis customizable Market Capitalization FMCG Provider Company Profile CP SS V. These are great for business strategies, office conferences, capital raising or task suggestions. If you desire to acquire more customers for your tech business and ensure they stay satisfied, create your own sales presentation with these plain slides. The slide showcases market value of Nestle company for past six consecutive years i.e. from 2017 to 2022. It is valued at end December of each financial year.
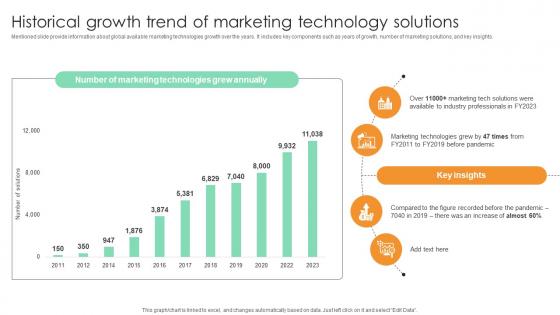
Historical Growth Trend Of Marketing Technology Comprehensive Guide For Marketing Technology
Mentioned slide provide information about global available marketing technologies growth over the years. It includes key components such as years of growth, number of marketing solutions, and key insights. Take your projects to the next level with our ultimate collection of Historical Growth Trend Of Marketing Technology Comprehensive Guide For Marketing Technology. Slidegeeks has designed a range of layouts that are perfect for representing task or activity duration, keeping track of all your deadlines at a glance. Tailor these designs to your exact needs and give them a truly corporate look with your own brand colors they will make your projects stand out from the rest Mentioned slide provide information about global available marketing technologies growth over the years. It includes key components such as years of growth, number of marketing solutions, and key insights.
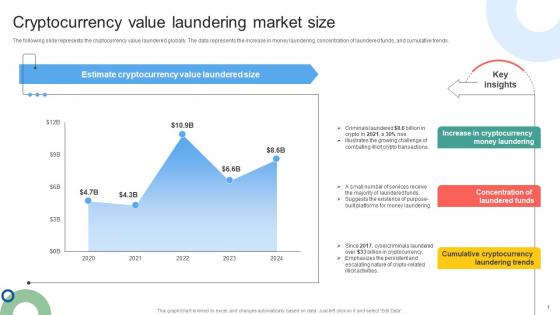
Cryptocurrency Value Laundering Market Size Mapping Out The Anti Money Fin SS V
The following slide represents the cryptocurrency value laundered globally. The data represents the increase in money laundering, concentration of laundered funds, and cumulative trends. Make sure to capture your audiences attention in your business displays with our gratis customizable Cryptocurrency Value Laundering Market Size Mapping Out The Anti Money Fin SS V. These are great for business strategies, office conferences, capital raising or task suggestions. If you desire to acquire more customers for your tech business and ensure they stay satisfied, create your own sales presentation with these plain slides. The following slide represents the cryptocurrency value laundered globally. The data represents the increase in money laundering, concentration of laundered funds, and cumulative trends.
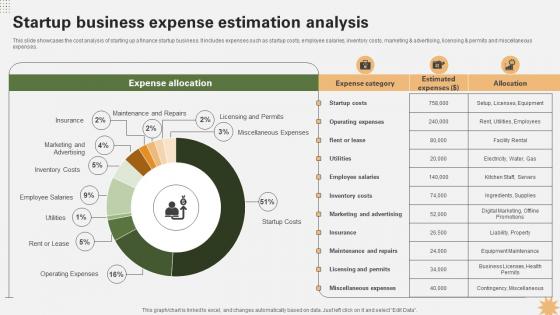
Startup Business Expense Estimation Analysis Strategy For Launching A Financial Strategy SS V
This slide showcases the cost analysis of starting up a finance startup business. It includes expenses such as startup costs, employee salaries, inventory costs, marketing and advertising, licensing and permits and miscellaneous expenses. Take your projects to the next level with our ultimate collection of Startup Business Expense Estimation Analysis Strategy For Launching A Financial Strategy SS V. Slidegeeks has designed a range of layouts that are perfect for representing task or activity duration, keeping track of all your deadlines at a glance. Tailor these designs to your exact needs and give them a truly corporate look with your own brand colors they will make your projects stand out from the rest This slide showcases the cost analysis of starting up a finance startup business. It includes expenses such as startup costs, employee salaries, inventory costs, marketing and advertising, licensing and permits and miscellaneous expenses.
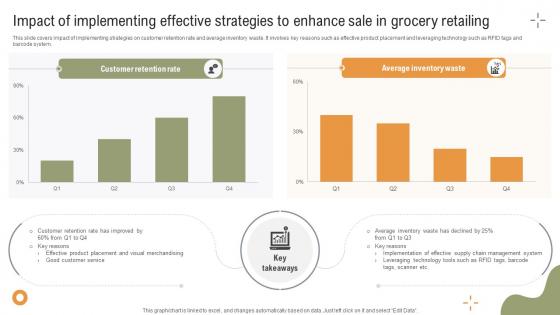
Implementing Strategies To Enhance Impact Of Implementing Effective Strategies To Enhance
This slide covers impact of implementing strategies on customer retention rate and average inventory waste. It involves key reasons such as effective product placement and leveraging technology such as RFID tags and barcode system. Make sure to capture your audiences attention in your business displays with our gratis customizable Implementing Strategies To Enhance Impact Of Implementing Effective Strategies To Enhance. These are great for business strategies, office conferences, capital raising or task suggestions. If you desire to acquire more customers for your tech business and ensure they stay satisfied, create your own sales presentation with these plain slides. This slide covers impact of implementing strategies on customer retention rate and average inventory waste. It involves key reasons such as effective product placement and leveraging technology such as RFID tags and barcode system.

Perform Comprehensive Keyword Research Top Of The Funnel Digital Content Strategy SS V
The following slide represents key outcomes of detailed keyword research to direct efforts to fulfill customer demand. It includes elements such as volume, intent, results, keyword variation, keyword difficulty, cost per click CPC etc. Take your projects to the next level with our ultimate collection of Perform Comprehensive Keyword Research Top Of The Funnel Digital Content Strategy SS V. Slidegeeks has designed a range of layouts that are perfect for representing task or activity duration, keeping track of all your deadlines at a glance. Tailor these designs to your exact needs and give them a truly corporate look with your own brand colors they will make your projects stand out from the rest The following slide represents key outcomes of detailed keyword research to direct efforts to fulfill customer demand. It includes elements such as volume, intent, results, keyword variation, keyword difficulty, cost per click CPC etc.

Telemedicine Industry Analysis Across Latin America Remote Healthcare Services IR SS V
This slide showcases the Telemedicine industry analysis of Latin America region which includes factors that contribute this regions growth such as increasing aging population. It also includes market players operating in this region. Take your projects to the next level with our ultimate collection of Telemedicine Industry Analysis Across Latin America Remote Healthcare Services IR SS V. Slidegeeks has designed a range of layouts that are perfect for representing task or activity duration, keeping track of all your deadlines at a glance. Tailor these designs to your exact needs and give them a truly corporate look with your own brand colors they will make your projects stand out from the rest This slide showcases the Telemedicine industry analysis of Latin America region which includes factors that contribute this regions growth such as increasing aging population. It also includes market players operating in this region.

Graph Illustrating Impact Of Prescriptive Analytics Data Analytics SS V
This slide showcases graph highlighting impact analysis of prescriptive analytics on businesses via use of major performance indicators. It provides information total revenue, inventory levels and labour costs with key insights.Take your projects to the next level with our ultimate collection of Graph Illustrating Impact Of Prescriptive Analytics Data Analytics SS V. Slidegeeks has designed a range of layouts that are perfect for representing task or activity duration, keeping track of all your deadlines at a glance. Tailor these designs to your exact needs and give them a truly corporate look with your own brand colors they will make your projects stand out from the rest This slide showcases graph highlighting impact analysis of prescriptive analytics on businesses via use of major performance indicators. It provides information total revenue, inventory levels and labour costs with key insights.

Segmentation Of Global Prescriptive Analytics Market Data Analytics SS V
This slide provides an overview of market segmentation of prescriptive analytics at a global level. It covers segmentation analysis based on region, data type, component and deployment with key takeaways.Take your projects to the next level with our ultimate collection of Segmentation Of Global Prescriptive Analytics Market Data Analytics SS V. Slidegeeks has designed a range of layouts that are perfect for representing task or activity duration, keeping track of all your deadlines at a glance. Tailor these designs to your exact needs and give them a truly corporate look with your own brand colors they will make your projects stand out from the rest This slide provides an overview of market segmentation of prescriptive analytics at a global level. It covers segmentation analysis based on region, data type, component and deployment with key takeaways.
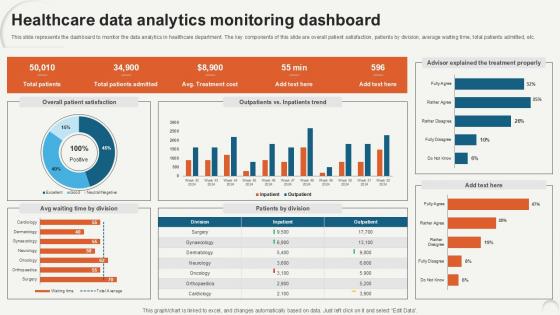
Healthcare Data Analytics Monitoring Data Analytics For Informed Decision Ppt PowerPoint
This slide represents the dashboard to monitor the data analytics in healthcare department. The key components of this slide are overall patient satisfaction, patients by division, average waiting time, total patients admitted, etc. Make sure to capture your audiences attention in your business displays with our gratis customizable Healthcare Data Analytics Monitoring Data Analytics For Informed Decision Ppt PowerPoint. These are great for business strategies, office conferences, capital raising or task suggestions. If you desire to acquire more customers for your tech business and ensure they stay satisfied, create your own sales presentation with these plain slides. This slide represents the dashboard to monitor the data analytics in healthcare department. The key components of this slide are overall patient satisfaction, patients by division, average waiting time, total patients admitted, etc.
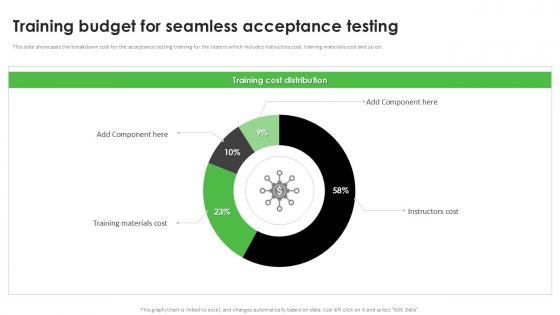
Training Budget For Seamless Acceptance Testing PPT Template
This slide showcases the breakdown cost for the acceptance testing training for the testers which includes instructors cost, training materials cost and so on. Take your projects to the next level with our ultimate collection of Training Budget For Seamless Acceptance Testing PPT Template. Slidegeeks has designed a range of layouts that are perfect for representing task or activity duration, keeping track of all your deadlines at a glance. Tailor these designs to your exact needs and give them a truly corporate look with your own brand colors they will make your projects stand out from the rest This slide showcases the breakdown cost for the acceptance testing training for the testers which includes instructors cost, training materials cost and so on.

Portfolio Allocation Evaluation Based On Annual Return Investment Fund PPT PowerPoint
Mentioned slide provides information about evaluation of returns from various portfolio investment combination options.It includes returns KPIs such as average annual return, lowest returns, highest returns, past 20 years returns best and worst. Take your projects to the next level with our ultimate collection of Portfolio Allocation Evaluation Based On Annual Return Investment Fund PPT PowerPoint. Slidegeeks has designed a range of layouts that are perfect for representing task or activity duration, keeping track of all your deadlines at a glance. Tailor these designs to your exact needs and give them a truly corporate look with your own brand colors they will make your projects stand out from the rest Mentioned slide provides information about evaluation of returns from various portfolio investment combination options.It includes returns KPIs such as average annual return, lowest returns, highest returns, past 20 years returns best and worst.

Financial Metrics Of Commercial Vehicles Luxury Automobile Vehicles PPT Slide CP SS V
This slide showcases the financial metrics of commercial vehicles. It includes metrics such as sales volume in units, revenue in crores, domestic market share and EBITDA percent and Y-O-Y growth. Make sure to capture your audiences attention in your business displays with our gratis customizable Financial Metrics Of Commercial Vehicles Luxury Automobile Vehicles PPT Slide CP SS V. These are great for business strategies, office conferences, capital raising or task suggestions. If you desire to acquire more customers for your tech business and ensure they stay satisfied, create your own sales presentation with these plain slides. This slide showcases the financial metrics of commercial vehicles. It includes metrics such as sales volume in units, revenue in crores, domestic market share and EBITDA percent and Y-O-Y growth.
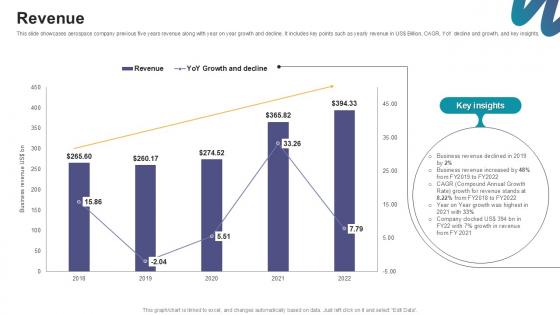
Revenue Digital Marketings Strategies PPT Sample CP SS V
This slide showcases aerospace company previous five years revenue along with year on year growth and decline. It includes key points such as yearly revenue in US Billion, CAGR, YoY decline and growth, and key insights. Take your projects to the next level with our ultimate collection of Revenue Digital Marketings Strategies PPT Sample CP SS V. Slidegeeks has designed a range of layouts that are perfect for representing task or activity duration, keeping track of all your deadlines at a glance. Tailor these designs to your exact needs and give them a truly corporate look with your own brand colors they will make your projects stand out from the rest This slide showcases aerospace company previous five years revenue along with year on year growth and decline. It includes key points such as yearly revenue in US Billion, CAGR, YoY decline and growth, and key insights.
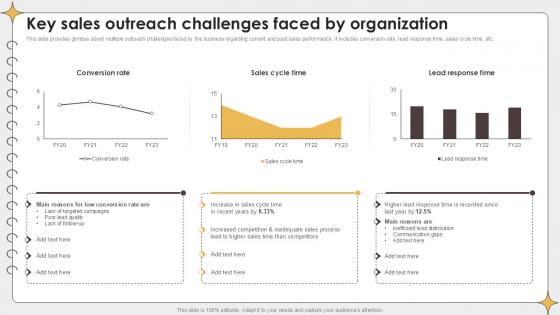
Key Sales Outreach Challenges Planning Outreach Campaigns PPT Example
This slide provides glimpse about multiple outreach challenges faced by the business regarding current and past sales performance. It includes conversion rate, lead response time, sales cycle time, etc. Take your projects to the next level with our ultimate collection of Key Sales Outreach Challenges Planning Outreach Campaigns PPT Example. Slidegeeks has designed a range of layouts that are perfect for representing task or activity duration, keeping track of all your deadlines at a glance. Tailor these designs to your exact needs and give them a truly corporate look with your own brand colors they will make your projects stand out from the rest This slide provides glimpse about multiple outreach challenges faced by the business regarding current and past sales performance. It includes conversion rate, lead response time, sales cycle time, etc.
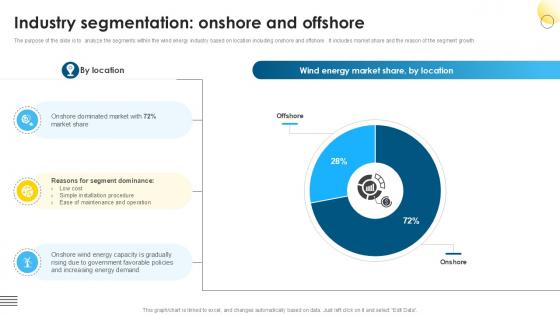
Industry Segmentation Onshore Global Wind Power Market PPT Template IR SS V
The purpose of the slide is to analyze the segments within the wind energy industry based on location including onshore and offshore . It includes market share and the reason of the segment growth. Make sure to capture your audiences attention in your business displays with our gratis customizable Industry Segmentation Onshore Global Wind Power Market PPT Template IR SS V. These are great for business strategies, office conferences, capital raising or task suggestions. If you desire to acquire more customers for your tech business and ensure they stay satisfied, create your own sales presentation with these plain slides. The purpose of the slide is to analyze the segments within the wind energy industry based on location including onshore and offshore . It includes market share and the reason of the segment growth.
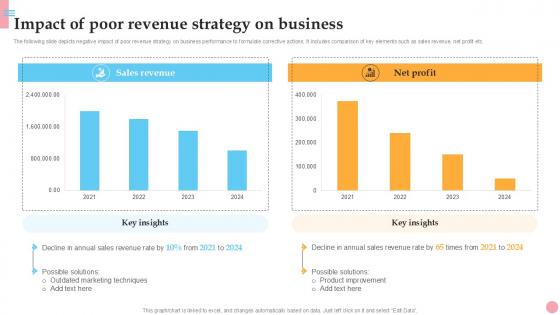
Impact Of Poor Revenue Strategy How To Improve Company PPT Presentation Strategy SS V
The following slide depicts negative impact of poor revenue strategy on business performance to formulate corrective actions. It includes comparison of key elements such as sales revenue, net profit etc. Make sure to capture your audiences attention in your business displays with our gratis customizable Impact Of Poor Revenue Strategy How To Improve Company PPT Presentation Strategy SS V. These are great for business strategies, office conferences, capital raising or task suggestions. If you desire to acquire more customers for your tech business and ensure they stay satisfied, create your own sales presentation with these plain slides. The following slide depicts negative impact of poor revenue strategy on business performance to formulate corrective actions. It includes comparison of key elements such as sales revenue, net profit etc.
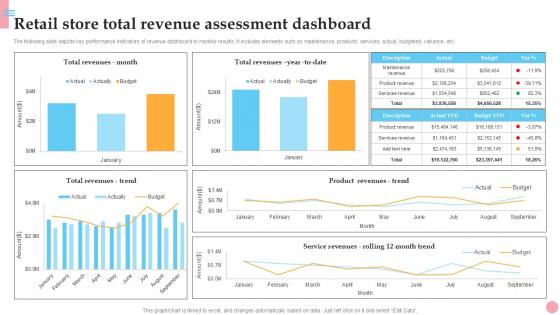
Retail Store Total Revenue Assessment How To Improve Company PPT Presentation Strategy SS V
The following slide depicts key performance indicators of revenue dashboard to monitor results. It includes elements such as maintenance, products, services, actual, budgeted, variance, etc. Take your projects to the next level with our ultimate collection of Retail Store Total Revenue Assessment How To Improve Company PPT Presentation Strategy SS V. Slidegeeks has designed a range of layouts that are perfect for representing task or activity duration, keeping track of all your deadlines at a glance. Tailor these designs to your exact needs and give them a truly corporate look with your own brand colors they will make your projects stand out from the rest The following slide depicts key performance indicators of revenue dashboard to monitor results. It includes elements such as maintenance, products, services, actual, budgeted, variance, etc.

Market Potential Plant Based Eggs Developing Company Investor PPT Example
This slide shows information regarding the market potential or opportunity available for the company in current market. It also includes details regarding compound annual growth rate. Take your projects to the next level with our ultimate collection of Market Potential Plant Based Eggs Developing Company Investor PPT Example. Slidegeeks has designed a range of layouts that are perfect for representing task or activity duration, keeping track of all your deadlines at a glance. Tailor these designs to your exact needs and give them a truly corporate look with your own brand colors they will make your projects stand out from the rest This slide shows information regarding the market potential or opportunity available for the company in current market. It also includes details regarding compound annual growth rate.
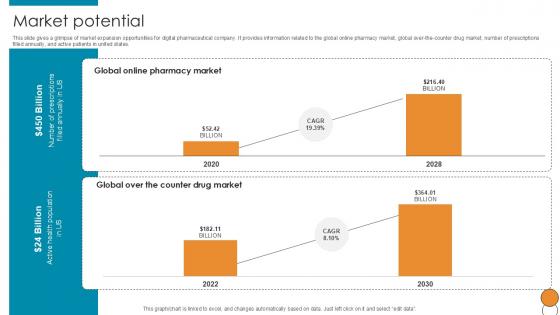
Market Potential Digital Pharmacy Company Investor Funding Ppt Template
This slide gives a glimpse of market expansion opportunities for digital pharmaceutical company. It provides information related to the global online pharmacy market, global over-the-counter drug market, number of prescriptions filled annually, and active patients in united states. Take your projects to the next level with our ultimate collection of Market Potential Digital Pharmacy Company Investor Funding Ppt Template. Slidegeeks has designed a range of layouts that are perfect for representing task or activity duration, keeping track of all your deadlines at a glance. Tailor these designs to your exact needs and give them a truly corporate look with your own brand colors they will make your projects stand out from the rest This slide gives a glimpse of market expansion opportunities for digital pharmaceutical company. It provides information related to the global online pharmacy market, global over-the-counter drug market, number of prescriptions filled annually, and active patients in united states.
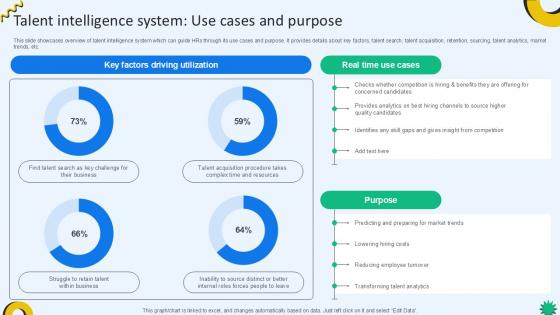
Talent Intelligence System Use Cases Cloud Recruiting Technologies PPT Slide
This slide showcases overview of talent intelligence system which can guide HRs through its use cases and purpose. It provides details about key factors, talent search, talent acquisition, retention, sourcing, talent analytics, market trends, etc. Take your projects to the next level with our ultimate collection of Talent Intelligence System Use Cases Cloud Recruiting Technologies PPT Slide. Slidegeeks has designed a range of layouts that are perfect for representing task or activity duration, keeping track of all your deadlines at a glance. Tailor these designs to your exact needs and give them a truly corporate look with your own brand colors they will make your projects stand out from the rest This slide showcases overview of talent intelligence system which can guide HRs through its use cases and purpose. It provides details about key factors, talent search, talent acquisition, retention, sourcing, talent analytics, market trends, etc.
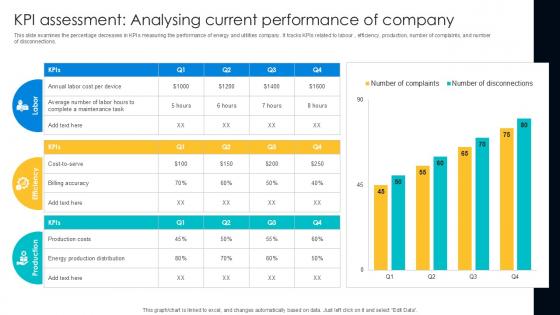
KPI Assessment Analysing Current Digital Transformation Journey PPT Slide DT SS V
This slide examines the percentage decreases in KPIs measuring the performance of energy and utilities company. It tracks KPIs related to labour , efficiency, production, number of complaints, and number of disconnections. Take your projects to the next level with our ultimate collection of KPI Assessment, Analysing Current Performance, Company. Slidegeeks has designed a range of layouts that are perfect for representing task or activity duration, keeping track of all your deadlines at a glance. Tailor these designs to your exact needs and give them a truly corporate look with your own brand colors they will make your projects stand out from the rest This slide examines the percentage decreases in KPIs measuring the performance of energy and utilities company. It tracks KPIs related to labour , efficiency, production, number of complaints, and number of disconnections.
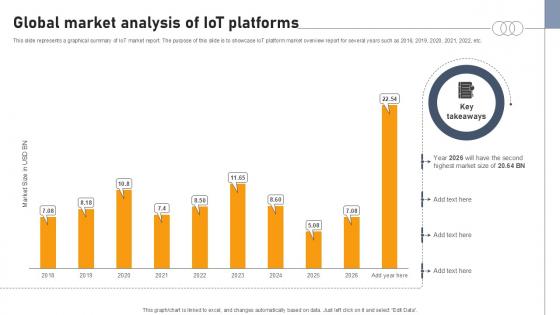
Global Market Analysis Of Iot Platforms Aws IOT Platform Ppt Template
This slide represents a graphical summary of IoT market report. The purpose of this slide is to showcase IoT platform market overview report for several years such as 2018, 2019, 2020, 2021, 2022, etc. Take your projects to the next level with our ultimate collection of Global Market Analysis Of Iot Platforms Aws IOT Platform Ppt Template Slidegeeks has designed a range of layouts that are perfect for representing task or activity duration, keeping track of all your deadlines at a glance. Tailor these designs to your exact needs and give them a truly corporate look with your own brand colors they will make your projects stand out from the rest This slide represents a graphical summary of IoT market report. The purpose of this slide is to showcase IoT platform market overview report for several years such as 2018, 2019, 2020, 2021, 2022, etc.
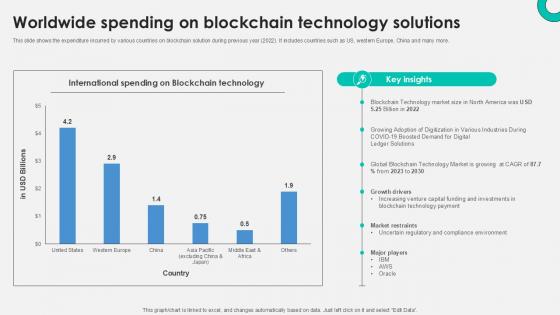
Worldwide Spending On Blockchain Everything About Bitcoin PPT Template Fin SS V
This slide shows the expenditure incurred by various countries on blockchain solution during previous year 2022. It includes countries such as US, western Europe, China and many more. Make sure to capture your audiences attention in your business displays with our gratis customizable Worldwide Spending On Blockchain Everything About Bitcoin PPT Template Fin SS V. These are great for business strategies, office conferences, capital raising or task suggestions. If you desire to acquire more customers for your tech business and ensure they stay satisfied, create your own sales presentation with these plain slides. This slide shows the expenditure incurred by various countries on blockchain solution during previous year 2022. It includes countries such as US, western Europe, China and many more.

Hospital Performance Management Analysis On Power BI Ppt Presentation SS
This slide highlights strategic account plan process to develop long term relation with customer and increase revenue. It consists of steps that are existing position, customer voice, relationship management and growth opportunities Make sure to capture your audiences attention in your business displays with our gratis customizable Hospital Performance Management Analysis On Power BI Ppt Presentation SS These are great for business strategies, office conferences, capital raising or task suggestions. If you desire to acquire more customers for your tech business and ensure they stay satisfied, create your own sales presentation with these plain slides. This slide highlights strategic account plan process to develop long term relation with customer and increase revenue. It consists of steps that are existing position, customer voice, relationship management and growth opportunities
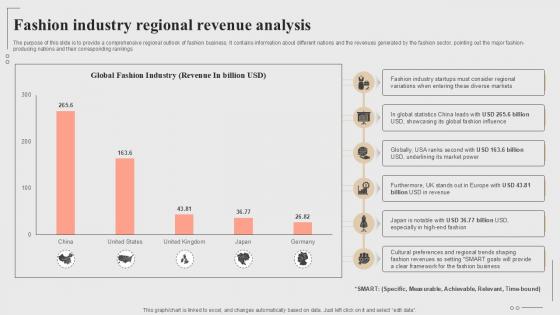
Fashion Industry Regional Revenue Analysis Fashion Startup Roadmap Plan Ppt Template BP SS V
The purpose of this slide is to provide a comprehensive regional outlook of fashion business. It contains information about different nations and the revenues generated by the fashion sector, pointing out the major fashion-producing nations and their corresponding rankings Make sure to capture your audiences attention in your business displays with our gratis customizable Fashion Industry Regional Revenue Analysis Fashion Startup Roadmap Plan Ppt Template BP SS V These are great for business strategies, office conferences, capital raising or task suggestions. If you desire to acquire more customers for your tech business and ensure they stay satisfied, create your own sales presentation with these plain slides. The purpose of this slide is to provide a comprehensive regional outlook of fashion business. It contains information about different nations and the revenues generated by the fashion sector, pointing out the major fashion-producing nations and their corresponding rankings
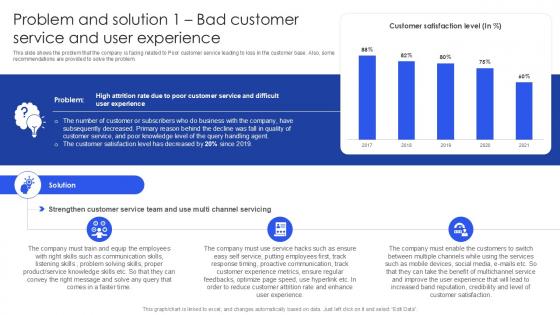
Problem And Solution 1 Bad Customer Service And User Experience PPT Presentation SS
This slide shows the problem that the company is facing related to Poor customer service leading to loss in the customer base. Also, some recommendations are provided to solve the problem. Make sure to capture your audiences attention in your business displays with our gratis customizable Problem And Solution 1 Bad Customer Service And User Experience PPT Presentation SS. These are great for business strategies, office conferences, capital raising or task suggestions. If you desire to acquire more customers for your tech business and ensure they stay satisfied, create your own sales presentation with these plain slides. This slide shows the problem that the company is facing related to Poor customer service leading to loss in the customer base. Also, some recommendations are provided to solve the problem.


 Continue with Email

 Home
Home


