Compare Chart

Project Close Progress Gantt Chart Microsoft PDF
This template covers the project closeout timeline. It includes closure tasks related to resources, information and documentation, closure meeting, etc. Pitch your topic with ease and precision using this Project Close Progress Gantt Chart Microsoft PDF. This layout presents information on Resources, Task, Information. It is also available for immediate download and adjustment. So, changes can be made in the color, design, graphics or any other component to create a unique layout.
Strategic Tracking Goals Chart Icons PDF
This slide showcases a tracking sheet that helps in defining strategic organizational goals and ensuring that all activities move them towards them. It also includes the details about the listed objectives such as the anticipated date for achieving the target, objective status, and deliverables. Pitch your topic with ease and precision using this Strategic Tracking Goals Chart Icons PDF. This layout presents information on Average, Financial Statements And Graphs. It is also available for immediate download and adjustment. So, changes can be made in the color, design, graphics or any other component to create a unique layout.
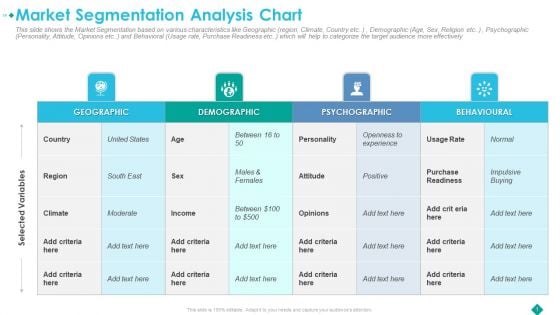
Market Segmentation Analysis Chart Download PDF
This slide shows the Market Segmentation based on various characteristics like Geographic region, Climate, Country etc., Demographic Age, Sex, Religion etc , Psychographic Personality, Attitude, Opinions etc and Behavioral Usage rate, Purchase Readiness etc. which will help to categorize the target audience more effectively Deliver and pitch your topic in the best possible manner with this market segmentation analysis chart download pdf. Use them to share invaluable insights on demographic, geographic, psychographic, behavioural and impress your audience. This template can be altered and modified as per your expectations. So, grab it now.
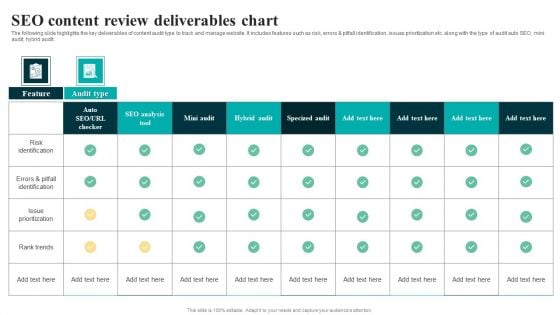
SEO Content Review Deliverables Chart Professional PDF
The following slide highlights the key deliverables of content audit type to track and manage website. It includes features such as risk, errors and pitfall identification, issues prioritization etc. along with the type of audit auto SEO, mini audit, hybrid audit. Showcasing this set of slides titled SEO Content Review Deliverables Chart Professional PDF. The topics addressed in these templates are Risk Identification, Issue Prioritization. All the content presented in this PPT design is completely editable. Download it and make adjustments in color, background, font etc. as per your unique business setting.
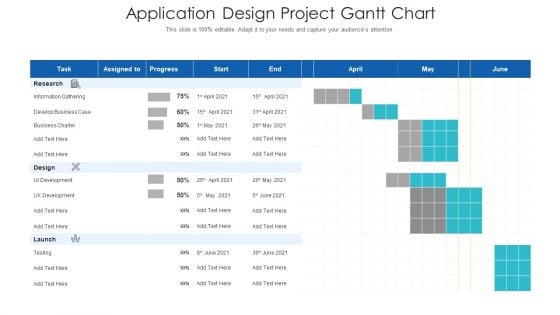
Application Design Project Gantt Chart Diagrams PDF
Your complex projects can be managed and organized simultaneously using this detailed application design project gantt chart diagrams pdf template. Track the milestones, tasks, phases, activities, and subtasks to get an updated visual of your project. Share your planning horizon and release plan with this well crafted presentation template. This exemplary template can be used to plot various dependencies to distinguish the tasks in the pipeline and their impact on the schedules and deadlines of the project. Apart from this, you can also share this visual presentation with your team members and stakeholders. It a resourceful tool that can be incorporated into your business structure. Therefore, download and edit it conveniently to add the data and statistics as per your requirement.
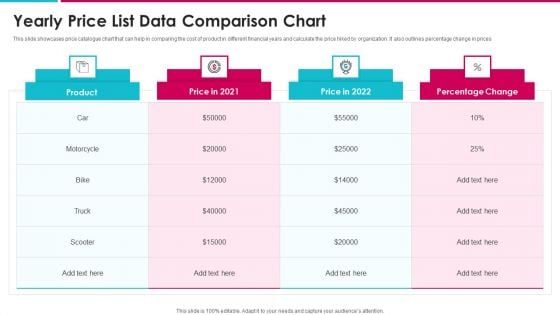
Yearly Price List Data Comparison Chart Structure PDF
This slide showcases price catalogue chart that can help in comparing the cost of product in different financial years and calculate the price hiked by organization. It also outlines percentage change in prices Showcasing this set of slides titled yearly price list data comparison chart structure pdf. The topics addressed in these templates are yearly price list data comparison chart. All the content presented in this PPT design is completely editable. Download it and make adjustments in color, background, font etc. as per your unique business setting.
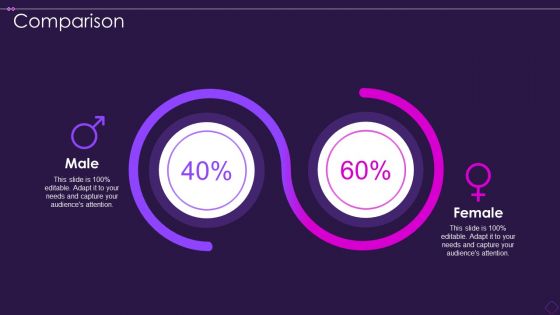
Scrum Organizational Chart Comparison Download PDF
Presenting scrum organizational chart comparison download pdf to provide visual cues and insights. Share and navigate important information on two stages that need your due attention. This template can be used to pitch topics like female, male. In addtion, this PPT design contains high resolution images, graphics, etc, that are easily editable and available for immediate download.

Price Catalogue Chart With Bulk Cost And Deviation Background PDF
This slide showcases list chart that can help consumer to compare the price per unit offered by organization in marketplace. It also showcases pricing for bulk purchase of product and deviation in prices Showcasing this set of slides titled price catalogue chart with bulk cost and deviation background pdf. The topics addressed in these templates are price catalogue chart with bulk cost and deviation. All the content presented in this PPT design is completely editable. Download it and make adjustments in color, background, font etc. as per your unique business setting.
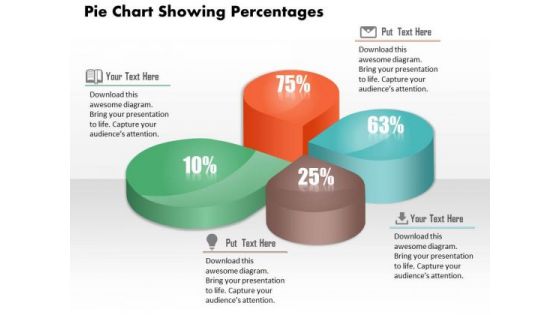
Business Diagram Pie Chart Showing Percentages Presentation Template
This image slide displays business consulting diagram of pie chart showing percentage. Pie Charts can be used to display a wide variety of information. When data is represented in the form of a pie chart the human eye finds it very easy to compare the data and quickly draw conclusions. In short they are a great visual aid and will add a touch of professionalism to any presentation which requires the display of data.
Project Management Resource Allocation Chart Ppt Icon
This is a project management resource allocation chart ppt icon. This is a five stage process. The stages in this process are team, table, business, management, format, diagram.
Organizational Turnover Example Chart Example Of Ppt
This is a organizational turnover example chart example of ppt. This is a two stage process. The stages in this process are liability, opportunity.
Profit And Loss Balance Chart Ppt Design
This is a profit and loss balance chart ppt design. This is a two stage process. The stages in this process are business, management, success, presentation, marketing.
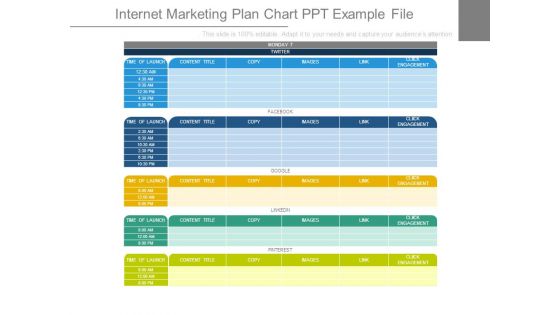
Internet Marketing Plan Chart Ppt Example File
This is a internet marketing plan chart ppt example file. This is a five stage process. The stages in this process are monday, twitter, time of launch, content title, copy, images, link, click engagement, face book, google, linkedin, pinterest.
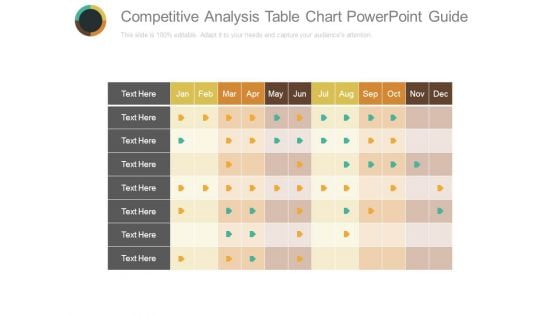
Competitive Analysis Table Chart Powerpoint Guide
This is a competitive analysis table chart powerpoint guide. This is a twelve stage process. The stages in this process are jan,feb, mar, apr, may, jun, jul, aug, sep, oct, nov, dec.
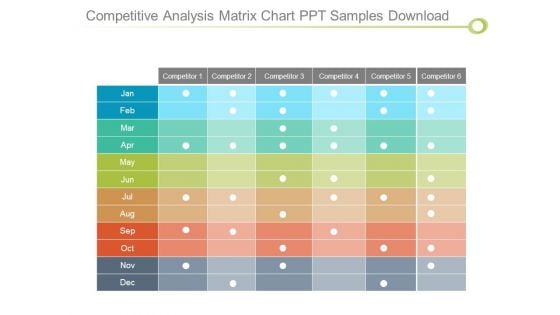
Competitive Analysis Matrix Chart Ppt Samples Download
This is a competitive analysis matrix chart ppt samples download. This is a six stage process. The stages in this process are competitor, jan, feb, mar, apr, may, jun, jul, aug, sep, oct, nov, dec.
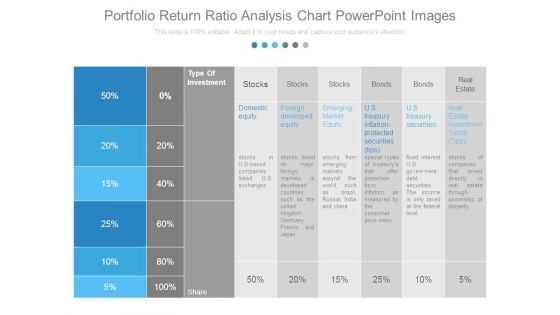
Portfolio Return Ratio Analysis Chart Powerpoint Images
This is a portfolio return ratio analysis chart powerpoint images. This is a six stage process. The stages in this process are type of investment, stocks, bonds, real estate, domestic equity, foreign developed equity, emerging market equity, u s treasury inflation protected securities tips, u s treasury securities, real estate investment trusts tips, share.
Circle Chart With Business Icons PowerPoint Slides
Every organization or business has its own process of working. And everyone has to follow this. It is easy to say it this way. But won?t it be much better if your colleagues or teammates see it graphically. Presenting circle chart with icons PPT template which is displaying the complete process in equal forms. This slide is a six step process divided equally among all the colleagues. It can also be taken as the planning. Planning in six different steps in a loop form. All icons are customizable. You can replace the icons as per your choice. Use this PowerPoint template to support your presentation and make it look more perfect.
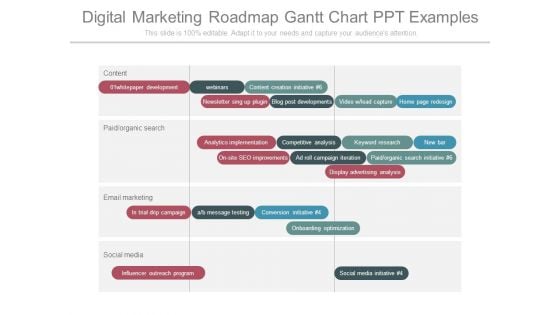
Digital Marketing Roadmap Gantt Chart Ppt Examples
This is a digital marketing roadmap gantt chart ppt examples. This is a two stage process. The stages in this process are content, whitepaper development, webinars, content creation initiative, newsletter sing up plugin, blog post developments, video lead capture, home page redesign, paid organic search, analytics implementation, competitive analysis, keyword research, new bar, on site seo improvements, ad roll campaign iteration, paid organic search initiative, display advertising analysis, email marketing, trial drip campaign, a b message testing, conversion initiative, onboarding optimization, social media, influencer outreach program, social media initiative.
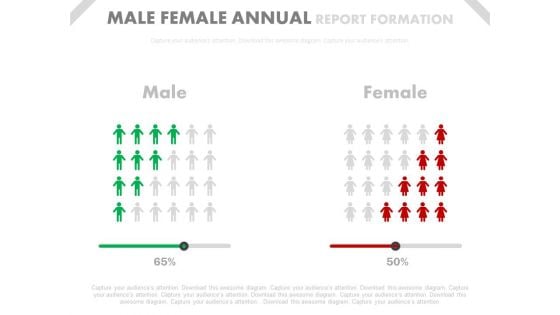
Male Female Ratio Comparison Chart Powerpoint Slides
This PowerPoint template has been designed with graphics of comparison chart. You may download this PPT slide to depict male female ratio comparison chart. Add this slide to your presentation and impress your superiors.
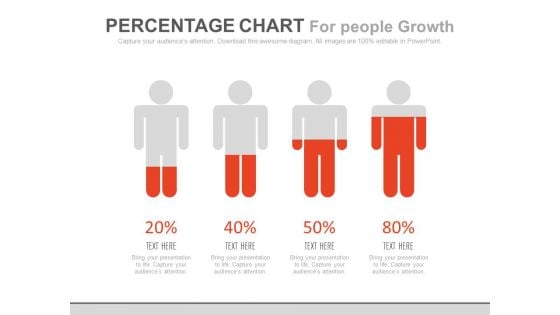
Percentage Chart For Personal Growth Powerpoint Slides
This PowerPoint template has been designed with four men icons with percentage ratios. You may download this diagram slide to depict personal growth. Add this PPT slide to your presentation and impress your superiors.
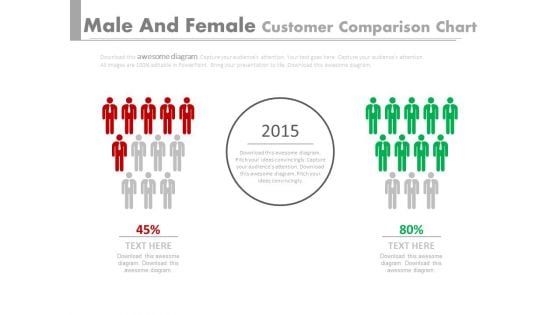
Red Green Teams Comparison Chart Powerpoint Slides
This PPT slide displays graphics of two red and green teams. Use this PPT design to display comparison of teams performances. This PowerPoint template can be customized as per requirements of business education or any other theme.
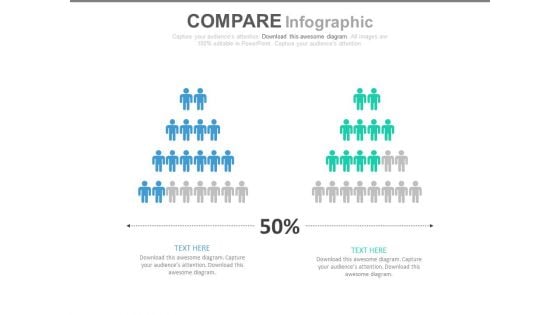
Two Teams Performance Analysis Chart Powerpoint Slides
This PowerPoint template has been designed with icons of two teams with percentage values. Download this PPT slide to depict team?s performance analysis. Deliver amazing presentations to mesmerize your audience by using this PPT slide design.
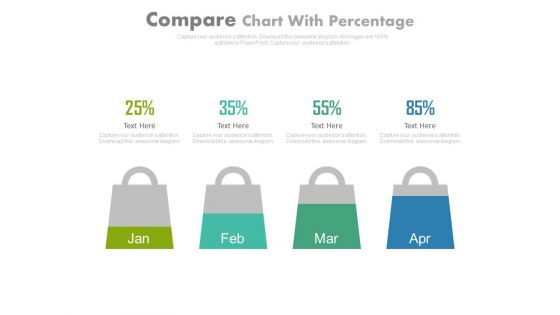
Four Months Sales Statistics Chart Powerpoint Slides
This PowerPoint template has been designed with four shopping bags with percentage values. Download this PPT slide to display four months sales statistics. Add this slide to your presentation and impress your superiors.
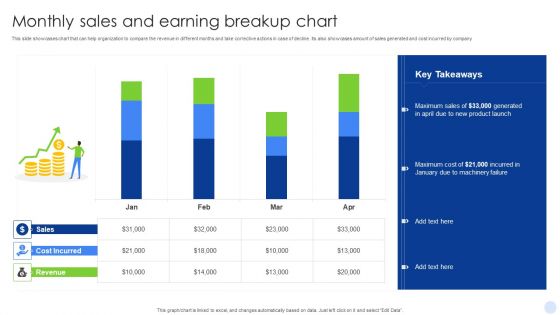
Monthly Sales And Earning Breakup Chart Clipart PDF
This slide showcases chart that can help organization to compare the revenue in different months and take corrective actions in case of decline. Its also showcases amount of sales generated and cost incurred by company. Showcasing this set of slides titled Monthly Sales And Earning Breakup Chart Clipart PDF. The topics addressed in these templates are New Product Launch, Machinery Failure. All the content presented in this PPT design is completely editable. Download it and make adjustments in color, background, font etc. as per your unique business setting.
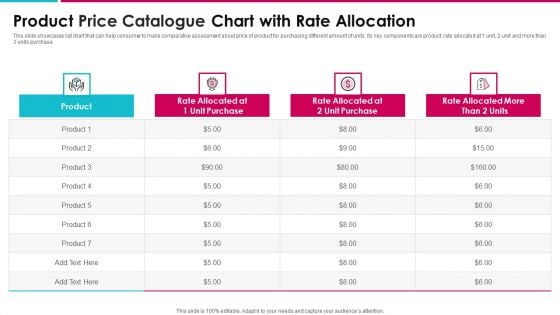
Product Price Catalogue Chart With Rate Allocation Infographics PDF
This slide showcases list chart that can help consumer to make comparative assessment about price of product for purchasing different amount of units. Its key components are product, rate allocated at 1 unit, 2 unit and more than 3 units purchase Pitch your topic with ease and precision using this product price catalogue chart with rate allocation infographics pdf. This layout presents information on product price catalogue chart with rate allocation. It is also available for immediate download and adjustment. So, changes can be made in the color, design, graphics or any other component to create a unique layout.

Price Catalogue Chart For Supplier Services Assessment Inspiration PDF
This slide showcases price catalogue chart that can help organization to make comparative assessment of transportation and warehousing costs of different suppliers. It also outlines cost per unit comparison of raw materials of Showcasing this set of slides titled price catalogue chart for supplier services assessment inspiration pdf. The topics addressed in these templates are price catalogue chart for supplier services assessment. All the content presented in this PPT design is completely editable. Download it and make adjustments in color, background, font etc. as per your unique business setting.

Comparison Chart For Performance Analysis Ppt Design
This is a comparison chart for performance analysis ppt design. This is a two stage process. The stages in this process are compare, scale, measurement, business, marketing.
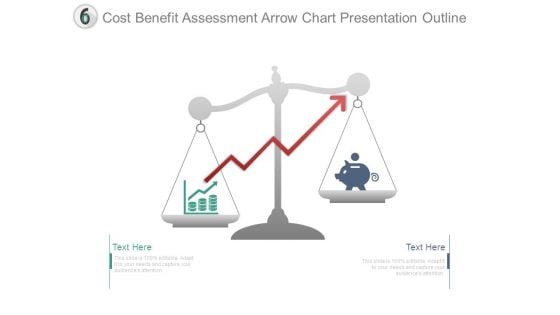
Cost Benefit Assessment Arrow Chart Presentation Outline
This is a cost benefit assessment arrow chart presentation outline. This is a two stage process. The stages in this process are compare, arrows, finance, money, strategy.
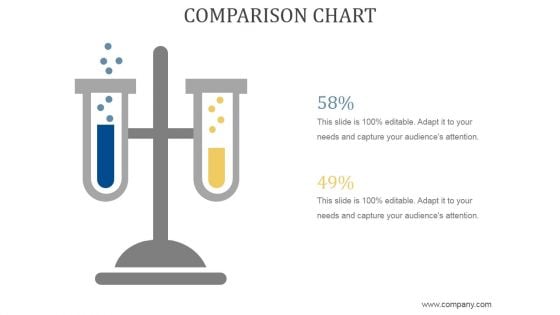
Comparison Chart Ppt PowerPoint Presentation Show
This is a comparison chart ppt powerpoint presentation show. This is a two stage process. The stages in this process are business, strategy, marketing, analysis, growth strategy, compare.
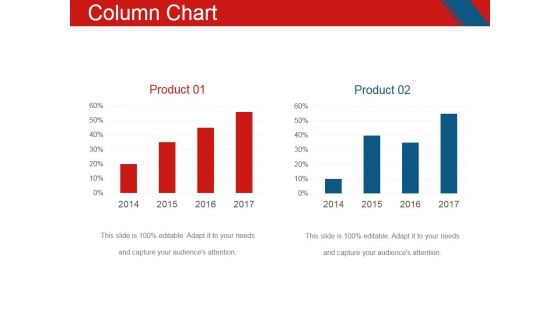
Column Chart Ppt PowerPoint Presentation Portfolio Designs
This is a column chart ppt powerpoint presentation portfolio designs. This is a two stage process. The stages in this process are business, marketing, timeline, growth, compare.
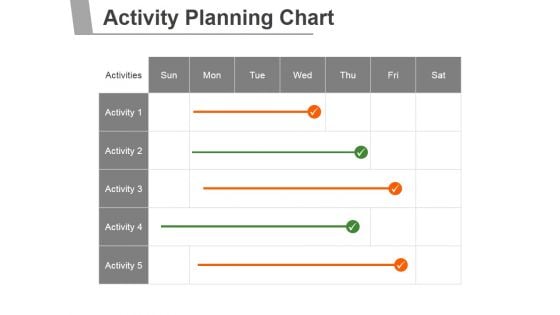
Activity Planning Chart Ppt PowerPoint Presentation Shapes
This is a activity planning chart ppt powerpoint presentation shapes. This is a seven stage process. The stages in this process are business, marketing, management, chart, planning.
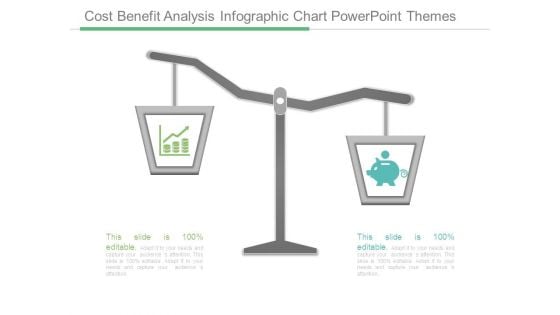
Cost Benefit Analysis Infographic Chart Powerpoint Themes
This is a cost benefit analysis infographic chart powerpoint themes. This is a two stage process. The stages in this process are balance, icons, finance, strategy, business.
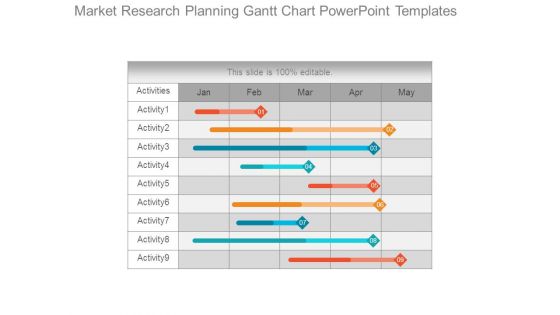
Market Research Planning Gantt Chart Powerpoint Templates
This is a market research planning gantt chart powerpoint templates. This is a five stage process. The stages in this process are jan, feb, mar, apr, may.
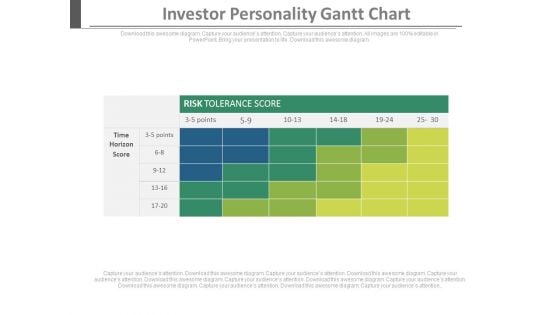
Investor Personality Gantt Chart Ppt Slides
This is an investor personality gantt chart ppt slides. This is a one stage process. The stages in this process are marketing, business, success.
What If Modelling Table Chart Ppt Slides
This is a what if modelling table chart ppt slides. This is a one stage process. The stages in this process are business, success, marketing.
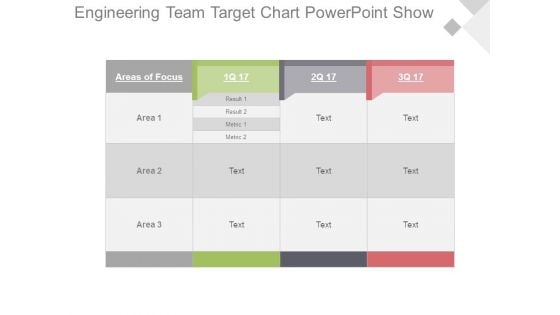
Engineering Team Target Chart Powerpoint Show
This is a engineering team target chart powerpoint show. This is a four stage process. The stages in this process are areas of focus, result, metric, area.
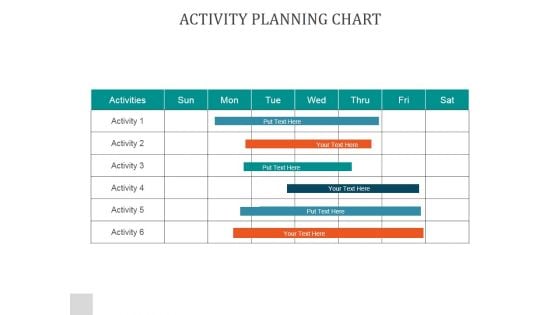
Activity Planning Chart Ppt PowerPoint Presentation Designs
This is a activity planning chart ppt powerpoint presentation designs. This is a seven stage process. The stages in this process are sun, mon, tue, wed, thru, fri, sat.
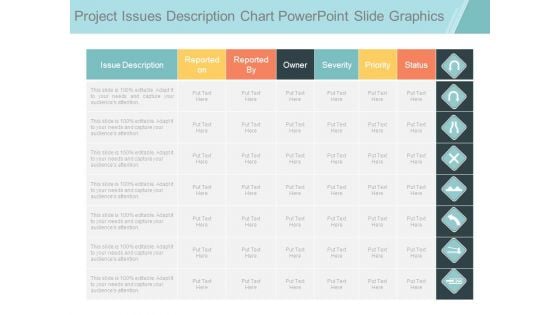
Project Issues Description Chart Powerpoint Slide Graphics
This is a project issues description chart powerpoint slide graphics. This is a seven stage process. The stages in this process are issue description, reported on, reported by, owner, severity, priority, status.

Project Issues Infogarphic Chart Ppt Examples Slides
This is a project issues infogarphic chart ppt examples slides. This is a seven stage process. The stages in this process are issue description, reported on, reported by, owner, severity, priority, status.
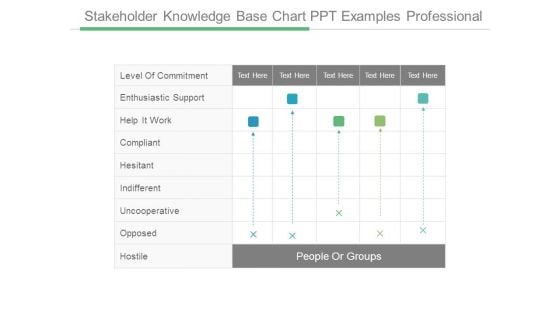
Stakeholder Knowledge Base Chart Ppt Examples Professional
This is a stakeholder knowledge base chart ppt examples professional. This is a five stage process. The stages in this process are people or groups, level of commitment, enthusiastic support, help it work, compliant, hesitant, indifferent, uncooperative, opposed, hostile.
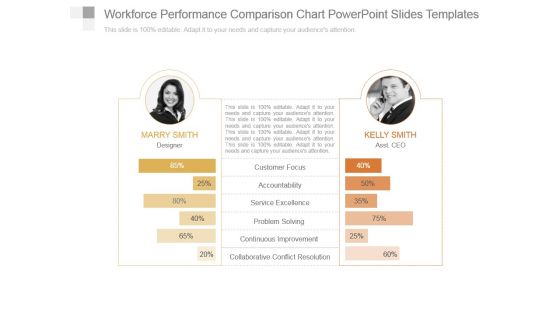
Workforce Performance Comparison Chart Powerpoint Slides Templates
This is a workforce performance comparison chart powerpoint slides templates. This is a two stage process. The stages in this process are customer focus, accountability, service excellence, problem solving, continuous improvement, collaborative conflict resolution.
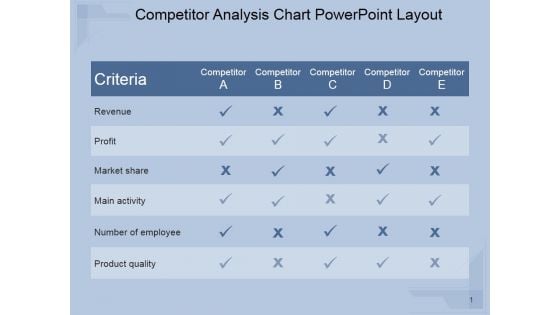
Competitor Analysis Chart Ppt PowerPoint Presentation Visuals
This is a competitor analysis chart ppt powerpoint presentation visuals. This is a five stage process. The stages in this process are revenue, profit, market share, main activity, number of employee, product quality.
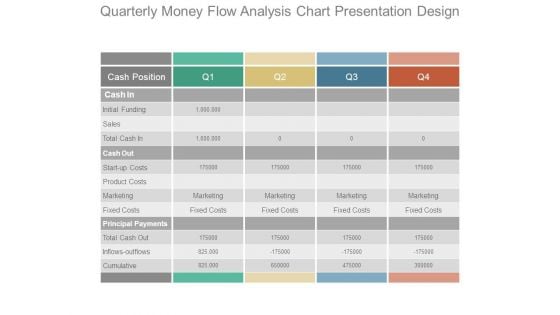
Quarterly Money Flow Analysis Chart Presentation Design
This is a quarterly money flow analysis chart presentation design. This is a four stage process. The stages in this process are cash position, cash in, initial funding, sales, total cash in, cash out, start up costs, product costs, marketing, fixed costs, principal payments, total cash out, inflows outflows, cumulative.
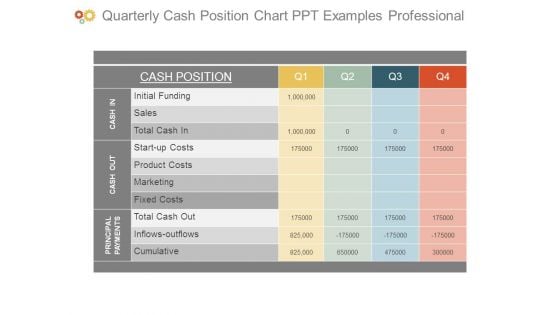
Quarterly Cash Position Chart Ppt Examples Professional
This is a quarterly cash position chart ppt examples professional. This is a four stage process. The stages in this process are cash position, initial funding, sales, total cash in, start up costs, product costs, marketing, fixed costs, total cash out, inflows outflows, cumulative, cash in, cash out, principal payments.
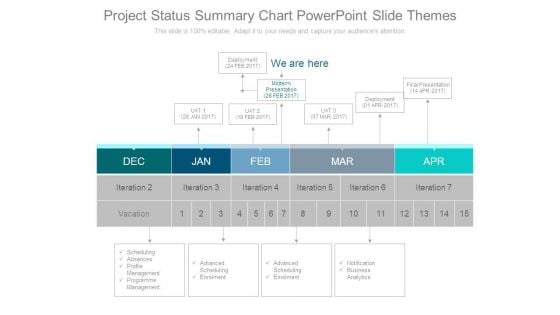
Project Status Summary Chart Powerpoint Slide Themes
This is a project status summary chart powerpoint slide themes. This is a five stage process. The stages in this process are deployment 24 feb 2017, we are here, midterm presentation 28 feb 2017, uat 1 28 jan 2017, uat 2 18 feb 2017, uat 3 07 mar 2017, deployment 01 apr 2017, final presentation 14 apr 2017, dec, jan, feb, mar, apr, iteration, scheduling absences profile management programme management, vacation, advanced scheduling enrolment, advanced scheduling enrolment, notification business analytics.
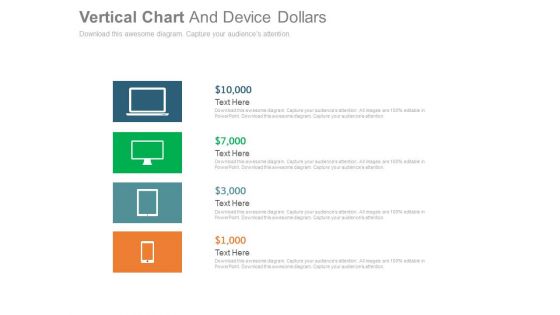
Computer Development And Generation Chart Powerpoint Slides
This PPT slide displays graphics of computer devices. Use this PPT design to display technology development and generation. This PowerPoint template can be customized as per requirements of business education or any other theme.

Comparative Analysis Of Stakeholder Engagement And Management Interest And Power Diagrams PDF
This slide exhibits comparative assessment chart for stakeholder interest and power. It cover employees, suppliers, customers, monitoring group and media. Showcasing this set of slides titled Comparative Analysis Of Stakeholder Engagement And Management Interest And Power Diagrams PDF. The topics addressed in these templates are Stakeholder, Interest, Non Market. All the content presented in this PPT design is completely editable. Download it and make adjustments in color, background, font etc. as per your unique business setting.
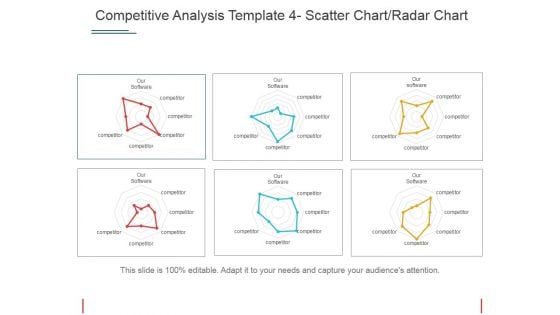
Competitive Analysis Scatter Chart Radar Chart Ppt PowerPoint Presentation Portfolio Templates
This is a competitive analysis scatter chart radar chart ppt powerpoint presentation portfolio templates. This is a eight stage process. The stages in this process are users interface, data import, example, pricing, support.
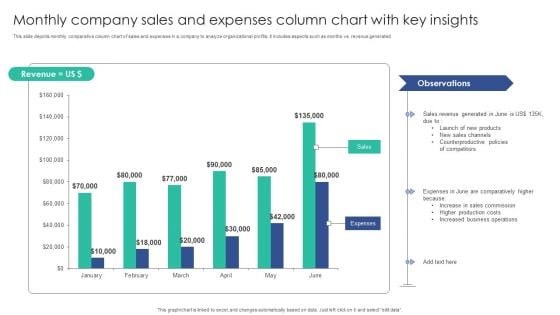
Monthly Company Sales And Expenses Column Chart With Key Insights Mockup PDF
This slide depicts monthly comparative column chart of sales and expenses in a company to analyze organizational profits. It includes aspects such as months vs. revenue generatedPitch your topic with ease and precision using this Monthly Company Sales And Expenses Column Chart With Key Insights Mockup PDF. This layout presents information on Sales Channels, Counterproductive Policies, Sales Commission. It is also available for immediate download and adjustment. So, changes can be made in the color, design, graphics or any other component to create a unique layout.
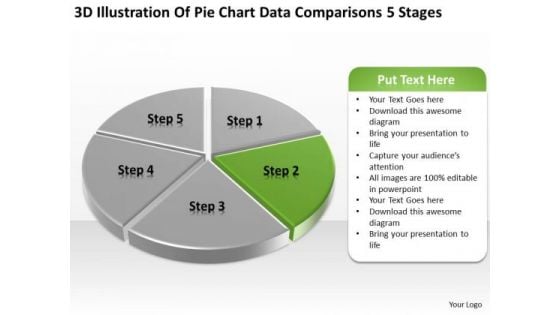
Pie Chart Data Comparisons 5 Stages Business Plan PowerPoint Templates
We present our pie chart data comparisons 5 stages business plan PowerPoint templates.Download and present our Marketing PowerPoint Templates because Our PowerPoint Templates and Slides offer you the widest possible range of options. Use our Finance PowerPoint Templates because You should Ascend the ladder of success with ease. Our PowerPoint Templates and Slides will provide strong and sturdy steps. Download and present our Business PowerPoint Templates because You should Throw the gauntlet with our PowerPoint Templates and Slides. They are created to take up any challenge. Present our Sales PowerPoint Templates because Our PowerPoint Templates and Slides help you pinpoint your timelines. Highlight the reasons for your deadlines with their use. Present our Success PowerPoint Templates because It will Raise the bar of your Thoughts. They are programmed to take you to the next level.Use these PowerPoint slides for presentations relating to Analysis, Analyzing, Brands, Business, Chart, Colorful, Commerce, Compare, Comparison, Data, Economical, Finance, Financial, Grow, Growth, Market, Market Share, Marketing, Measure, Pen, Pie, Pie Chart, Presentation, Profit, Revenue, Sales, Sales Chat, Sales Increase, Share, Statistical, Success, Successful. The prominent colors used in the PowerPoint template are Green, Gray, White. Our Pie Chart Data Comparisons 5 Stages Business Plan PowerPoint Templates are experts in convincing the crowd. They will be greatly assured by your ideas.
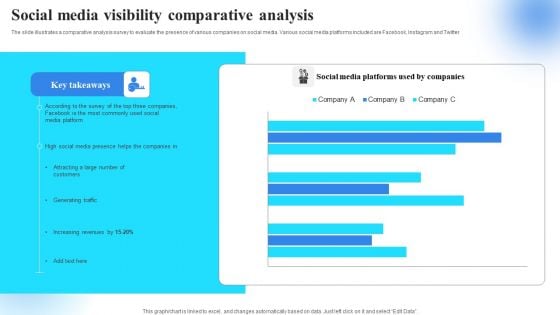
Social Media Visibility Comparative Analysis Brochure PDF
The slide illustrates a comparative analysis survey to evaluate the presence of various companies on social media. Various social media platforms included are Facebook, Instagram and Twitter Pitch your topic with ease and precision using this Social Media Visibility Comparative Analysis Brochure PDF. This layout presents information on YYYYYYYYYYYYYYYYYYYYYYYYYYYYYYYYYYYYYYYYY. It is also available for immediate download and adjustment. So, changes can be made in the color, design, graphics or any other component to create a unique layout.
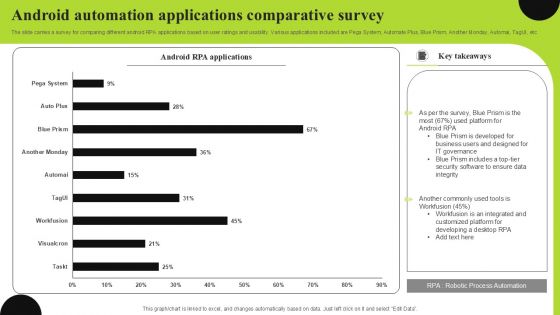
Android Automation Applications Comparative Survey Pictures PDF
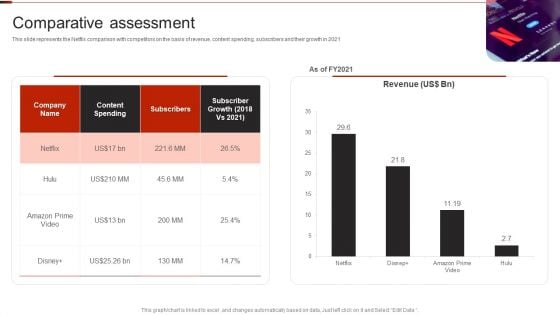
Netflix Company Outline Comparative Assessment Inspiration PDF
This slide represents the Netflix comparison with competitors on the basis of revenue, content spending, subscribers and their growth in 2021.Deliver an awe inspiring pitch with this creative Netflix Company Outline Comparative Assessment Inspiration PDF bundle. Topics like Content Spending, Subscriber Growth, Amazon Video can be discussed with this completely editable template. It is available for immediate download depending on the needs and requirements of the user.
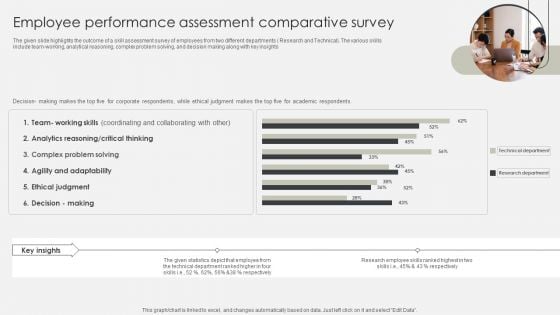
Employee Performance Assessment Comparative Survey Ideas PDF
The given slide highlights the outcome of a skill assessment survey of employees from two different departments Research and Technical. The various skills include team-working, analytical reasoning, complex problem solving, and decision making along with key insights. Pitch your topic with ease and precision using this Employee Performance Assessment Comparative Survey Ideas PDF. This layout presents information on Agility And Adaptability, Team, Research Department. It is also available for immediate download and adjustment. So, changes can be made in the color, design, graphics or any other component to create a unique layout.
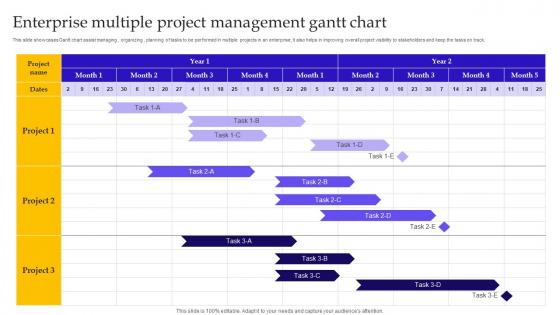
Enterprise Multiple Project Management Gantt Chart Elements Pdf
This slide showcases Gantt chart assist managing, organizing, planning of tasks to be performed in multiple projects in an enterprise, it also helps in improving overall project visibility to stakeholders and keep the tasks on track. Showcasing this set of slides titled Enterprise Multiple Project Management Gantt Chart Elements Pdf. The topics addressed in these templates are Enterprise Multiple Project, Management Gantt Chart, Planning Of Tasks. All the content presented in this PPT design is completely editable. Download it and make adjustments in color, background, font etc. as per your unique business setting. This slide showcases Gantt chart assist managing, organizing, planning of tasks to be performed in multiple projects in an enterprise, it also helps in improving overall project visibility to stakeholders and keep the tasks on track.
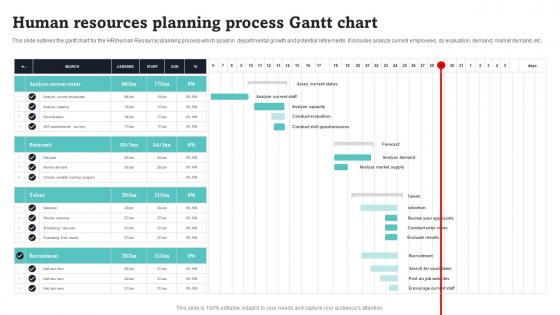
Human Resources Planning Process Gantt Chart Portrait Pdf
This slide outlines the gantt chart for the HRhuman Resource planning process which assist in departmental growth and potential retirements. It includes analyze current employees, do evaluation, demand, market demand, etc. Pitch your topic with ease and precision using this Human Resources Planning Process Gantt Chart Portrait Pdf. This layout presents information on Analyze Current Status, Forecast, Talent. It is also available for immediate download and adjustment. So, changes can be made in the color, design, graphics or any other component to create a unique layout. This slide outlines the gantt chart for the HRhuman Resource planning process which assist in departmental growth and potential retirements. It includes analyze current employees, do evaluation, demand, market demand, etc.
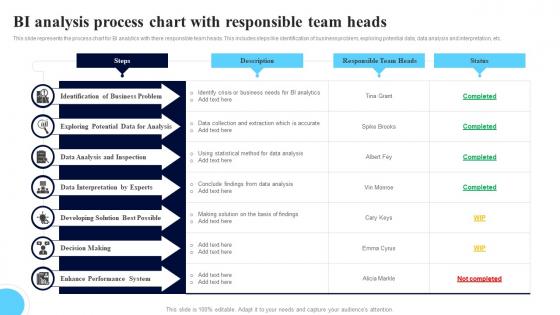
BI Analysis Process Chart With Responsible Team Heads Mockup Pdf
This slide represents the process chart for BI analytics with there responsible team heads. This includes steps like identification of business problem, exploring potential data, data analysis and interpretation, etc. Showcasing this set of slides titled BI Analysis Process Chart With Responsible Team Heads Mockup Pdf. The topics addressed in these templates are Identification Of Business, Data Analysis, Data Interpretation. All the content presented in this PPT design is completely editable. Download it and make adjustments in color, background, font etc. as per your unique business setting. This slide represents the process chart for BI analytics with there responsible team heads. This includes steps like identification of business problem, exploring potential data, data analysis and interpretation, etc.

SAP Implementation Process Gantt Chart Ppt Slides Sample Pdf
This slide represents the timeline or Gantt chart of the SAP implementation process. It further includes various stages of process such as build team and identify business goal, evaluate business process, implement business blueprint, etc. Pitch your topic with ease and precision using this SAP Implementation Process Gantt Chart Ppt Slides Sample Pdf. This layout presents information on Business Goal, Evaluate Business Process, Implement Business Blueprint. It is also available for immediate download and adjustment. So, changes can be made in the color, design, graphics or any other component to create a unique layout. This slide represents the timeline or Gantt chart of the SAP implementation process. It further includes various stages of process such as build team and identify business goal, evaluate business process, implement business blueprint, etc.
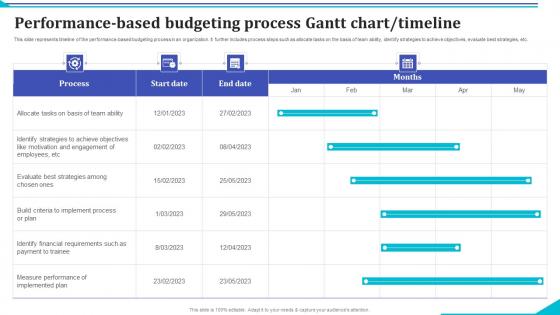
Performance Based Budgeting Process Gantt Chart Timeline Rules Pdf
This slide represents timeline of the performance based budgeting process in an organization. It further includes process steps such as allocate tasks on the basis of team ability, identify strategies to achieve objectives, evaluate best strategies, etc.Showcasing this set of slides titled Performance Based Budgeting Process Gantt Chart Timeline Rules Pdf The topics addressed in these templates are Build Criteria, Implement Process, Identify Financial Requirements, Payment Trainee All the content presented in this PPT design is completely editable. Download it and make adjustments in color, background, font etc. as per your unique business setting. This slide represents timeline of the performance based budgeting process in an organization. It further includes process steps such as allocate tasks on the basis of team ability, identify strategies to achieve objectives, evaluate best strategies, etc.
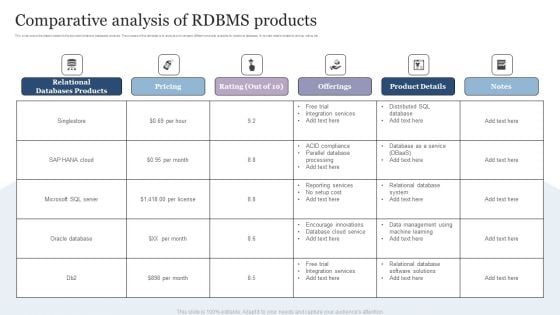
Comparative Analysis Of RDBMS Products Themes PDF
This slide covers the details related to the top rated relational databases products. The purpose of this template is to analyze and compare different products available for relational database. It includes details related to pricing, rating, etc. Pitch your topic with ease and precision using this Comparative Analysis Of RDBMS Products Themes PDF. This layout presents information on Relational, Databases Products, Product Details. It is also available for immediate download and adjustment. So, changes can be made in the color, design, graphics or any other component to create a unique layout.


 Continue with Email

 Home
Home


