Compare Chart
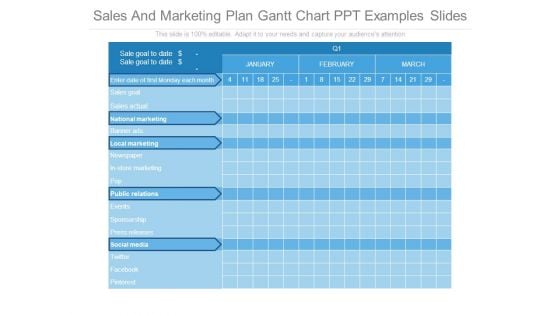
Sales And Marketing Plan Gantt Chart Ppt Examples Slides
This is a sales and marketing plan gantt chart ppt examples slides. This is a three stage process. The stages in this process are sales goal, sales actual, banner ads, newspaper, in store marketing.
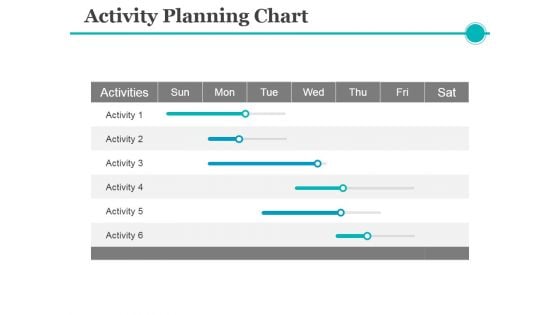
Activity Planning Chart Ppt PowerPoint Presentation Visual Aids Model
This is a activity planning chart ppt powerpoint presentation visual aids model. This is a six stage process. The stages in this process are activities, business, management, table, planning.
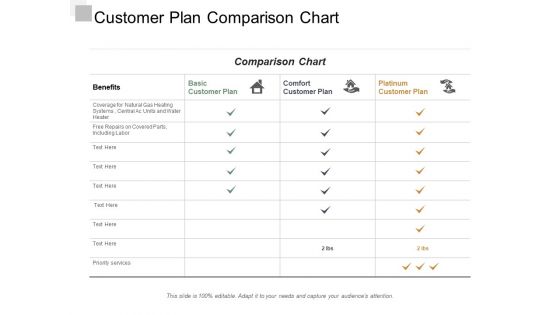
Customer Plan Comparison Chart Ppt Powerpoint Presentation Infographic Template Portrait
This is a customer plan comparison chart ppt powerpoint presentation infographic template portrait. This is a four stage process. The stages in this process are customer service strategy, customer service plan, customer service approach.
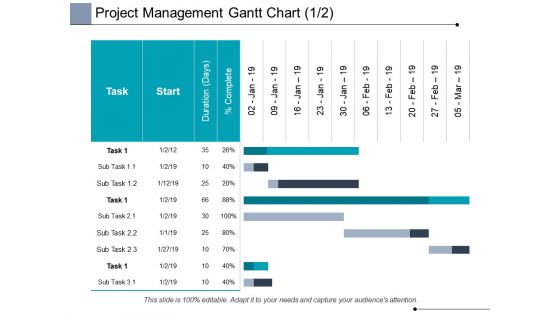
Project Management Gantt Chart Planning Ppt PowerPoint Presentation Visuals
This is a project management gantt chart planning ppt powerpoint presentation visuals. This is a three stage process. The stages in this process are business, planning, strategy, marketing, management.
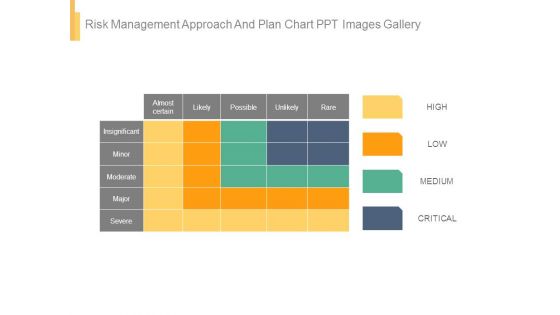
Risk Management Approach And Plan Chart Ppt Images Gallery
This is a risk management approach and plan chart ppt images gallery. This is a four stage process. The stages in this process are almost certain, likely, possible, unlikely, rare, insignificant, minor, moderate, major, severe, high, low, medium, critical.
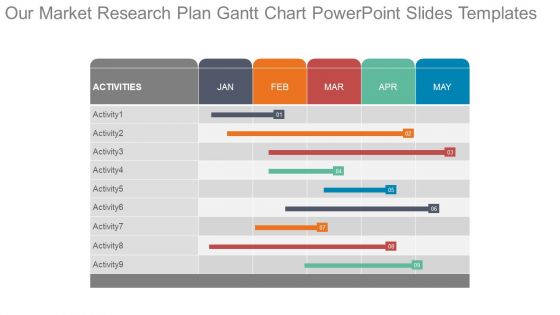
Our Market Research Plan Gantt Chart Powerpoint Slides Templates
This is a our market research plan gantt chart powerpoint slides templates. This is a nine stage process. The stages in this process are activities, jan, feb, mar, apr, may.
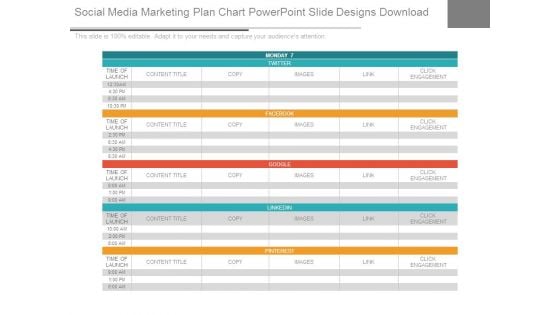
Social Media Marketing Plan Chart Powerpoint Slide Designs Download
This is a social media marketing plan chart powerpoint slide designs download. This is a five stage process. The stages in this process are content title, copy, images, link, click engagement.
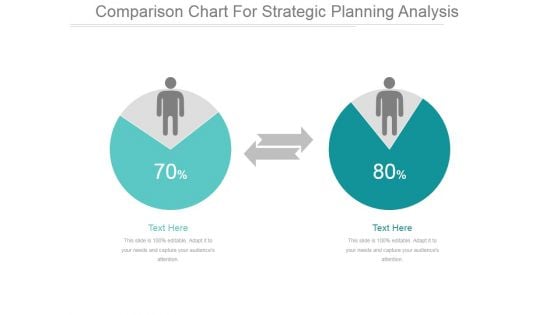
Comparison Chart For Strategic Planning Analysis Ppt PowerPoint Presentation Example
This is a comparison chart for strategic planning analysis ppt powerpoint presentation example. This is a two stage process. The stages in this process are business, finance, marketing, strategy, success.
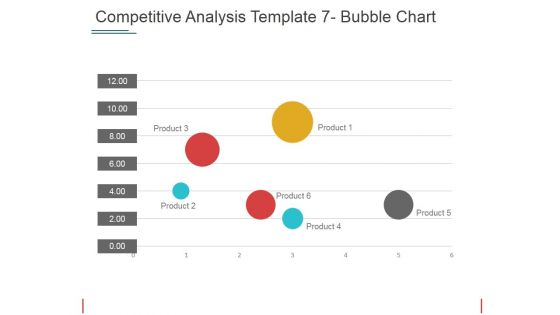
Competitive Analysis Bubble Chart Ppt PowerPoint Presentation Pictures Mockup
This is a competitive analysis bubble chart ppt powerpoint presentation pictures mockup. This is a six stage process. The stages in this process are product, table, business, marketing, management.

Donut Pie Chart Ppt PowerPoint Presentation Infographics Outfit
This is a donut pie chart ppt powerpoint presentation infographics outfit. This is a three stage process. The stages in this process are business, strategy, analysis, planning, dashboard, finance.
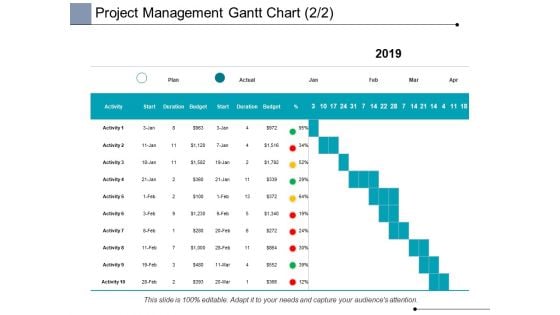
Project Management Gantt Chart Business Ppt PowerPoint Presentation Portfolio
This is a project management gantt chart business ppt powerpoint presentation portfolio. This is a four stage process. The stages in this process are business, planning, strategy, marketing, management.
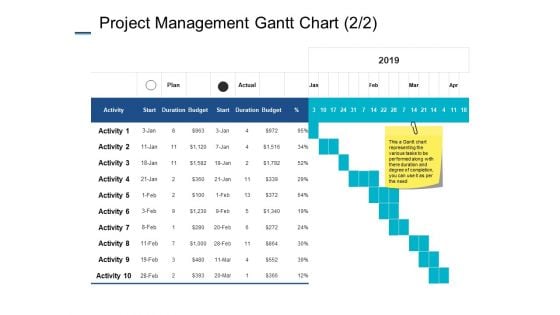
Project Management Gantt Chart Marketing Ppt PowerPoint Presentation Styles Files
This is a project management gantt chart marketing ppt powerpoint presentation styles files. This is a two stage process. The stages in this process are business, planning, strategy, marketing, management.
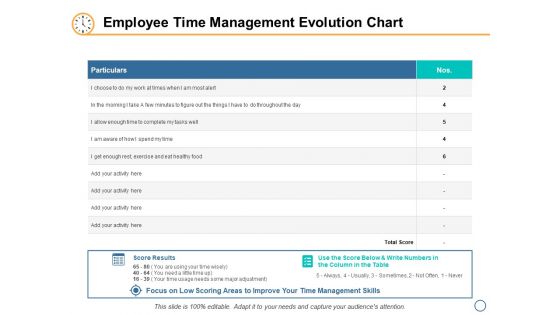
Employee Time Management Evolution Chart Ppt PowerPoint Presentation Slides Outfit
This is a employee time management evolution chart ppt powerpoint presentation slides outfit. This is a two stage process. The stages in this process are business, planning, strategy, marketing, management.
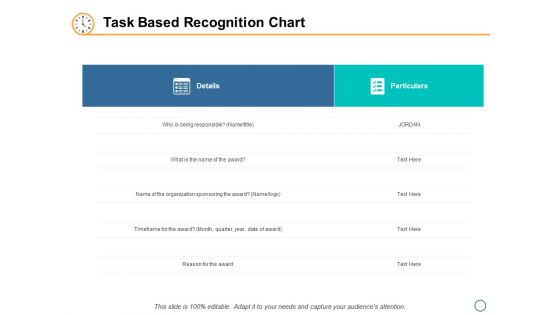
Task Based Recognition Chart Ppt PowerPoint Presentation Inspiration Vector
This is a task based recognition chart ppt powerpoint presentation inspiration vector. This is a two stage process. The stages in this process are business, planning, strategy, detail, particular.
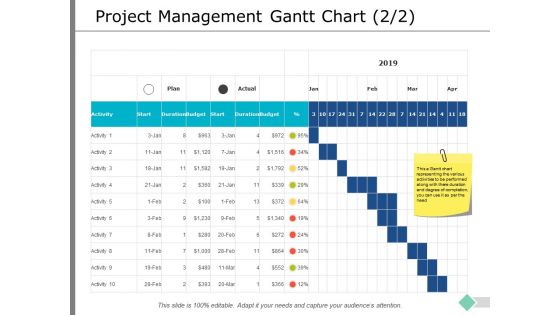
Project Management Gantt Chart Ppt PowerPoint Presentation Show Gridlines
This is a project management gantt chart ppt powerpoint presentation show gridlines. This is a two stage process. The stages in this process are business, planning, strategy, marketing, management.
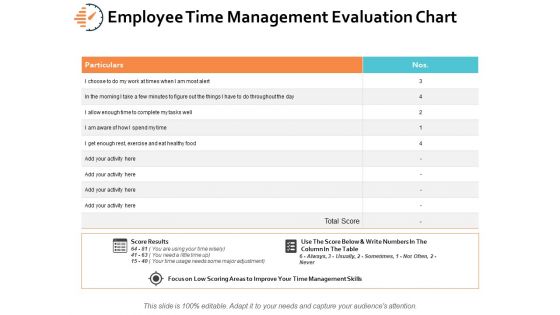
Employee Time Management Evaluation Chart Ppt PowerPoint Presentation Outline Guidelines
This is a employee time management evaluation chart ppt powerpoint presentation outline guidelines. This is a two stage process. The stages in this process are business, planning, strategy, marketing, management.
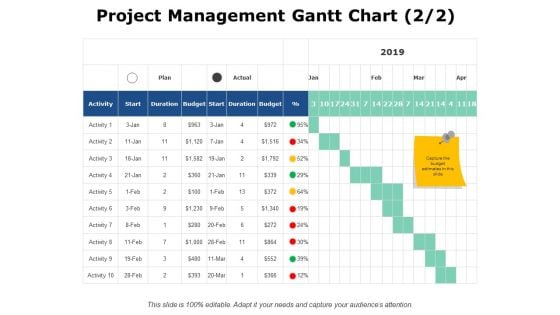
Project Management Gantt Chart Finance Ppt PowerPoint Presentation Infographics Files
This is a project management gantt chart finance ppt powerpoint presentation infographics files. This is a six stage process. The stages in this process are business, planning, strategy, marketing, management.
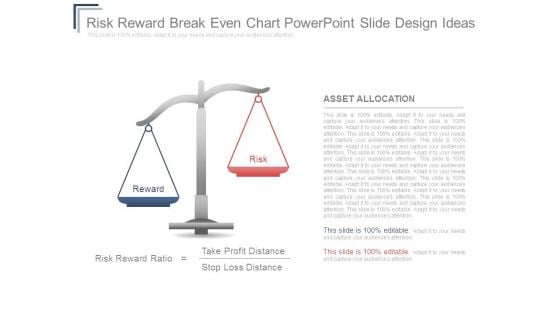
Risk Reward Breakeven Chart Powerpoint Slide Design Ideas
This is a risk reward breakeven chart powerpoint slide design ideas. This is a two stage process. The stages in this process are reward, risk, asset allocation, risk reward ratio, take profit distance, stop loss distance.

Expected Return And Variance Chart Powerpoint Slide Deck Template
This is a expected return and variance chart powerpoint slide deck template. This is a one stage process. The stages in this process are investment reward, reward matrix, high, med, low.
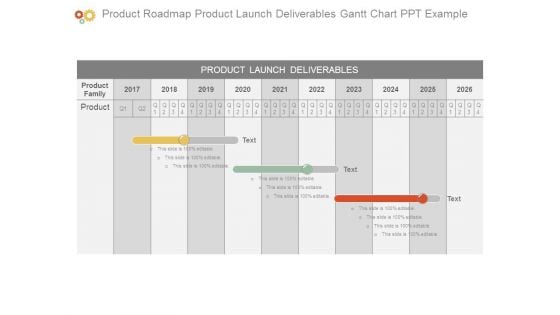
Product Roadmap Product Launch Deliverables Gantt Chart Ppt Example
This is a product roadmap product launch deliverables gantt chart ppt example. This is a three stage process. The stages in this process are product launch deliverables, product family, product.
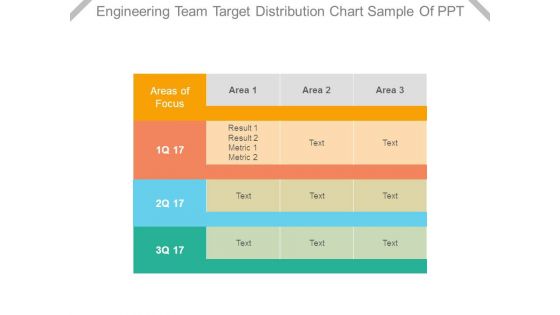
Engineering Team Target Distribution Chart Sample Of Ppt
This is a engineering team target distribution chart sample of ppt. This is a three stage process. The stages in this process are areas of focus, area, result, metric.
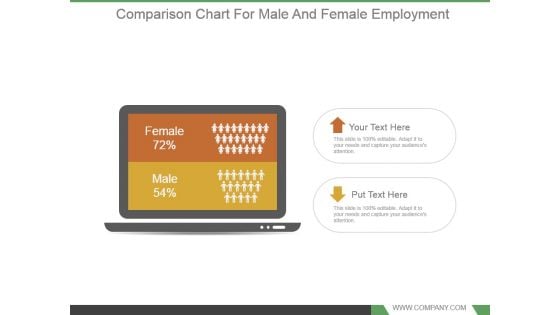
Comparison Chart For Male And Female Employment Powerpoint Shapes
This is a comparison chart for male and female employment powerpoint shapes. This is a two stage process. The stages in this process are female 72 percent, male 54 percent.
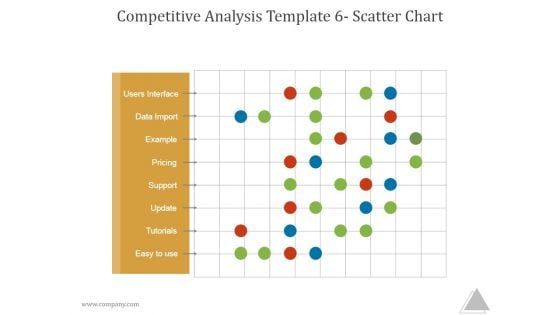
Competitive Analysis Template 6 Scatter Chart Ppt PowerPoint Presentation Shapes
This is a competitive analysis template 6 scatter chart ppt powerpoint presentation shapes. This is a one stage process. The stages in this process are users interface, data import, example, pricing, support update, tutorials, easy to use.
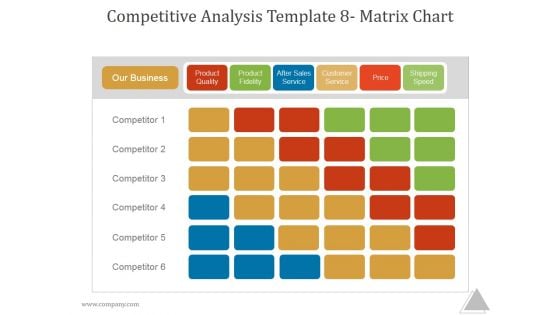
Competitive Analysis Template 8 Matrix Chart Ppt PowerPoint Presentation Templates
This is a competitive analysis template 8 matrix chart ppt powerpoint presentation templates. This is a six stage process. The stages in this process are our business, product quality, product fidelity, after sales service, customer service, price, shipping speed, competitor.
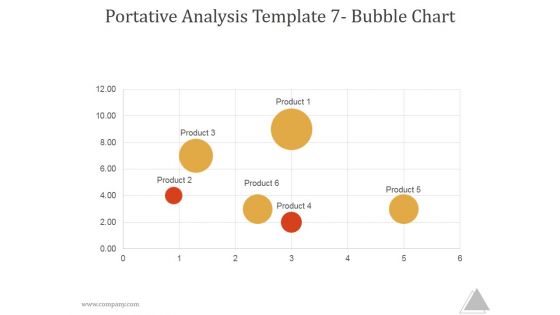
Portative Analysis Template 7 Bubble Chart Ppt PowerPoint Presentation Picture
This is a portative analysis template 7 bubble chart ppt powerpoint presentation picture. This is a six stage process. The stages in this process are product, business, marketing, management.
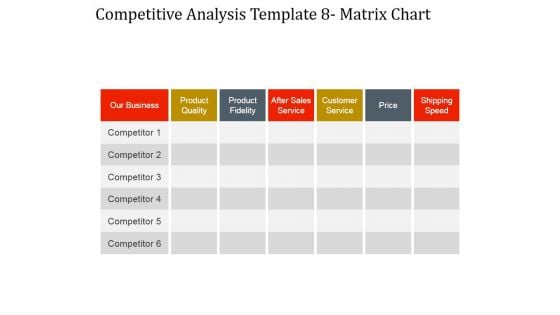
Competitive Analysis Matrix Chart Ppt PowerPoint Presentation Gallery
This is a competitive analysis matrix chart ppt powerpoint presentation gallery. This is a seven stage process. The stages in this process are our business, product quality, product fidelity, after sales service, customer service, price, shipping speed.
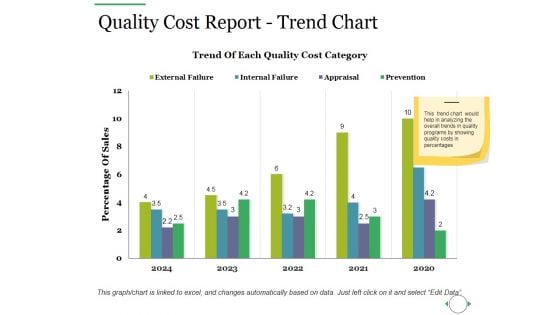
Quality Cost Report Trend Chart Ppt PowerPoint Presentation Outline Guidelines
This is a quality cost report trend chart ppt powerpoint presentation outline guidelines. This is a two stage process. The stages in this process are quality cost, appraisal cost, internal failure cost, external failure cost.
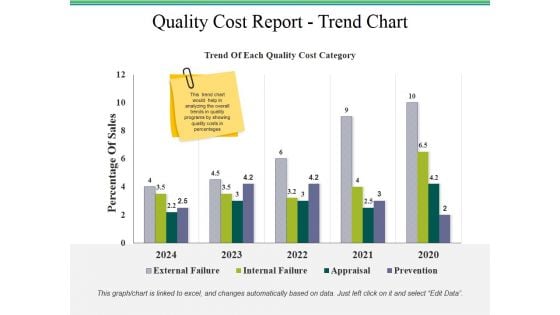
Quality Cost Report Trend Chart Ppt PowerPoint Presentation Styles Templates
This is a quality cost report trend chart ppt powerpoint presentation styles templates. This is a two stage process. The stages in this process are quality cost report, business, finance, marketing, strategy.
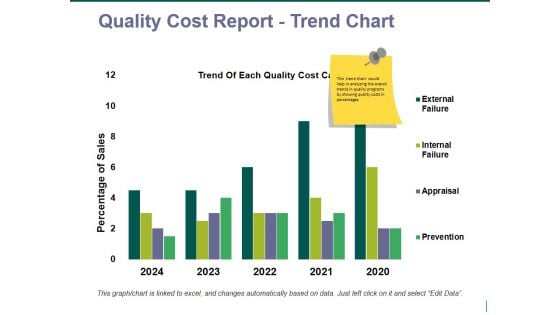
quality cost report trend chart ppt powerpoint presentation pictures vector
This is a quality cost report trend chart ppt powerpoint presentation pictures vector. This is a four stage process. The stages in this process are business, finance, marketing, strategy, analysis.
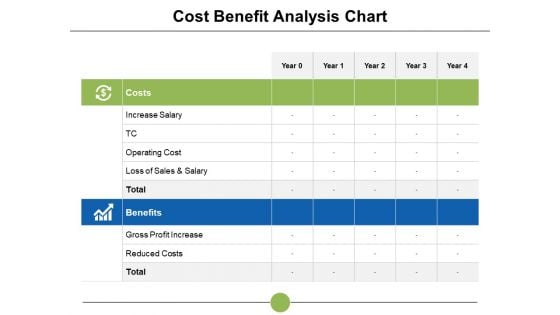
Cost Benefit Analysis Chart Ppt PowerPoint Presentation Slides Example File
This is a cost benefit analysis chart ppt powerpoint presentation slides example file. This is a two stage process. The stages in this process are increase salary, cost benefit, reduced costs, analysis, operating cost.
Cost Benefit Analysis Chart Ppt PowerPoint Presentation Ideas Shapes
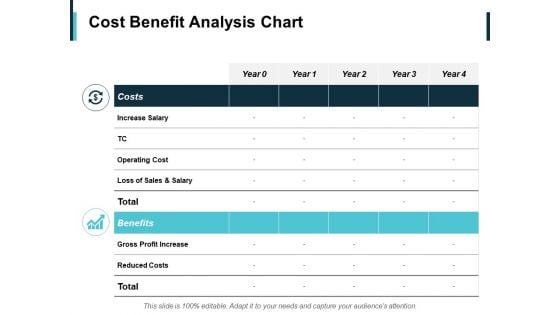
This is a cost benefit analysis chart ppt powerpoint presentation ideas shapes. This is a two stage process. The stages in this process are reduced costs, operating cost, benefits, costs, increase salary.
Project Management Gantt Chart Activity Ppt PowerPoint Presentation Inspiration Samples
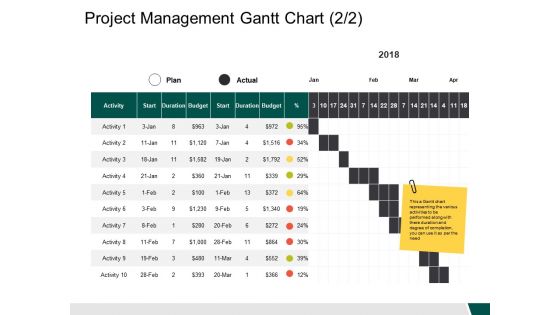
This is a project management gantt chart activity ppt powerpoint presentation inspiration samples. This is a ten stage process. The stages in this process are business, management, strategy, analysis, marketing.
Companies Comparison Chart Vector Icon Ppt PowerPoint Presentation Files PDF
Persuade your audience using this companies comparison chart vector icon ppt powerpoint presentation files pdf. This PPT design covers one stages, thus making it a great tool to use. It also caters to a variety of topics including companies comparison chart vector icon. Download this PPT design now to present a convincing pitch that not only emphasizes the topic but also showcases your presentation skills.
Official Team Collaboration Plan Organizational Chart Implementation Timeline Information PDF
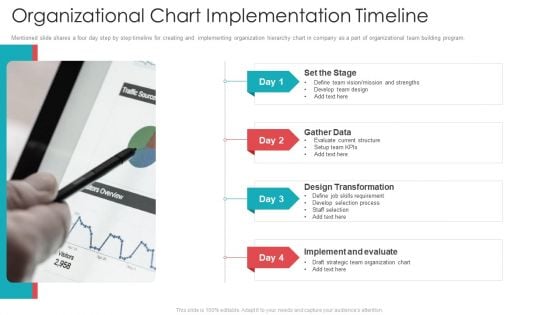
Mentioned slide shares a four day step by step timeline for creating and implementing organization hierarchy chart in company as a part of organizational team building program. This is a official team collaboration plan organizational chart implementation timeline information pdf template with various stages. Focus and dispense information on four stages using this creative set, that comes with editable features. It contains large content boxes to add your information on topics like implement and evaluate, design transformation. You can also showcase facts, figures, and other relevant content using this PPT layout. Grab it now.
Sales And Marketing Planning Chart Powerpoint Slide Designs Download
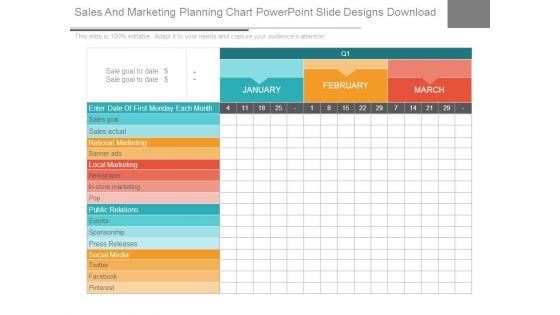
This is a sales and marketing planning chart powerpoint slide designs download. This is a three stage process. The stages in this process are sales goal, sales actual, national marketing, banner ads, local marketing, newspaper, in store marketing, pop, public relations, events, sponsorship, press releases, social media, twitter, facebook.

Financials Base Plan Table Chart Ppt Slide Templates
This is a financials base plan table chart ppt slide templates. This is a five stage process. The stages in this process are kpi, revenue, cost of sales, gross profit, customer acquisition cost, other operating cost expense, operating profit, change in cash, ending cash, employees ftes.
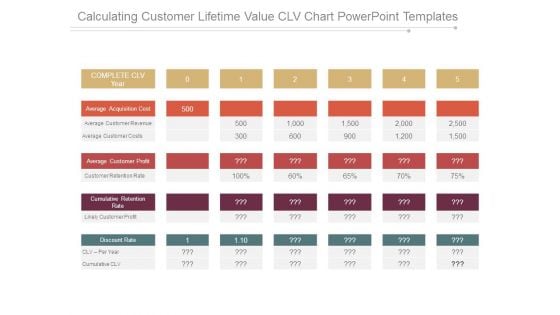
Calculating Customer Lifetime Value Clv Chart Powerpoint Templates
This is a calculating customer lifetime value clv chart powerpoint templates. This is a five stage process. The stages in this process are complete clv year, average acquisition cost, average customer revenue, average customer costs, average customer profit, customer retention rate, cumulative retention rate, likely customer profit, discount rate, clv per year, cumulative clv.
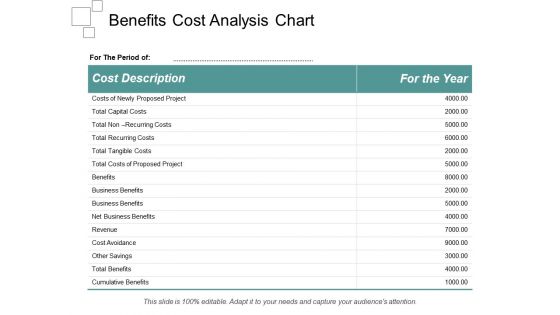
Benefits Cost Analysis Chart Ppt Powerpoint Presentation Summary Visuals
This is a balance scale with cost and benefits ppt powerpoint presentation show. This is a two stage process. The stages in this process are business, finance, marketing, strategy, compare, management.
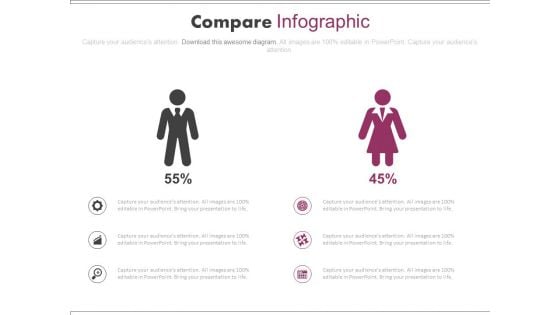
Male Female Employee Skill Assessment Chart Powerpoint Slides
Create visually stunning and define your PPT presentations in a unique and inspiring manner using our above template. It contains male female icons. This business slide helps for male female employee skill assessment. Grab the attention of your team with this eye catching template.
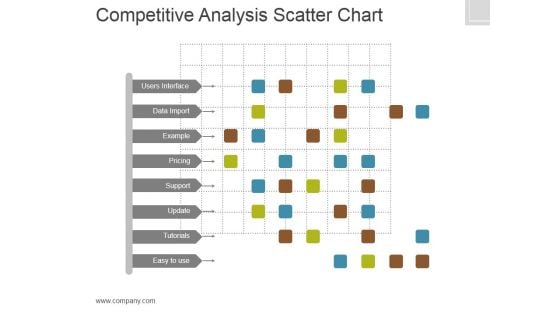
Competitive Analysis Template 6 Scatter Chart Ppt PowerPoint Presentation Slides
This is a competitive analysis template 6 scatter chart ppt powerpoint presentation slides. This is a eight stage process. The stages in this process are users interface, data import, example, pricing, support, update, tutorials, easy to use, table.
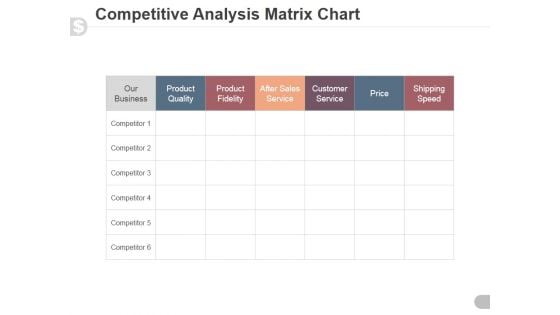
Competitive Analysis Matrix Chart Ppt PowerPoint Presentation Inspiration
This is a competitive analysis matrix chart ppt powerpoint presentation inspiration. This is a six stage process. The stages in this process are product quality, product fidelity, after sales service, customer service, price, shipping speed.
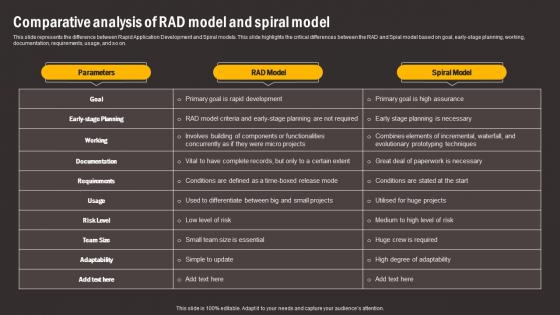
Comparative Analysis Of RAD Model And Spiral Comparing RAD And Other Software Formats Pdf
This slide represents the difference between Rapid Application Development and Spiral models. This slide highlights the critical differences between the RAD and Spial model based on goal, early-stage planning, working, documentation, requirements, usage, and so on. Create an editable Comparative Analysis Of RAD Model And Spiral Comparing RAD And Other Software Formats Pdf that communicates your idea and engages your audience. Whether you are presenting a business or an educational presentation, pre-designed presentation templates help save time. Comparative Analysis Of RAD Model And Spiral Comparing RAD And Other Software Formats Pdf is highly customizable and very easy to edit, covering many different styles from creative to business presentations. Slidegeeks has creative team members who have crafted amazing templates. So, go and get them without any delay. This slide represents the difference between Rapid Application Development and Spiral models. This slide highlights the critical differences between the RAD and Spial model based on goal, early-stage planning, working, documentation, requirements, usage, and so on.
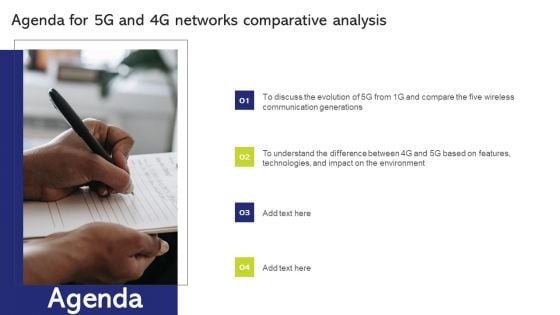
5G And 4G Networks Comparative Analysis Agenda For 5G And 4G Networks Comparative Analysis Summary PDF
Presenting 5G And 4G Networks Comparative Analysis Agenda For 5G And 4G Networks Comparative Analysis Summary PDF to provide visual cues and insights. Share and navigate important information on four stages that need your due attention. This template can be used to pitch topics like Communication Generations, Evolution, Environment. In addtion, this PPT design contains high resolution images, graphics, etc, that are easily editable and available for immediate download.
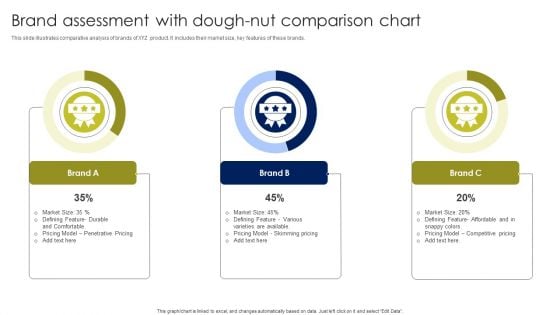
Brand Assessment With Dough Nut Comparison Chart Elements PDF
This slide illustrates comparative analysis of brands of XYZ product. It includes their market size, key features of these brands. Showcasing this set of slides titled Brand Assessment With Dough Nut Comparison Chart Elements PDF. The topics addressed in these templates are Penetrative Pricing, Skimming Pricing, Competitive Pricing. All the content presented in this PPT design is completely editable. Download it and make adjustments in color, background, font etc. as per your unique business setting.
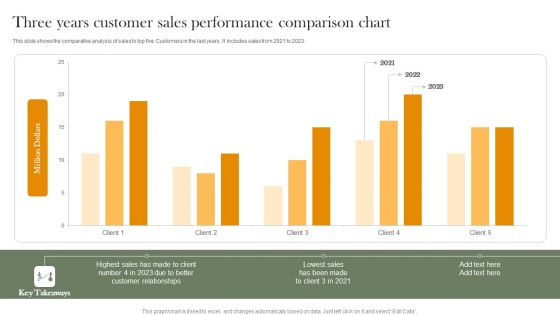
Three Years Customer Sales Performance Comparison Chart Professional PDF
This slide shows the comparative analysis of sales to top five Customers in the last years. It includes sales from 2021 to 2023. Pitch your topic with ease and precision using this Three Years Customer Sales Performance Comparison Chart Professional PDF. This layout presents information on Highest Sales, Customer Relationships, Lowest Sales. It is also available for immediate download and adjustment. So, changes can be made in the color, design, graphics or any other component to create a unique layout.
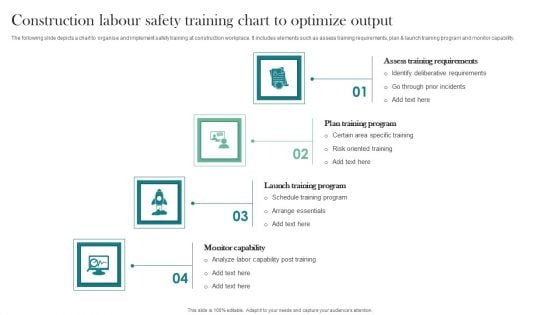
Construction Labour Safety Training Chart To Optimize Output Themes PDF
The following slide depicts a chart to organise and implement safety training at construction workplace. It includes elements such as assess training requirements, plan and launch training program and monitor capability. Persuade your audience using this Construction Labour Safety Training Chart To Optimize Output Themes PDF. This PPT design covers four stages, thus making it a great tool to use. It also caters to a variety of topics including Manufacturing Productivity, Construction Output, Comparative Analysis. Download this PPT design now to present a convincing pitch that not only emphasizes the topic but also showcases your presentation skills.
Project Management Gantt Chart Ppt PowerPoint Presentation Icon Images
This is a project management gantt chart ppt powerpoint presentation icon images. The topics discussed in this diagram are business, management, marketing, compare. This is a completely editable PowerPoint presentation, and is available for immediate download.
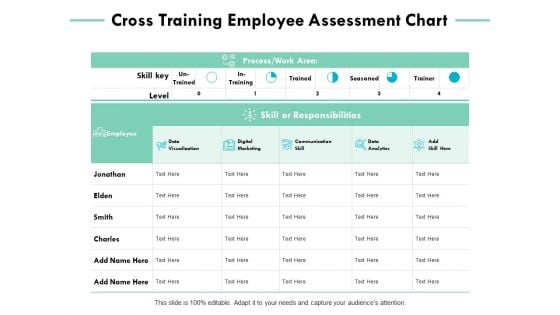
Cross Training Employee Assessment Chart Ppt PowerPoint Presentation Gallery Templates
This is a cross training employee assessment chart ppt powerpoint presentation gallery templates. The topics discussed in this diagram are business, management, compare, marketing. This is a completely editable PowerPoint presentation, and is available for immediate download.
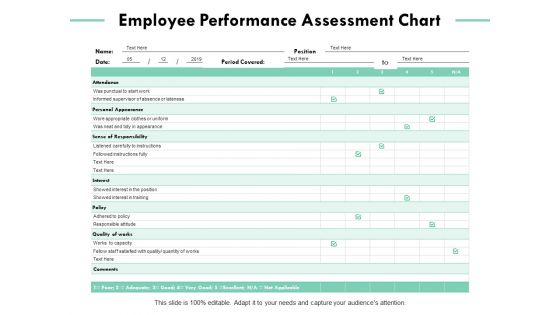
Employee Performance Assessment Chart Ppt PowerPoint Presentation Pictures Structure
This is a employee performance assessment chart ppt powerpoint presentation pictures structure. The topics discussed in this diagram are business, management, marketing, compare. This is a completely editable PowerPoint presentation, and is available for immediate download.
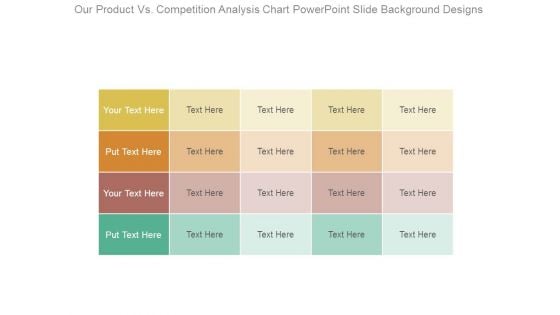
Our Product Vs Competition Analysis Chart Powerpoint Slide Background Designs
This is a our product vs competition analysis chart powerpoint slide background designs. This is a four stage process. The stages in this process are business, marketing, success, strategy, compare.
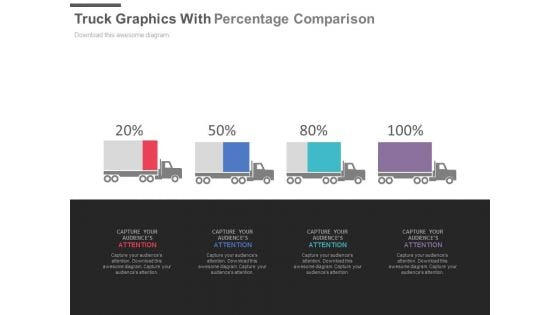
Four Trucks With Percentage Values For Comparison Powerpoint Slides
This PPT slide displays graphics of four trucks with percentage values. Use this PPT design to display logistics compare chart. This PowerPoint template can be customized as per requirements of business presentation.
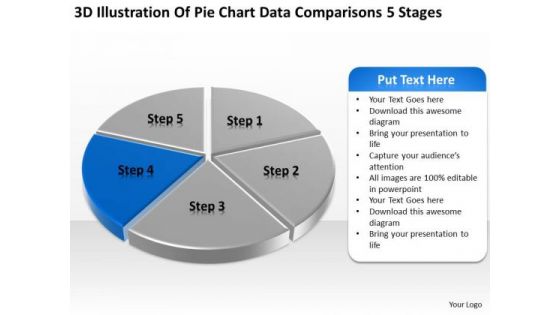
Pie Chart Data Comparisons 5 Stages How To Develop Business Plan PowerPoint Templates
We present our pie chart data comparisons 5 stages how to develop business plan PowerPoint templates.Present our Marketing PowerPoint Templates because You can Be the star of the show with our PowerPoint Templates and Slides. Rock the stage with your ideas. Download and present our Finance PowerPoint Templates because Timeline crunches are a fact of life. Meet all deadlines using our PowerPoint Templates and Slides. Use our Business PowerPoint Templates because You can Be the puppeteer with our PowerPoint Templates and Slides as your strings. Lead your team through the steps of your script. Download and present our Sales PowerPoint Templates because Our PowerPoint Templates and Slides are a sure bet. Gauranteed to win against all odds. Download our Success PowerPoint Templates because Our PowerPoint Templates and Slides will provide weight to your words. They will bring out the depth of your thought process.Use these PowerPoint slides for presentations relating to Analysis, Analyzing, Brands, Business, Chart, Colorful, Commerce, Compare, Comparison, Data, Economical, Finance, Financial, Grow, Growth, Market, Market Share, Marketing, Measure, Pen, Pie, Pie Chart, Presentation, Profit, Revenue, Sales, Sales Chat, Sales Increase, Share, Statistical, Success, Successful. The prominent colors used in the PowerPoint template are Blue, Gray, White. Motivate your team to excellent performances. Nurture their abilities through our Pie Chart Data Comparisons 5 Stages How To Develop Business Plan PowerPoint Templates.
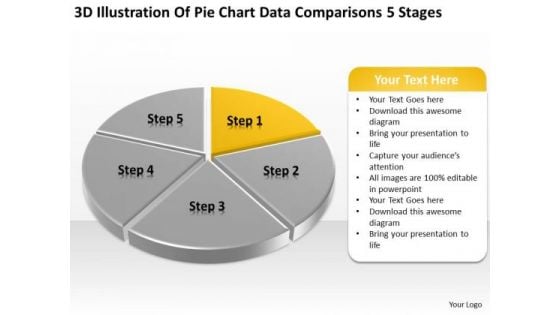
Pie Chart Data Comparisons 5 Stages Examples Small Business Plans PowerPoint Slides
We present our pie chart data comparisons 5 stages examples small business plans PowerPoint Slides.Download our Marketing PowerPoint Templates because you can Set pulses racing with our PowerPoint Templates and Slides. They will raise the expectations of your team. Present our Finance PowerPoint Templates because Our PowerPoint Templates and Slides are the chords of your song. String them along and provide the lilt to your views. Download and present our Business PowerPoint Templates because It will Raise the bar of your Thoughts. They are programmed to take you to the next level. Download our Sales PowerPoint Templates because Our PowerPoint Templates and Slides will fulfill your every need. Use them and effectively satisfy the desires of your audience. Present our Success PowerPoint Templates because You can Be the puppeteer with our PowerPoint Templates and Slides as your strings. Lead your team through the steps of your script.Use these PowerPoint slides for presentations relating to Analysis, Analyzing, Brands, Business, Chart, Colorful, Commerce, Compare, Comparison, Data, Economical, Finance, Financial, Grow, Growth, Market, Market Share, Marketing, Measure, Pen, Pie, Pie Chart, Presentation, Profit, Revenue, Sales, Sales Chat, Sales Increase, Share, Statistical, Success, Successful. The prominent colors used in the PowerPoint template are Yellow, Gray, White. Ambiguity can be exasperating. Give definite answers with our Pie Chart Data Comparisons 5 Stages Examples Small Business Plans PowerPoint Slides.
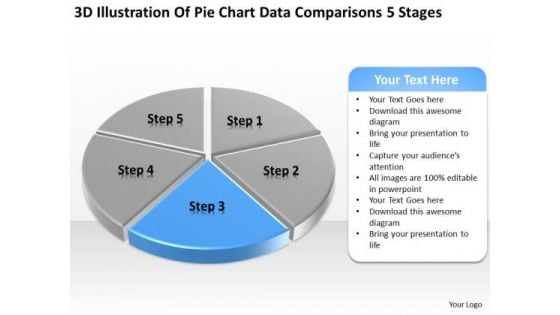
Pie Chart Data Comparisons 5 Stages Business Plan Templates PowerPoint Slides
We present our pie chart data comparisons 5 stages business plan templates PowerPoint Slides.Present our Marketing PowerPoint Templates because Our PowerPoint Templates and Slides are Clear and concise. Use them and dispel any doubts your team may have. Present our Finance PowerPoint Templates because You can Create a matrix with our PowerPoint Templates and Slides. Feel the strength of your ideas click into place. Download our Business PowerPoint Templates because You can Inspire your team with our PowerPoint Templates and Slides. Let the force of your ideas flow into their minds. Present our Sales PowerPoint Templates because Our PowerPoint Templates and Slides are aesthetically designed to attract attention. We gaurantee that they will grab all the eyeballs you need. Present our Success PowerPoint Templates because Our PowerPoint Templates and Slides are specially created by a professional team with vast experience. They diligently strive to come up with the right vehicle for your brilliant Ideas. Use these PowerPoint slides for presentations relating to Analysis, Analyzing, Brands, Business, Chart, Colorful, Commerce, Compare, Comparison, Data, Economical, Finance, Financial, Grow, Growth, Market, Market Share, Marketing, Measure, Pen, Pie, Pie Chart, Presentation, Profit, Revenue, Sales, Sales Chat, Sales Increase, Share, Statistical, Success, Successful. The prominent colors used in the PowerPoint template are Blue, Gray, White. Start a company with our Pie Chart Data Comparisons 5 Stages Business Plan Templates PowerPoint Slides. Just download, type and present.
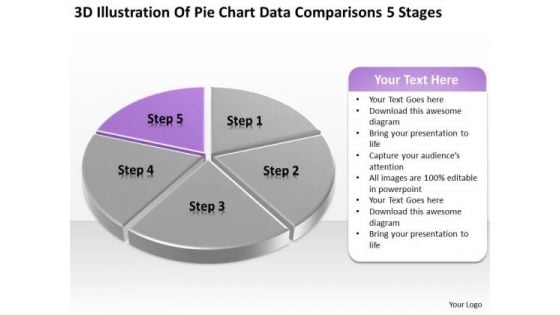
Pie Chart Data Comparisons 5 Stages Ppt Designing Business Plan PowerPoint Templates
We present our pie chart data comparisons 5 stages ppt designing business plan PowerPoint templates.Use our Marketing PowerPoint Templates because Our PowerPoint Templates and Slides are innately eco-friendly. Their high recall value negate the need for paper handouts. Download our Finance PowerPoint Templates because Our PowerPoint Templates and Slides are truly out of this world. Even the MIB duo has been keeping tabs on our team. Use our Business PowerPoint Templates because You should Bet on your luck with our PowerPoint Templates and Slides. Be assured that you will hit the jackpot. Present our Sales PowerPoint Templates because Our PowerPoint Templates and Slides are created with admirable insight. Use them and give your group a sense of your logical mind. Present our Success PowerPoint Templates because Our PowerPoint Templates and Slides are focused like a searchlight beam. They highlight your ideas for your target audience.Use these PowerPoint slides for presentations relating to Analysis, Analyzing, Brands, Business, Chart, Colorful, Commerce, Compare, Comparison, Data, Economical, Finance, Financial, Grow, Growth, Market, Market Share, Marketing, Measure, Pen, Pie, Pie Chart, Presentation, Profit, Revenue, Sales, Sales Chat, Sales Increase, Share, Statistical, Success, Successful. The prominent colors used in the PowerPoint template are Purple, Gray, White. Make instructive presentations with our Pie Chart Data Comparisons 5 Stages Ppt Designing Business Plan PowerPoint Templates. Dont waste time struggling with PowerPoint. Let us do it for you.
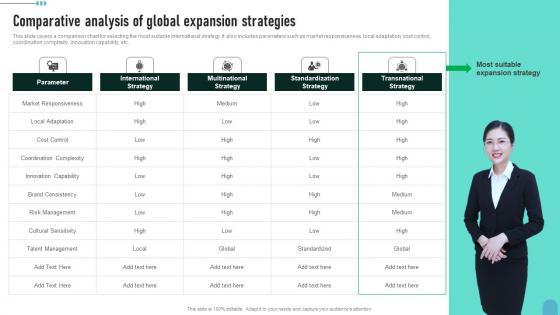
Comparative Analysis Of Global Expansion Enhancing Global Presence Professional Pdf
This slide covers a comparison chart for selecting the most suitable international strategy. It also includes parameters such as market responsiveness, local adaptation, cost control, coordination complexity, innovation capability, etc.Present like a pro with Comparative Analysis Of Global Expansion Enhancing Global Presence Professional Pdf Create beautiful presentations together with your team, using our easy-to-use presentation slides. Share your ideas in real-time and make changes on the fly by downloading our templates. So whether you are in the office, on the go, or in a remote location, you can stay in sync with your team and present your ideas with confidence. With Slidegeeks presentation got a whole lot easier. Grab these presentations today. This slide covers a comparison chart for selecting the most suitable international strategy. It also includes parameters such as market responsiveness, local adaptation, cost control, coordination complexity, innovation capability, etc.
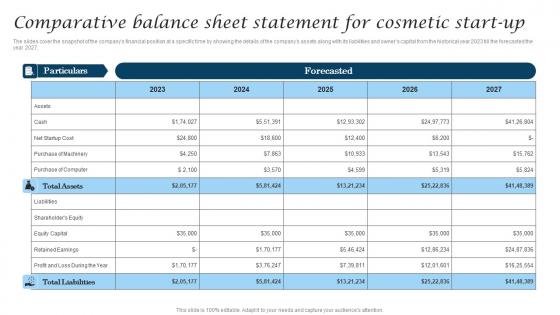
Comparative Balance Sheet Statement For Cosmetic Industry Business Information Pdf
The slides cover the snapshot of the companys financial position at a specific time by showing the details of the companys assets along with its liabilities and owners capital from the historical year 2023 till the forecasted the year 2027. Get a simple yet stunning designed Comparative Balance Sheet Statement For Cosmetic Industry Business Information Pdf. It is the best one to establish the tone in your meetings. It is an excellent way to make your presentations highly effective. So, download this PPT today from Slidegeeks and see the positive impacts. Our easy-to-edit Comparative Balance Sheet Statement For Cosmetic Industry Business Information Pdf can be your go-to option for all upcoming conferences and meetings. So, what are you waiting for Grab this template today. The slides cover the snapshot of the companys financial position at a specific time by showing the details of the companys assets along with its liabilities and owners capital from the historical year 2023 till the forecasted the year 2027.
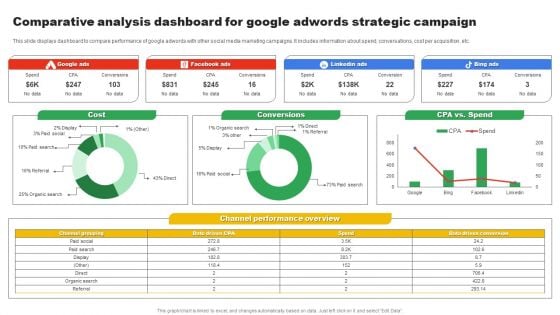
Comparative Analysis Dashboard For Google Adwords Strategic Campaign Slides PDF
This slide displays dashboard to compare performance of google adwords with other social media marketing campaigns. It includes information about spend, conversations, cost per acquisition, etc. Showcasing this set of slides titled Comparative Analysis Dashboard For Google Adwords Strategic Campaign Slides PDF. The topics addressed in these templates are Google Ads, Cost, Conversions. All the content presented in this PPT design is completely editable. Download it and make adjustments in color, background, font etc. as per your unique business setting.
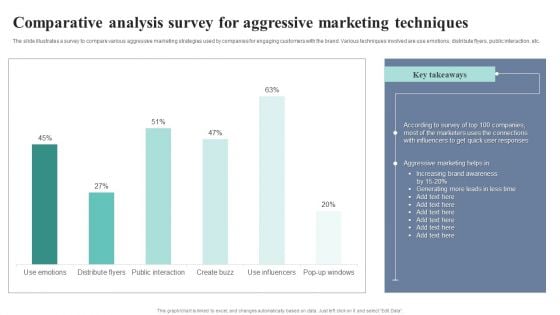
Comparative Analysis Survey For Aggressive Marketing Techniques Themes PDF
The slide illustrates a survey to compare various aggressive marketing strategies used by companies for engaging customers with the brand. Various techniques involved are use emotions, distribute flyers, public interaction, etc. Showcasing this set of slides titled Comparative Analysis Survey For Aggressive Marketing Techniques Themes PDF. The topics addressed in these templates are Comparative Analysis, Aggressive Marketing, Techniques. All the content presented in this PPT design is completely editable. Download it and make adjustments in color, background, font etc. as per your unique business setting.
Comparative Analysis For Manual And Automation Testing Lifecycle Icons PDF
This slide showcases graphical report to compare test expenses from manual and automated testing cycles over the years. It further includes details about benefits that can be derived from test automation cycle. Pitch your topic with ease and precision using this Comparative Analysis For Manual And Automation Testing Lifecycle Icons PDF. This layout presents information on Comparative Analysis For Manual, Automation Testing Lifecycle. It is also available for immediate download and adjustment. So, changes can be made in the color, design, graphics or any other component to create a unique layout.


 Continue with Email

 Home
Home


