Consumer Finance
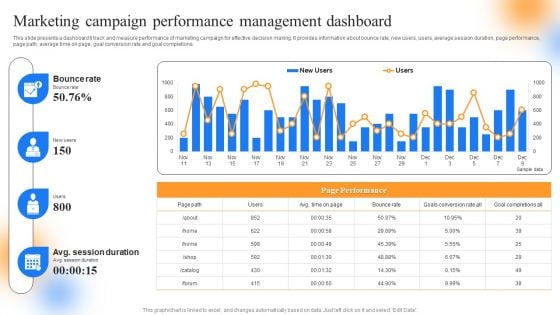
Strategic Guide To Perform Marketing Marketing Campaign Performance Management Dashboard Diagrams PDF
This slide presents a dashboard ti track and measure performance of marketing campaign for effective decision making. It provides information about bounce rate, new users, users, average session duration, page performance, page path, average time on page, goal conversion rate and goal completions. Slidegeeks is here to make your presentations a breeze with Strategic Guide To Perform Marketing Marketing Campaign Performance Management Dashboard Diagrams PDF With our easy to use and customizable templates, you can focus on delivering your ideas rather than worrying about formatting. With a variety of designs to choose from, youre sure to find one that suits your needs. And with animations and unique photos, illustrations, and fonts, you can make your presentation pop. So whether youre giving a sales pitch or presenting to the board, make sure to check out Slidegeeks first.
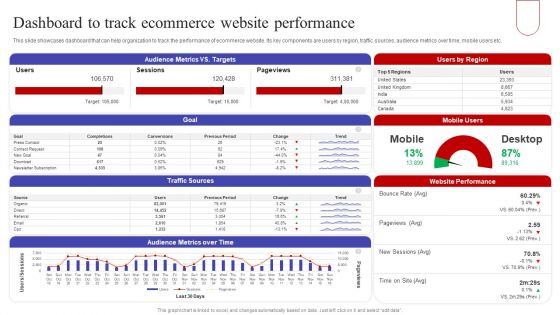
Dashboard To Track Ecommerce Website Performance Summary PDF
This slide showcases dashboard that can help organization to track the performance of ecommerce website. Its key components are users by region, traffic sources, audience metrics over time, mobile users etc. Do you know about Slidesgeeks Dashboard To Track Ecommerce Website Performance Summary PDF These are perfect for delivering any kind od presentation. Using it, create PowerPoint presentations that communicate your ideas and engage audiences. Save time and effort by using our pre designed presentation templates that are perfect for a wide range of topic. Our vast selection of designs covers a range of styles, from creative to business, and are all highly customizable and easy to edit. Download as a PowerPoint template or use them as Google Slides themes.
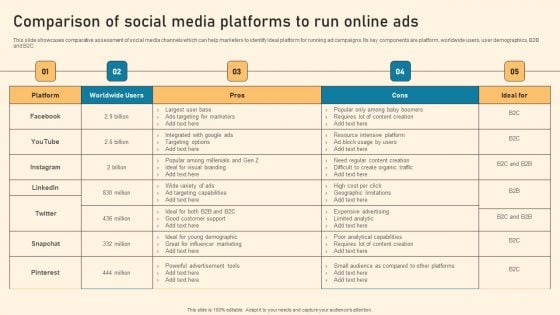
Comparison Of Social Media Platforms To Run Online Ads Ppt PowerPoint Presentation Diagram Graph Charts PDF
This slide showcases comparative assessment of social media channels which can help marketers to identify ideal platform for running ad campaigns. Its key components are platform, worldwide users, user demographics, B2B and B2C Slidegeeks is here to make your presentations a breeze with Comparison Of Social Media Platforms To Run Online Ads Ppt PowerPoint Presentation Diagram Graph Charts PDF With our easy to use and customizable templates, you can focus on delivering your ideas rather than worrying about formatting. With a variety of designs to choose from, you are sure to find one that suits your needs. And with animations and unique photos, illustrations, and fonts, you can make your presentation pop. So whether you are giving a sales pitch or presenting to the board, make sure to check out Slidegeeks first.
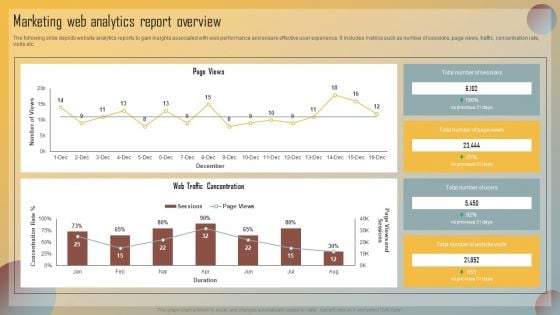
Guide For Marketing Analytics To Improve Decisions Marketing Web Analytics Report Overview Microsoft PDF
The following slide depicts website analytics reports to gain insights associated with web performance and ensure effective user experience. It includes metrics such as number of sessions, page views, traffic, concentration rate, visits etc. Want to ace your presentation in front of a live audience Our Guide For Marketing Analytics To Improve Decisions Marketing Web Analytics Report Overview Microsoft PDF can help you do that by engaging all the users towards you. Slidegeeks experts have put their efforts and expertise into creating these impeccable powerpoint presentations so that you can communicate your ideas clearly. Moreover, all the templates are customizable, and easy to edit and downloadable. Use these for both personal and commercial use.
Strategic Market Insight Implementation Guide Online Tracking To Optimize Website Performance Background PDF
The following slide provides overview of performance indicators for online tracking to manage and optimize user behavior on website. It highlights metrics such as web conversions, users, top landing pages, bounce rate, conversion rate, page, sessions and goals value. Here you can discover an assortment of the finest PowerPoint and Google Slides templates. With these templates, you can create presentations for a variety of purposes while simultaneously providing your audience with an eye catching visual experience. Download Strategic Market Insight Implementation Guide Online Tracking To Optimize Website Performance Background PDF to deliver an impeccable presentation. These templates will make your job of preparing presentations much quicker, yet still, maintain a high level of quality. Slidegeeks has experienced researchers who prepare these templates and write high quality content for you. Later on, you can personalize the content by editing the Strategic Market Insight Implementation Guide Online Tracking To Optimize Website Performance Background PDF.
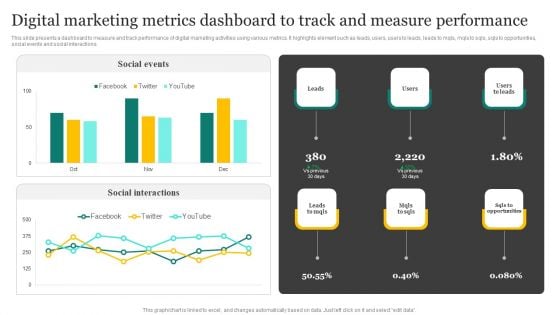
Strategic Promotion Plan Development Stages Digital Marketing Metrics Dashboard To Track Structure PDF
This slide presents a dashboard to measure and track performance of digital marketing activities using various metrics. It highlights element such as leads, users, users to leads, leads to mqls, mqls to sqls, sqls to opportunities, social events and social interactions. Are you in need of a template that can accommodate all of your creative concepts This one is crafted professionally and can be altered to fit any style. Use it with Google Slides or PowerPoint. Include striking photographs, symbols, depictions, and other visuals. Fill, move around, or remove text boxes as desired. Test out color palettes and font mixtures. Edit and save your work, or work with colleagues. Download Strategic Promotion Plan Development Stages Digital Marketing Metrics Dashboard To Track Structure PDF and observe how to make your presentation outstanding. Give an impeccable presentation to your group and make your presentation unforgettable.
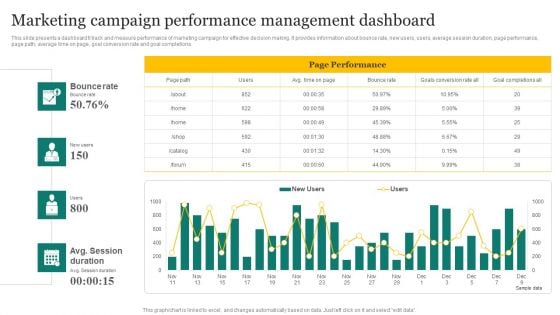
Strategic Promotion Plan Development Stages Marketing Campaign Performance Management Dashboard Formats PDF
This slide presents a dashboard ti track and measure performance of marketing campaign for effective decision making. It provides information about bounce rate, new users, users, average session duration, page performance, page path, average time on page, goal conversion rate and goal completions. Formulating a presentation can take up a lot of effort and time, so the content and message should always be the primary focus. The visuals of the PowerPoint can enhance the presenters message, so our Strategic Promotion Plan Development Stages Marketing Campaign Performance Management Dashboard Formats PDF was created to help save time. Instead of worrying about the design, the presenter can concentrate on the message while our designers work on creating the ideal templates for whatever situation is needed. Slidegeeks has experts for everything from amazing designs to valuable content, we have put everything into Strategic Promotion Plan Development Stages Marketing Campaign Performance Management Dashboard Formats PDF
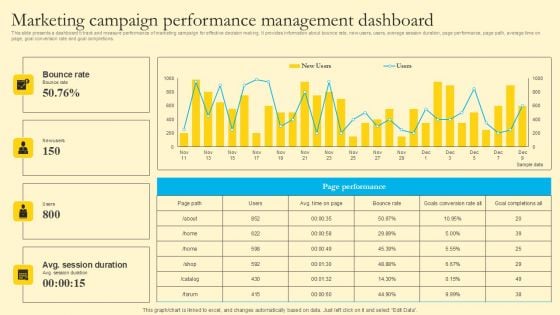
Comprehensive Guide For Sales And Advertising Processes Marketing Campaign Performance Management Graphics PDF
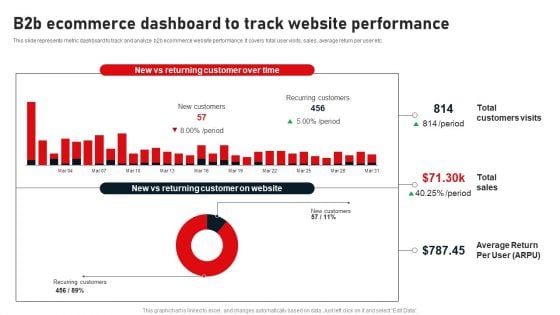
B2B Ecommerce Dashboard To Track Website Performance Designs PDF
This slide represents metric dashboard to track and analyze b2b ecommerce website performance. It covers total user visits, sales, average return per user etc. Presenting this PowerPoint presentation, titled B2B Ecommerce Dashboard To Track Website Performance Designs PDF, with topics curated by our researchers after extensive research. This editable presentation is available for immediate download and provides attractive features when used. Download now and captivate your audience. Presenting this B2B Ecommerce Dashboard To Track Website Performance Designs PDF. Our researchers have carefully researched and created these slides with all aspects taken into consideration. This is a completely customizable B2B Ecommerce Dashboard To Track Website Performance Designs PDF that is available for immediate downloading. Download now and make an impact on your audience. Highlight the attractive features available with our PPTs.
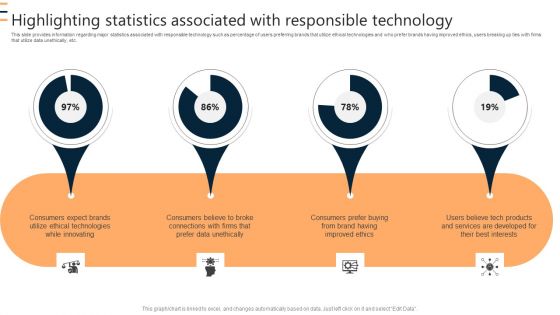
Highlighting Statistics Associated With Responsible Technology Ppt Inspiration Visuals PDF
This slide provides information regarding major statistics associated with responsible technology such as percentage of users preferring brands that utilize ethical technologies and who prefer brands having improved ethics, users breaking up ties with firms that utilize data unethically, etc. Formulating a presentation can take up a lot of effort and time, so the content and message should always be the primary focus. The visuals of the PowerPoint can enhance the presenters message, so our Highlighting Statistics Associated With Responsible Technology Ppt Inspiration Visuals PDF was created to help save time. Instead of worrying about the design, the presenter can concentrate on the message while our designers work on creating the ideal templates for whatever situation is needed. Slidegeeks has experts for everything from amazing designs to valuable content, we have put everything into Highlighting Statistics Associated With Responsible Technology Ppt Inspiration Visuals PDF.
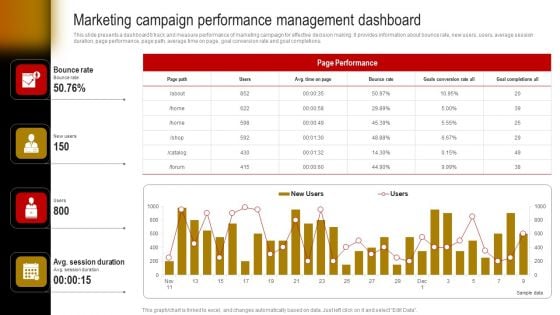
Marketing Campaign Performance Management Dashboard Professional PDF
This slide presents a dashboard ti track and measure performance of marketing campaign for effective decision making. It provides information about bounce rate, new users, users, average session duration, page performance, page path, average time on page, goal conversion rate and goal completions. Do you have to make sure that everyone on your team knows about any specific topic I yes, then you should give Marketing Campaign Performance Management Dashboard Professional PDF a try. Our experts have put a lot of knowledge and effort into creating this impeccable Marketing Campaign Performance Management Dashboard Professional PDF. You can use this template for your upcoming presentations, as the slides are perfect to represent even the tiniest detail. You can download these templates from the Slidegeeks website and these are easy to edit. So grab these today.
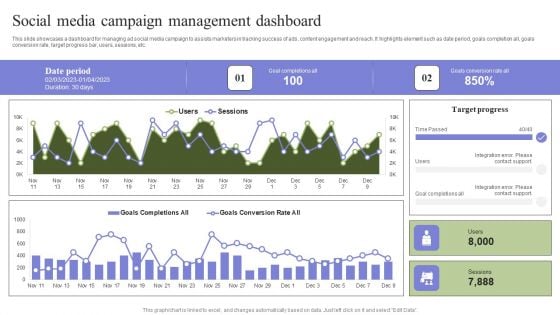
Marketing Mix Strategy Handbook Social Media Campaign Management Dashboard Professional PDF
This slide showcases a dashboard for managing ad social media campaign to assists marketers in tracking success of ads, content engagement and reach. It highlights element such as date period, goals completion all, goals conversion rate, target progress bar, users, sessions, etc. Want to ace your presentation in front of a live audience Our Marketing Mix Strategy Handbook Social Media Campaign Management Dashboard Professional PDF can help you do that by engaging all the users towards you. Slidegeeks experts have put their efforts and expertise into creating these impeccable powerpoint presentations so that you can communicate your ideas clearly. Moreover, all the templates are customizable, and easy-to-edit and downloadable. Use these for both personal and commercial use.
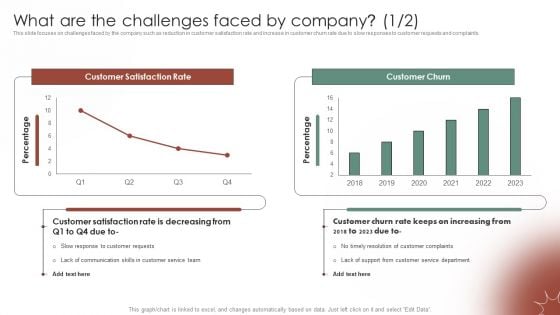
Tactical Communication Plan What Are The Challenges Faced By Company Demonstration PDF
This slide focuses on challenges faced by the company such as reduction in customer satisfaction rate and increase in customer churn rate due to slow responses to customer requests and complaints. Slidegeeks is one of the best resources for PowerPoint templates. You can download easily and regulate Tactical Communication Plan What Are The Challenges Faced By Company Demonstration PDF for your personal presentations from our wonderful collection. A few clicks is all it takes to discover and get the most relevant and appropriate templates. Use our Templates to add a unique zing and appeal to your presentation and meetings. All the slides are easy to edit and you can use them even for advertisement purposes.
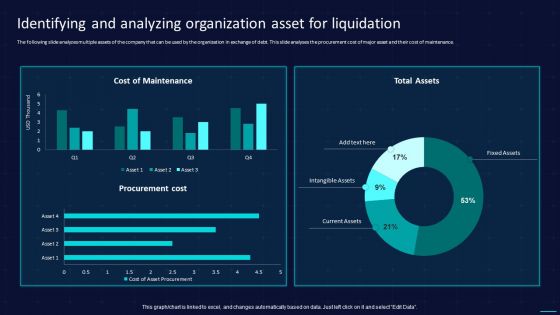
Identifying And Analyzing Organization Asset For Liquidation Ideas PDF
The following slide analyzes multiple assets of the company that can be used by the organization in exchange of debt. This slide analyses the procurement cost of major asset and their cost of maintenance. Deliver an awe inspiring pitch with this creative Identifying And Analyzing Organization Asset For Liquidation Ideas PDF bundle. Topics like Procurement Cost, Cost Of Maintenance, Intangible Assets can be discussed with this completely editable template. It is available for immediate download depending on the needs and requirements of the user.
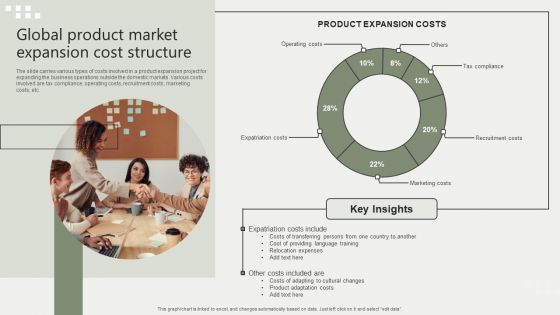
Global Business Market Development Guide Global Product Market Expansion Cost Structure Brochure PDF
The slide carries various types of costs involved in a product expansion project for expanding the business operations outside the domestic markets. Various costs involved are tax compliance, operating costs, recruitment costs, marketing costs, etc. Make sure to capture your audiences attention in your business displays with our gratis customizable Global Business Market Development Guide Global Product Market Expansion Cost Structure Brochure PDF. These are great for business strategies, office conferences, capital raising or task suggestions. If you desire to acquire more customers for your tech business and ensure they stay satisfied, create your own sales presentation with these plain slides.
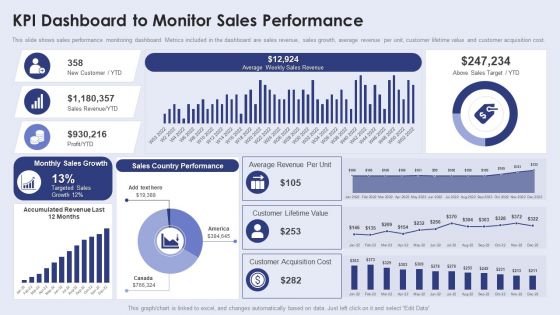
Creating New Product Launch Campaign Strategy Kpi Dashboard To Monitor Sales Performance Introduction PDF
This slide shows sales performance monitoring dashboard. Metrics included in the dashboard are sales revenue, sales growth, average revenue per unit, customer lifetime value and customer acquisition cost. This modern and well arranged Creating New Product Launch Campaign Strategy Kpi Dashboard To Monitor Sales Performance Introduction PDF provides lots of creative possibilities. It is very simple to customize and edit with the Powerpoint Software. Just drag and drop your pictures into the shapes. All facets of this template can be edited with Powerpoint no extra software is necessary. Add your own material, put your images in the places assigned for them, adjust the colors, and then you can show your slides to the world, with an animated slide included.
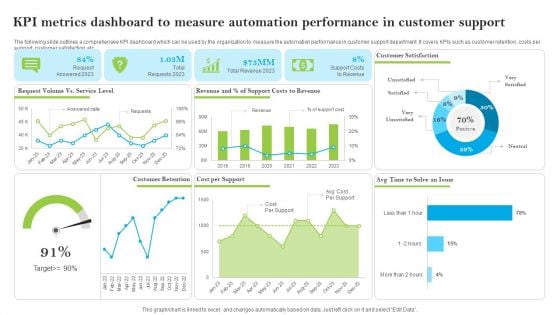
Introducing AI Tools KPI Metrics Dashboard To Measure Automation Performance Formats PDF
The following slide outlines a comprehensive KPI dashboard which can be used by the organization to measure the automation performance in customer support department. It covers KPIs such as customer retention, costs per support, customer satisfaction, etc. This Introducing AI Tools KPI Metrics Dashboard To Measure Automation Performance Formats PDF is perfect for any presentation, be it in front of clients or colleagues. It is a versatile and stylish solution for organizing your meetings. The Introducing AI Tools KPI Metrics Dashboard To Measure Automation Performance Formats PDF features a modern design for your presentation meetings. The adjustable and customizable slides provide unlimited possibilities for acing up your presentation. Slidegeeks has done all the homework before launching the product for you. So, dont wait, grab the presentation templates today.
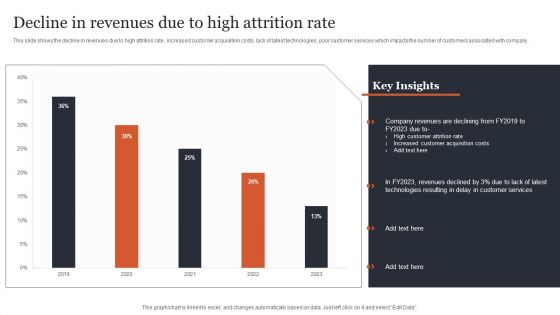
CRM Administration To Reduce Churn Rate Decline In Revenues Due To High Attrition Rate Themes PDF
This slide shows the decline in revenues due to high attrition rate, increased customer acquisition costs, lack of latest technologies, poor customer services which impacts the number of customers associated with company. Formulating a presentation can take up a lot of effort and time, so the content and message should always be the primary focus. The visuals of the PowerPoint can enhance the presenters message, so our CRM Administration To Reduce Churn Rate Decline In Revenues Due To High Attrition Rate Themes PDF was created to help save time. Instead of worrying about the design, the presenter can concentrate on the message while our designers work on creating the ideal templates for whatever situation is needed. Slidegeeks has experts for everything from amazing designs to valuable content, we have put everything into CRM Administration To Reduce Churn Rate Decline In Revenues Due To High Attrition Rate Themes PDF.
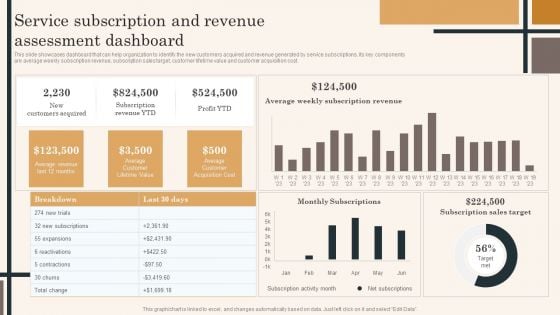
Edtech Service Launch And Promotion Plan Service Subscription And Revenue Assessment Dashboard Topics PDF
This slide showcases dashboard that can help organization to identify the new customers acquired and revenue generated by service subscriptions. Its key components are average weekly subscription revenue, subscription sales target, customer lifetime value and customer acquisition cost. Whether you have daily or monthly meetings, a brilliant presentation is necessary. Edtech Service Launch And Promotion Plan Service Subscription And Revenue Assessment Dashboard Topics PDF can be your best option for delivering a presentation. Represent everything in detail using Edtech Service Launch And Promotion Plan Service Subscription And Revenue Assessment Dashboard Topics PDF and make yourself stand out in meetings. The template is versatile and follows a structure that will cater to your requirements. All the templates prepared by Slidegeeks are easy to download and edit. Our research experts have taken care of the corporate themes as well. So, give it a try and see the results.
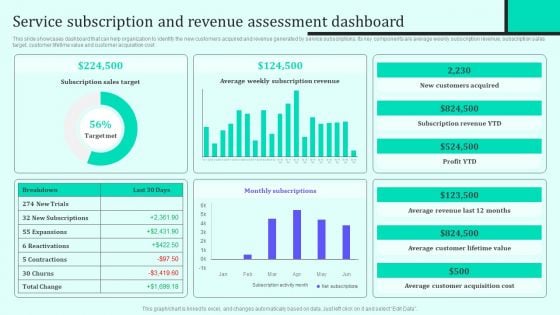
Implementing New Sales And Marketing Process For Services Service Subscription And Revenue Assessment Infographics PDF
This slide showcases dashboard that can help organization to identify the new customers acquired and revenue generated by service subscriptions. Its key components are average weekly subscription revenue, subscription sales target, customer lifetime value and customer acquisition cost. Do you have to make sure that everyone on your team knows about any specific topic I yes, then you should give Implementing New Sales And Marketing Process For Services Service Subscription And Revenue Assessment Infographics PDF a try. Our experts have put a lot of knowledge and effort into creating this impeccable Implementing New Sales And Marketing Process For Services Service Subscription And Revenue Assessment Infographics PDF. You can use this template for your upcoming presentations, as the slides are perfect to represent even the tiniest detail. You can download these templates from the Slidegeeks website and these are easy to edit. So grab these today.
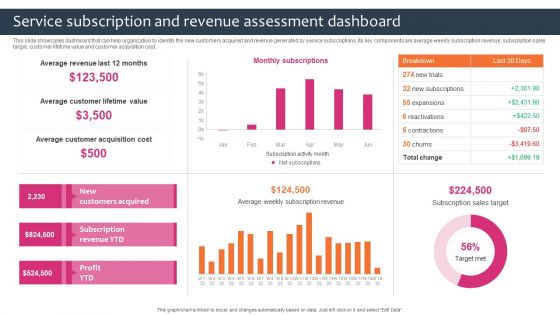
Promotion Sales Techniques For New Service Introduction Service Subscription Revenue Assessment Infographics PDF
This slide showcases dashboard that can help organization to identify the new customers acquired and revenue generated by service subscriptions. Its key components are average weekly subscription revenue, subscription sales target, customer lifetime value and customer acquisition cost. Are you searching for a Promotion Sales Techniques For New Service Introduction Service Subscription Revenue Assessment Infographics PDF that is uncluttered, straightforward, and original Its easy to edit, and you can change the colors to suit your personal or business branding. For a presentation that expresses how much effort you have put in, this template is ideal. With all of its features, including tables, diagrams, statistics, and lists, its perfect for a business plan presentation. Make your ideas more appealing with these professional slides. Download Promotion Sales Techniques For New Service Introduction Service Subscription Revenue Assessment Infographics PDF from Slidegeeks today.
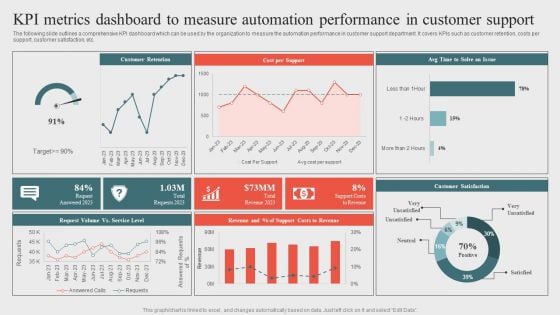
Kpi Metrics Dashboard To Measure Automation Performanceoptimizing Business Processes Through Automation Download PDF
The following slide outlines a comprehensive KPI dashboard which can be used by the organization to measure the automation performance in customer support department. It covers KPIs such as customer retention, costs per support, customer satisfaction, etc. Get a simple yet stunning designed Kpi Metrics Dashboard To Measure Automation Performanceoptimizing Business Processes Through Automation Download PDF. It is the best one to establish the tone in your meetings. It is an excellent way to make your presentations highly effective. So, download this PPT today from Slidegeeks and see the positive impacts. Our easy to edit Kpi Metrics Dashboard To Measure Automation Performanceoptimizing Business Processes Through Automation Download PDF can be your go to option for all upcoming conferences and meetings. So, what are you waiting for Grab this template today.
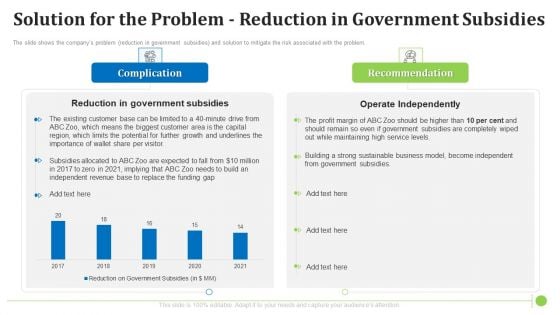
Solution For The Problem Reduction In Government Subsidies Introduction PDF
The slide shows the companys problem reduction in government subsidies and solution to mitigate the risk associated with the problem. Deliver and pitch your topic in the best possible manner with this solution for the problem reduction in government subsidies introduction pdf. Use them to share invaluable insights on growth, customer, funding, revenue, service and impress your audience. This template can be altered and modified as per your expectations. So, grab it now.
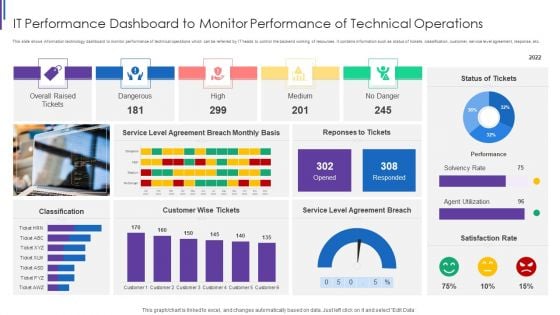
IT Performance Dashboard To Monitor Performance Of Technical Operations Download PDF
This slide shows information technology dashboard to monitor performance of technical operations which can be referred by IT heads to control the backend working of resources. It contains information such as status of tickets, classification, customer, service level agreement, response, etc. Showcasing this set of slides titled IT Performance Dashboard To Monitor Performance Of Technical Operations Download PDF. The topics addressed in these templates are Overall Raised Tickets, Dangerous High Medium, Service Level Agreement, Customer Wise Tickets. All the content presented in this PPT design is completely editable. Download it and make adjustments in color, background, font etc. as per your unique business setting.
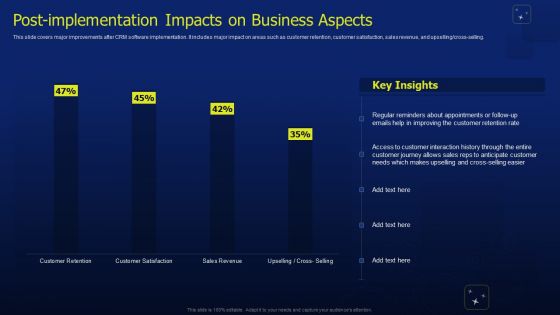
CRM Software Deployment Journey Post Implementation Impacts On Business Aspects Guidelines PDF
This slide covers major improvements after CRM software implementation. It includes major impact on areas such as customer retention, customer satisfaction, sales revenue, and upselling or cross-selling. Slidegeeks is one of the best resources for PowerPoint templates. You can download easily and regulate CRM Software Deployment Journey Post Implementation Impacts On Business Aspects Guidelines PDF for your personal presentations from our wonderful collection. A few clicks is all it takes to discover and get the most relevant and appropriate templates. Use our Templates to add a unique zing and appeal to your presentation and meetings. All the slides are easy to edit and you can use them even for advertisement purposes.
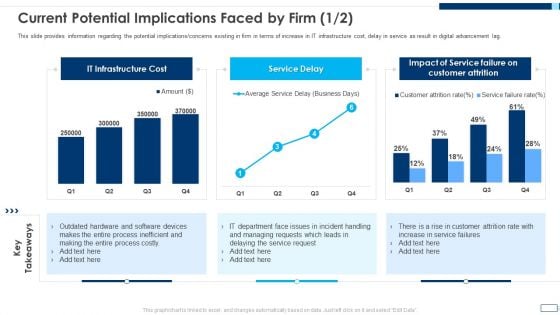
Evolving BI Infrastructure Current Potential Implications Faced By Firm Cost Pictures PDF
This slide provides information regarding the potential implications or concerns existing in firm in terms of increase in IT infrastructure cost, delay in service as result in digital advancement lag. Deliver and pitch your topic in the best possible manner with this evolving bi infrastructure current potential implications faced by firm cost pictures pdf. Use them to share invaluable insights on it infrastructure cost, service delay, impact of service failure on customer attrition and impress your audience. This template can be altered and modified as per your expectations. So, grab it now.

Current Status Of Business Revenues And Cost Integrating Technology To Transform Change Pictures PDF
This slide focuses on current status of business revenues and cost which covers reasons for decline in revenues increase in cost such as poor customer service lack of sales automation, etc. that help company to focus on impacted areas.If your project calls for a presentation, then Slidegeeks is your go-to partner because we have professionally designed, easy-to-edit templates that are perfect for any presentation. After downloading, you can easily edit Current Status Of Business Revenues And Cost Integrating Technology To Transform Change Pictures PDF and make the changes accordingly. You can rearrange slides or fill them with different images. Check out all the handy templates
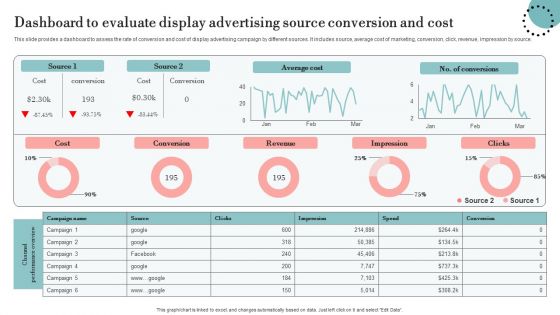
Dashboard To Evaluate Display Advertising Source Conversion And Cost Designs PDF
This slide provides a dashboard to assess the rate of conversion and cost of display advertising campaign by different sources. It includes source, average cost of marketing, conversion, click, revenue, impression by source. Make sure to capture your audiences attention in your business displays with our gratis customizable Dashboard To Evaluate Display Advertising Source Conversion And Cost Designs PDF. These are great for business strategies, office conferences, capital raising or task suggestions. If you desire to acquire more customers for your tech business and ensure they stay satisfied, create your own sales presentation with these plain slides.
Sales Department Strategies Increase Revenues Sales KPI Dashboard Ppt Icon Visual Aids PDF
The sales dashboard is an effective tool that helps in monitoring various sales KPIs in order to aid sales teams in reaching sales goals by analyzing the sales performance. Deliver and pitch your topic in the best possible manner with this sales department strategies increase revenues sales kpi dashboard ppt icon visual aids pdf. Use them to share invaluable insights on average revenue, customer lifetime value, customer acquisition cost and impress your audience. This template can be altered and modified as per your expectations. So, grab it now.
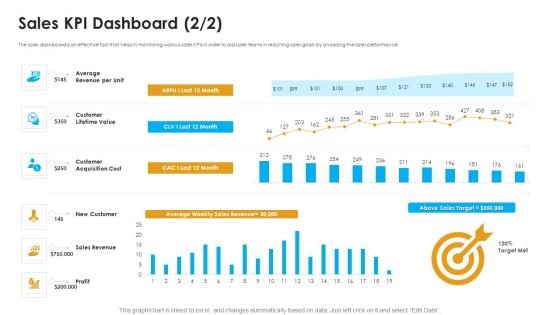
Sales Assistance Boost Overall Efficiency Sales KPI Dashboard New Topics PDF
The sales dashboard is an effective tool that helps in monitoring various sales KPIs in order to aid sales teams in reaching sales goals by analyzing the sales performance. Deliver and pitch your topic in the best possible manner with this sales assistance boost overall efficiency sales kpi dashboard new topics pdf. Use them to share invaluable insights on customer acquisition cost, customer lifetime value, average revenue and impress your audience. This template can be altered and modified as per your expectations. So, grab it now.
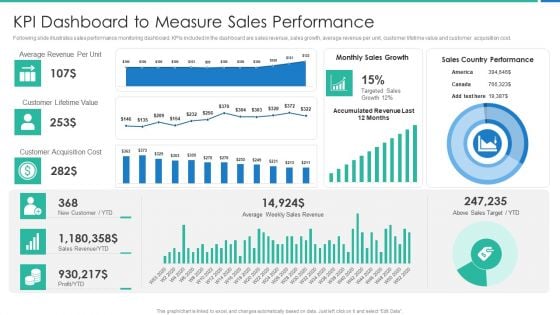
Strong Business Partnership To Ensure Company Success KPI Dashboard To Measure Sales Performance Slides PDF
Following slide illustrates sales performance monitoring dashboard. KPIs included in the dashboard are sales revenue, sales growth, average revenue per unit, customer lifetime value and customer acquisition cost.Deliver and pitch your topic in the best possible manner with this strong business partnership to ensure company success kpi dashboard to measure sales performance slides pdf Use them to share invaluable insights on kpi dashboard to measure sales performance and impress your audience. This template can be altered and modified as per your expectations. So, grab it now.
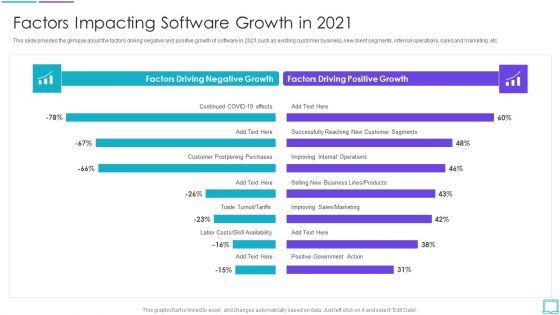
Application Development Startup Factors Impacting Software Growth In 2021 Guidelines PDF
This slide provides the glimpse about the factors driving negative and positive growth of software in 2021 such as existing customer business, new client segments, internal operations, sales and marketing, etc. Deliver and pitch your topic in the best possible manner with this application development startup factors impacting software growth in 2021 guidelines pdf. Use them to share invaluable insights on customer postponing purchases, labor costs, skill ava, improving sales, marketing, positive government action and impress your audience. This template can be altered and modified as per your expectations. So, grab it now.
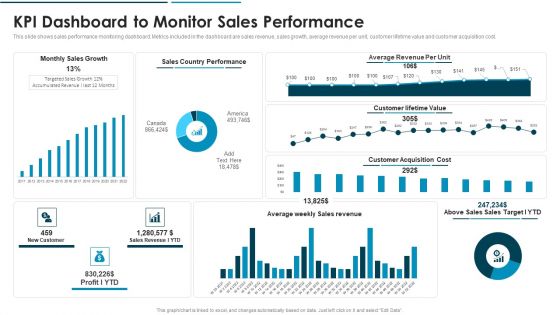
Go To Market Approach For New Product KPI Dashboard To Monitor Sales Performance Clipart PDF
This slide shows sales performance monitoring dashboard. Metrics included in the dashboard are sales revenue, sales growth, average revenue per unit, customer lifetime value and customer acquisition cost.Deliver and pitch your topic in the best possible manner with this Go To Market Approach For New Product KPI Dashboard To Monitor Sales Performance Clipart PDF Use them to share invaluable insights on Kpi Dashboard To Monitor Sales Performance and impress your audience. This template can be altered and modified as per your expectations. So, grab it now.
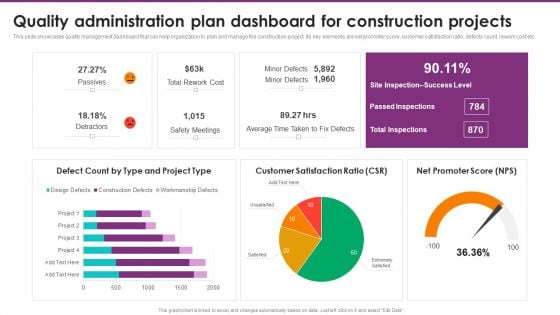
Quality Administration Plan Dashboard For Construction Projects Topics PDF
This slide showcases quality management dashboard that can help organization to plan and manage the construction project. Its key elements are net promoter score, customer satisfaction ratio, defects count, rework cost etc. Showcasing this set of slides titled Quality Administration Plan Dashboard For Construction Projects Topics PDF. The topics addressed in these templates are Customer Satisfaction Ratio, Construction Projects, Quality Administration Plan. All the content presented in this PPT design is completely editable. Download it and make adjustments in color, background, font etc. as per your unique business setting.
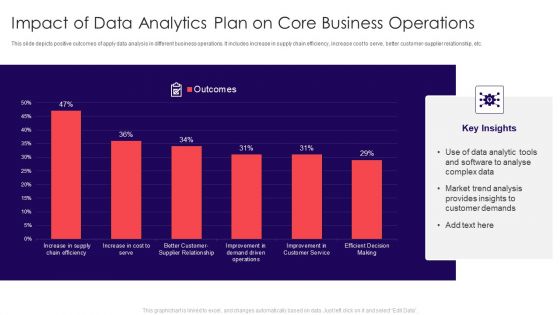
Impact Of Data Analytics Plan On Core Business Operations Summary PDF
This slide depicts positive outcomes of apply data analysis in different business operations. It includes increase in supply chain efficiency, increase cost to serve, better customer-supplier relationship, etc. Showcasing this set of slides titled Impact Of Data Analytics Plan On Core Business Operations Summary PDF. The topics addressed in these templates are Customer Demands, Market Trend Analysis, Complex Data. All the content presented in this PPT design is completely editable. Download it and make adjustments in color, background, font etc. as per your unique business setting.

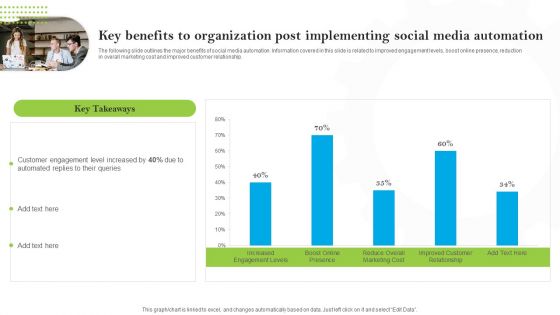
Key Benefits To Organization Post Implementing Social Media Automation Achieving Operational Efficiency Introduction PDF
The following slide outlines the major benefits of social media automation. Information covered in this slide is related to improved engagement levels, boost online presence, reduction in overall marketing cost and improved customer relationship. Deliver and pitch your topic in the best possible manner with this Key Benefits To Organization Post Implementing Social Media Automation Achieving Operational Efficiency Introduction PDF. Use them to share invaluable insights on Customer Engagement, Level Increased, Automated Replies and impress your audience. This template can be altered and modified as per your expectations. So, grab it now.
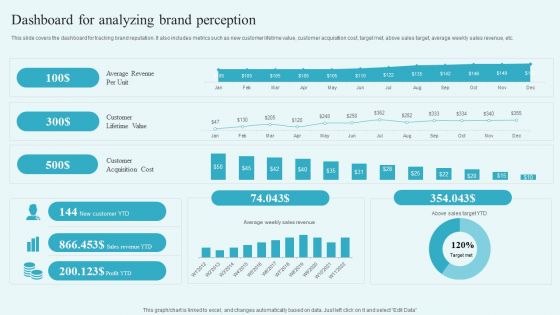
Dashboard For Analyzing Brand Perception Building A Comprehensive Brand Elements PDF
This slide covers the dashboard for tracking brand reputation. It also includes metrics such as new customer lifetime value, customer acquisition cost, target met, above sales target, average weekly sales revenue, etc. Find a pre-designed and impeccable Dashboard For Analyzing Brand Perception Building A Comprehensive Brand Elements PDF. The templates can ace your presentation without additional effort. You can download these easy-to-edit presentation templates to make your presentation stand out from others. So, what are you waiting for Download the template from Slidegeeks today and give a unique touch to your presentation.
Introducing AI Tools Key Benefits To Organization Post Implementing Social Media Automation Topics PDF
The following slide outlines the major benefits of social media automation. Information covered in this slide is related to improved engagement levels, boost online presence, reduction in overall marketing cost and improved customer relationship. Make sure to capture your audiences attention in your business displays with our gratis customizable Introducing AI Tools Key Benefits To Organization Post Implementing Social Media Automation Topics PDF. These are great for business strategies, office conferences, capital raising or task suggestions. If you desire to acquire more customers for your tech business and ensure they stay satisfied, create your own sales presentation with these plain slides.
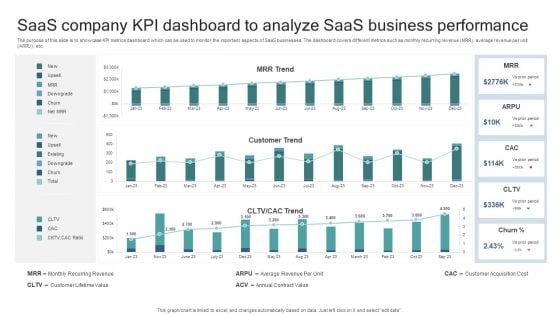
Saas Company KPI Dashboard To Analyze Saas Business Performance Elements PDF
The purpose of this slide is to showcase KPI metrics dashboard which can be used to monitor the important aspects of SaaS businesses. The dashboard covers different metrics such as monthly recurring revenue MRR, average revenue per unit ARPU, etc. Pitch your topic with ease and precision using this Saas Company KPI Dashboard To Analyze Saas Business Performance Elements PDF. This layout presents information on Monthly Recurring Revenue, Customer Lifetime Value, Average Revenue Per Unit, Annual Contract Value, Customer Acquisition Cost. It is also available for immediate download and adjustment. So, changes can be made in the color, design, graphics or any other component to create a unique layout.
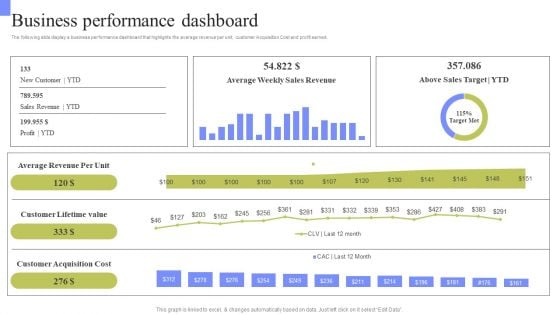
Periodic Revenue Model Business Performance Dashboard Rules PDF
The following slide display a business performance dashboard that highlights the average revenue per unit, customer Acquisition Cost and profit earned. This Periodic Revenue Model Business Performance Dashboard Rules PDF from Slidegeeks makes it easy to present information on your topic with precision. It provides customization options, so you can make changes to the colors, design, graphics, or any other component to create a unique layout. It is also available for immediate download, so you can begin using it right away. Slidegeeks has done good research to ensure that you have everything you need to make your presentation stand out. Make a name out there for a brilliant performance.
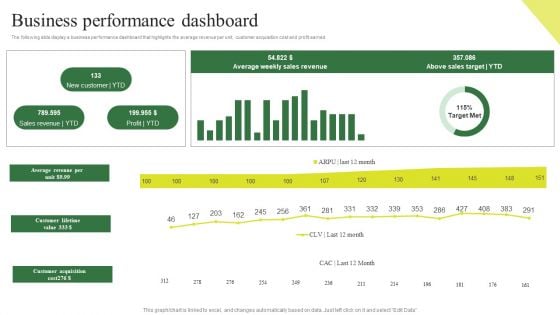
Consumption Based Pricing Model Business Performance Dashboard Demonstration PDF
The following slide display a business performance dashboard that highlights the average revenue per unit, customer acquisition cost and profit earned. Crafting an eye catching presentation has never been more straightforward. Let your presentation shine with this tasteful yet straightforward Consumption Based Pricing Model Business Performance Dashboard Demonstration PDF template. It offers a minimalistic and classy look that is great for making a statement. The colors have been employed intelligently to add a bit of playfulness while still remaining professional. Construct the ideal Consumption Based Pricing Model Business Performance Dashboard Demonstration PDF that effortlessly grabs the attention of your audience. Begin now and be certain to wow your customers.
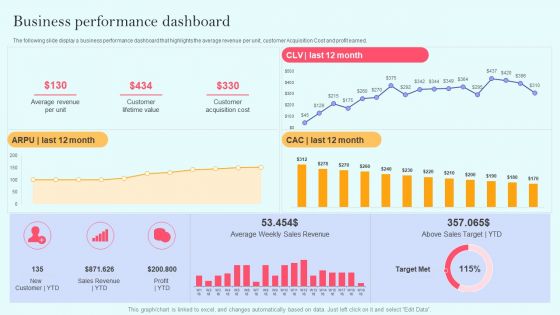
Recurring Income Generation Model Business Performance Dashboard Clipart PDF
The following slide display a business performance dashboard that highlights the average revenue per unit, customer Acquisition Cost and profit earned. Crafting an eye catching presentation has never been more straightforward. Let your presentation shine with this tasteful yet straightforward Recurring Income Generation Model Business Performance Dashboard Clipart PDF template. It offers a minimalistic and classy look that is great for making a statement. The colors have been employed intelligently to add a bit of playfulness while still remaining professional. Construct the ideal Recurring Income Generation Model Business Performance Dashboard Clipart PDF that effortlessly grabs the attention of your audience. Begin now and be certain to wow your customers.
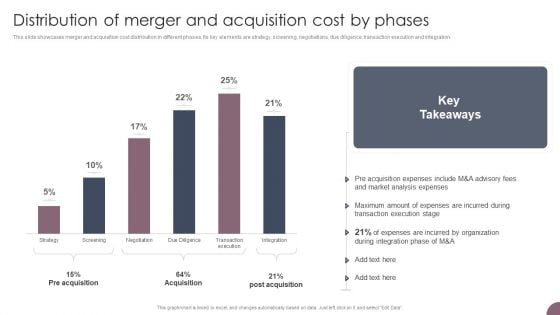
International Business Extension Distribution Of Merger And Acquisition Cost By Phases Themes PDF
This slide showcases merger and acquisition cost distribution in different phases. Its key elements are strategy, screening, negotiations, due diligence, transaction execution and integration. Make sure to capture your audiences attention in your business displays with our gratis customizable International Business Extension Distribution Of Merger And Acquisition Cost By Phases Themes PDF. These are great for business strategies, office conferences, capital raising or task suggestions. If you desire to acquire more customers for your tech business and ensure they stay satisfied, create your own sales presentation with these plain slides.
Assessing International Market Distribution Of Merger And Acquisition Cost By Phases Icons PDF
This slide showcases merger and acquisition cost distribution in different phases. Its key elements are strategy, screening, negotiations, due diligence, transaction execution and integration. Make sure to capture your audiences attention in your business displays with our gratis customizable Assessing International Market Distribution Of Merger And Acquisition Cost By Phases Icons PDF. These are great for business strategies, office conferences, capital raising or task suggestions. If you desire to acquire more customers for your tech business and ensure they stay satisfied, create your own sales presentation with these plain slides.
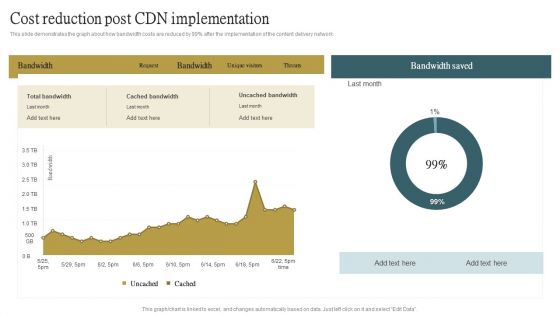
Cloud Content Delivery Network Cost Reduction Post CDN Implementation Themes PDF
This slide demonstrates the graph about how bandwidth costs are reduced by 99 percent after the implementation of the content delivery network. This Cloud Content Delivery Network Cost Reduction Post CDN Implementation Themes PDF from Slidegeeks makes it easy to present information on your topic with precision. It provides customization options, so you can make changes to the colors, design, graphics, or any other component to create a unique layout. It is also available for immediate download, so you can begin using it right away. Slidegeeks has done good research to ensure that you have everything you need to make your presentation stand out. Make a name out there for a brilliant performance.
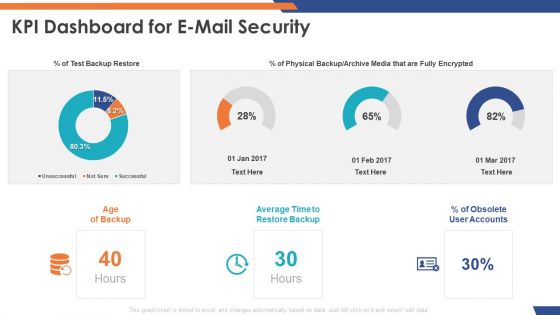
Email Security Market Research Report KPI Dashboard For E Mail Security Graphics PDF
Presenting this set of slides with name email security market research report kpi dashboard for e mail security graphics pdf. The topics discussed in these slides are test backup restore, physical backup or archive media that are fully encrypted, obsolete user accounts, average time to restore backup. This is a completely editable PowerPoint presentation and is available for immediate download. Download now and impress your audience.
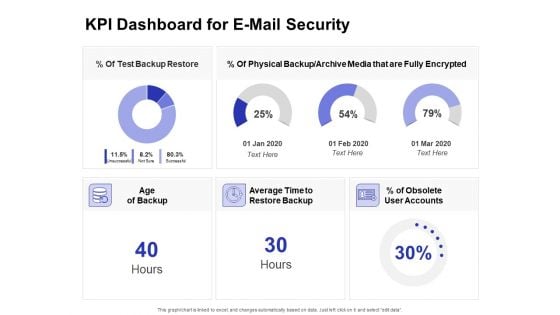
Global Cloud Based Email Security Market KPI Dashboard For E Mail Security Ideas PDF
Presenting this set of slides with name global cloud based email security market kpi dashboard for e mail security ideas pdf. The topics discussed in these slides are test backup restore, physical backup or archive media that are fully encrypted, obsolete user accounts, average time to restore backup. This is a completely editable PowerPoint presentation and is available for immediate download. Download now and impress your audience.
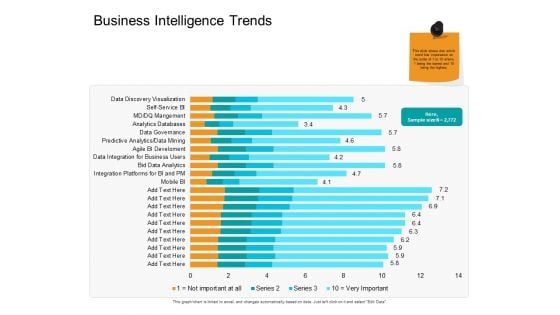
Facts Assessment Business Intelligence Trends Ppt PowerPoint Presentation Infographics Examples PDF
Presenting this set of slides with name facts assessment business intelligence trends ppt powerpoint presentation infographics examples pdf. The topics discussed in these slides are mobile bi, integration platforms bi and pm, bid data analytics, data integration for business users, agile bi development, predictive analytics, data mining, data governance, analytics databases. This is a completely editable PowerPoint presentation and is available for immediate download. Download now and impress your audience.
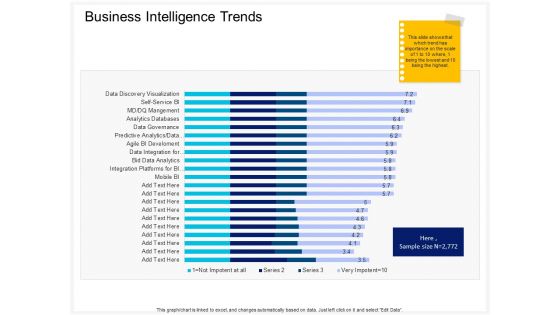
Enterprise Problem Solving And Intellect Business Intelligence Trends Ppt PowerPoint Presentation Styles Graphics PDF
Presenting this set of slides with name enterprise problem solving and intellect business intelligence trends ppt powerpoint presentation styles graphics pdf. The topics discussed in these slides are mobile bi, integration platforms bi and pm, bid data analytics, data integration for business users, agile bi development, predictive analytics, data mining, data governance, analytics databases. This is a completely editable PowerPoint presentation and is available for immediate download. Download now and impress your audience.

Firm Productivity Administration Business Intelligence Trends Ppt PowerPoint Presentation Outline Ideas PDF
Presenting this set of slides with name firm productivity administration business intelligence trends ppt powerpoint presentation outline ideas pdf. The topics discussed in these slides are mobile bi, integration platforms bi and pm, bid data analytics, data integration for business users, agile bi development, predictive analytics, data mining, data governance, analytics databases. This is a completely editable PowerPoint presentation and is available for immediate download. Download now and impress your audience.
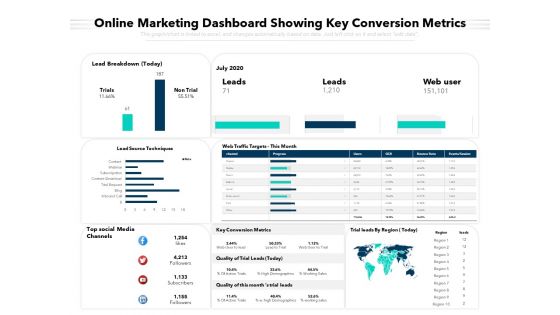
Online Marketing Dashboard Showing Key Conversion Metrics Ppt PowerPoint Presentation Outline Example Topics PDF
Pitch your topic with ease and precision using this online marketing dashboard showing key conversion metrics ppt powerpoint presentation outline example topics pdf. This layout presents information on lead breakdown, leads, web user, top social media channels, key conversion metrics, trial leads by region. It is also available for immediate download and adjustment. So, changes can be made in the color, design, graphics or any other component to create a unique layout.
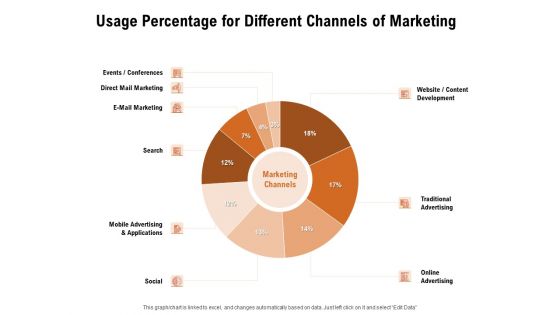
For Launching Company Site Usage Percentage For Different Channels Of Marketing Information PDF
Deliver an awe-inspiring pitch with this creative for launching company site usage percentage for different channels of marketing information pdf bundle. Topics like events, conferences, direct mail marketing, e mail marketing, search, mobile advertising and applications, social, website, content development, traditional advertising, online advertising can be discussed with this completely editable template. It is available for immediate download depending on the needs and requirements of the user.
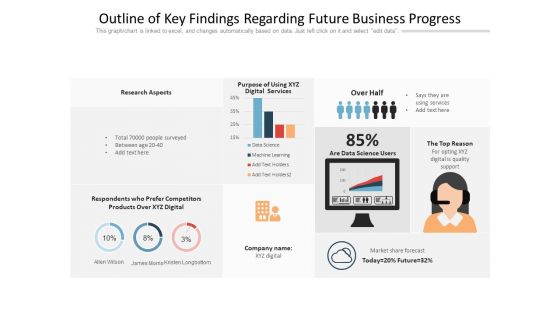
Outline Of Key Findings Regarding Future Business Progress Ppt PowerPoint Presentation Pictures Visuals PDF
Showcasing this set of slides titled outline of key findings regarding future business progress ppt powerpoint presentation pictures visuals pdf. The topics addressed in these templates are research aspects, respondents who prefer competitors products over xyz digital, purpose of using xyz digital services, over half, are data science users. All the content presented in this PPT design is completely editable. Download it and make adjustments in color, background, font etc. as per your unique business setting.
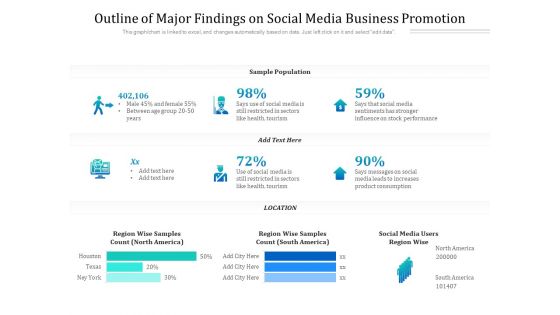
Outline Of Major Findings On Social Media Business Promotion Ppt PowerPoint Presentation Ideas Maker PDF
Pitch your topic with ease and precision using this outline of major findings on social media business promotion ppt powerpoint presentation ideas maker pdf. This layout presents information on region wise samples count, social media users region wise, sample population, location. It is also available for immediate download and adjustment. So, changes can be made in the color, design, graphics or any other component to create a unique layout.
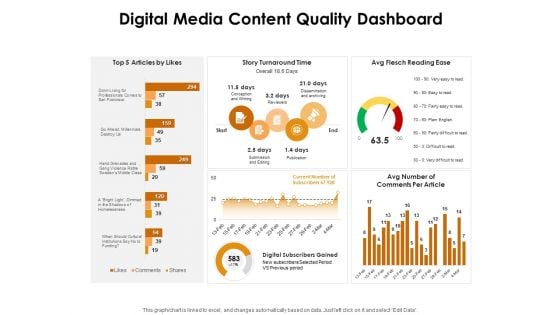
KPI Dashboards Per Industry Digital Media Content Quality Dashboard Ppt PowerPoint Presentation Layouts Clipart Images PDF
Deliver an awe-inspiring pitch with this creative kpi dashboards per industry digital media content quality dashboard ppt powerpoint presentation layouts clipart images pdf bundle. Topics like top 5 articles by likes, story turnaround time, avg flesch reading ease, avg number of comments per article can be discussed with this completely editable template. It is available for immediate download depending on the needs and requirements of the user.
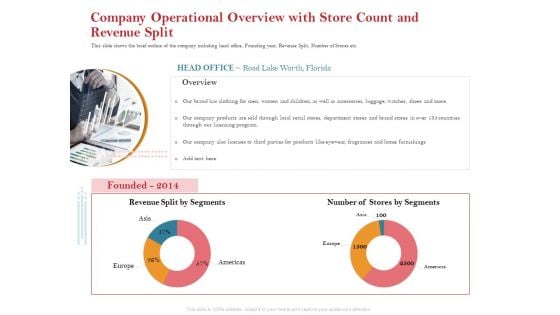
Pitch Deck For Raising Capital For Inorganic Growth Company Operational Overview With Store Count And Revenue Split Slides PDF
This slide shows the brief outline of the company including head office, Founding year, Revenue Split, Number of Stores etc. Deliver an awe inspiring pitch with this creative pitch deck for raising capital for inorganic growth company operational overview with store count and revenue split slides pdf bundle. Topics like company operational overview with store count and revenue split can be discussed with this completely editable template. It is available for immediate download depending on the needs and requirements of the user.
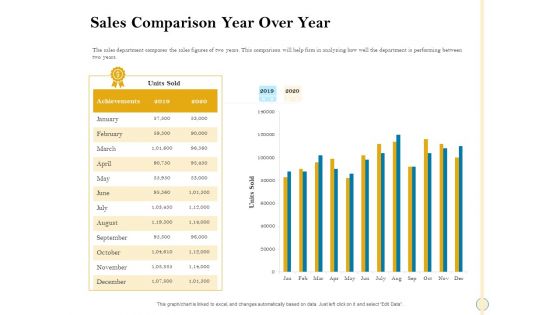
Sales Optimization Best Practices To Close More Deals Sales Comparison Year Over Year Structure PDF
The sales department compares the sales figures of two years. This comparison will help firm in analyzing how well the department is performing between two years. Deliver an awe inspiring pitch with this creative sales optimization best practices to close more deals sales comparison year over year structure pdf bundle. Topics like sales comparison year over year can be discussed with this completely editable template. It is available for immediate download depending on the needs and requirements of the user.
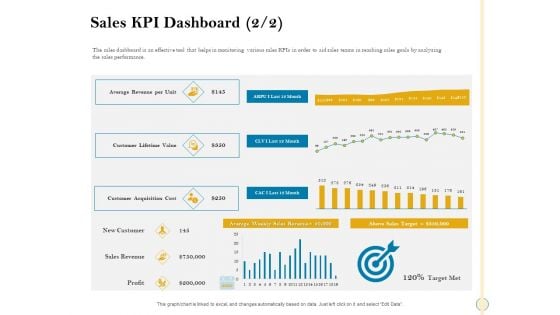
Sales Optimization Best Practices To Close More Deals Sales KPI Dashboard Revenue Diagrams PDF
The sales dashboard is an effective tool that helps in monitoring various sales KPIs in order to aid sales teams in reaching sales goals by analyzing the sales performance. Deliver an awe inspiring pitch with this creative sales optimization best practices to close more deals sales kpi dashboard revenue diagrams pdf bundle. Topics like sales kpi dashboard can be discussed with this completely editable template. It is available for immediate download depending on the needs and requirements of the user.
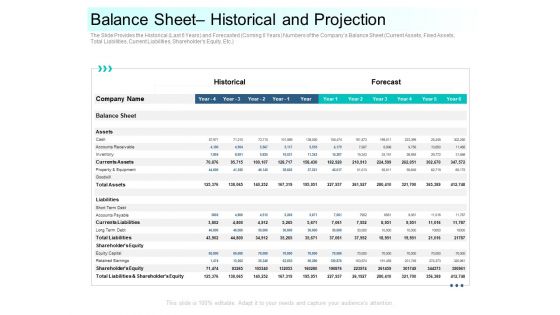
Community Capitalization Pitch Deck Balance Sheet Historical And Projection Formats Pdf
The Slide Provides the Historical Last 6 Years and Forecasted Coming 6 Years Numbers of the Companys Balance Sheet Current Assets, Fixed Assets, Total Liabilities, Current Liabilities, Shareholders Equity, Etc.Deliver an awe inspiring pitch with this creative community capitalization pitch deck balance sheet historical and projection formats pdf bundle. Topics like accounts payable, balance sheet historical and projection can be discussed with this completely editable template. It is available for immediate download depending on the needs and requirements of the user.
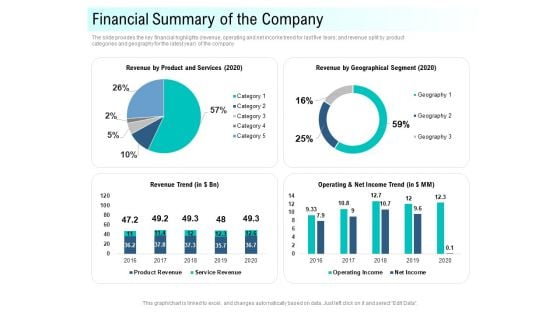
Community Capitalization Pitch Deck Financial Summary Of The Company Template Pdf
The slide provides the key financial highlights revenue, operating and net income trend for last five tears and revenue split by product categories and geography for the latest year of the company. Deliver an awe inspiring pitch with this creative community capitalization pitch deck financial summary of the company template pdf bundle. Topics like financial summary of the company can be discussed with this completely editable template. It is available for immediate download depending on the needs and requirements of the user.


 Continue with Email

 Home
Home


