Consumer Finance
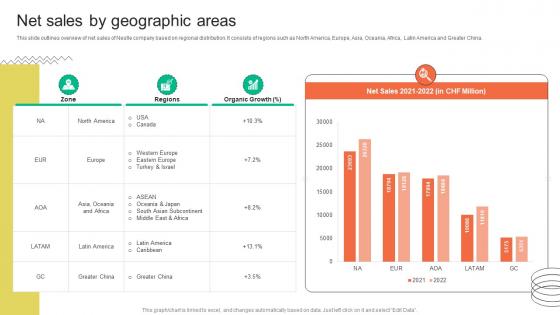
Net Sales By Geographic Areas FMCG Provider Company Profile CP SS V
This slide outlines overview of net sales of Nestle company based on regional distribution. It consists of regions such as North America, Europe, Asia, Oceania, Africa, Latin America and Greater China. Welcome to our selection of the Net Sales By Geographic Areas FMCG Provider Company Profile CP SS V. These are designed to help you showcase your creativity and bring your sphere to life. Planning and Innovation are essential for any business that is just starting out. This collection contains the designs that you need for your everyday presentations. All of our PowerPoints are 100 percent editable, so you can customize them to suit your needs. This multi-purpose template can be used in various situations. Grab these presentation templates today. This slide outlines overview of net sales of Nestle company based on regional distribution. It consists of regions such as North America, Europe, Asia, Oceania, Africa, Latin America and Greater China.

Online Payment Techniques Cashless Payment Market Share By Industries
Following slide demonstrates market share of cashless transactions by different industries which can be used by businesses to determine future prospects. It includes industries such as BFSI, healthcare, IT and telecom, media, retail, ecommerce, etc. Welcome to our selection of the Online Payment Techniques Cashless Payment Market Share By Industries. These are designed to help you showcase your creativity and bring your sphere to life. Planning and Innovation are essential for any business that is just starting out. This collection contains the designs that you need for your everyday presentations. All of our PowerPoints are 100Percent editable, so you can customize them to suit your needs. This multi-purpose template can be used in various situations. Grab these presentation templates today. Following slide demonstrates market share of cashless transactions by different industries which can be used by businesses to determine future prospects. It includes industries such as BFSI, healthcare, IT and telecom, media, retail, ecommerce, etc.
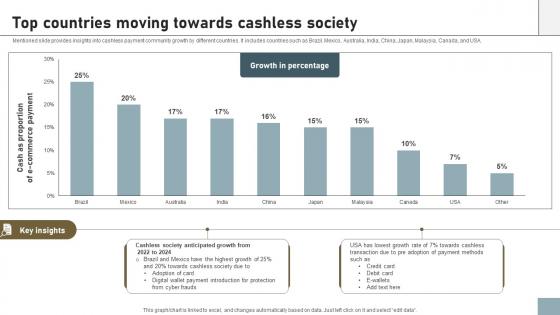
Online Payment Techniques Top Countries Moving Towards Cashless Society
Mentioned slide provides insights into cashless payment community growth by different countries. It includes countries such as Brazil, Mexico, Australia, India, China, Japan, Malaysia, Canada, and USA. Welcome to our selection of the Online Payment Techniques Top Countries Moving Towards Cashless Society. These are designed to help you showcase your creativity and bring your sphere to life. Planning and Innovation are essential for any business that is just starting out. This collection contains the designs that you need for your everyday presentations. All of our PowerPoints are 100Percent editable, so you can customize them to suit your needs. This multi-purpose template can be used in various situations. Grab these presentation templates today. Mentioned slide provides insights into cashless payment community growth by different countries. It includes countries such as Brazil, Mexico, Australia, India, China, Japan, Malaysia, Canada, and USA.
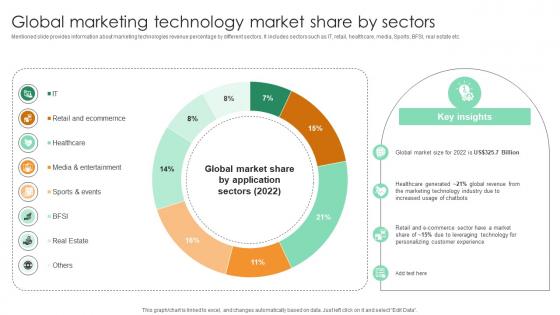
Global Marketing Technology Market Share By Sectors Comprehensive Guide For Marketing Technology
Mentioned slide provides information about marketing technologies revenue percentage by different sectors. It includes sectors such as IT, retail, healthcare, media, Sports, BFSI, real estate etc. This Global Marketing Technology Market Share By Sectors Comprehensive Guide For Marketing Technology from Slidegeeks makes it easy to present information on your topic with precision. It provides customization options, so you can make changes to the colors, design, graphics, or any other component to create a unique layout. It is also available for immediate download, so you can begin using it right away. Slidegeeks has done good research to ensure that you have everything you need to make your presentation stand out. Make a name out there for a brilliant performance. Mentioned slide provides information about marketing technologies revenue percentage by different sectors. It includes sectors such as IT, retail, healthcare, media, Sports, BFSI, real estate etc.
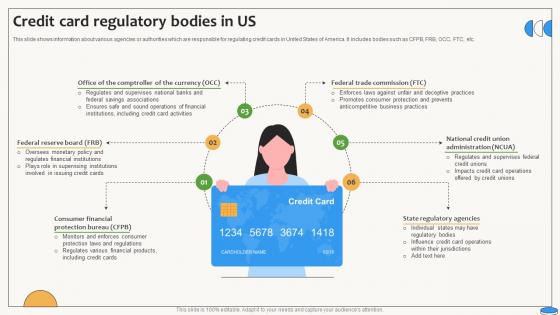
Credit Card Regulatory Bodies In US Swipe Smartly A Practical Guide Fin SS V
This slide shows information about various agencies or authorities which are responsible for regulating credit cards in United States of America. It includes bodies such as CFPB, FRB, OCC, FTC, etc. Crafting an eye-catching presentation has never been more straightforward. Let your presentation shine with this tasteful yet straightforward Credit Card Regulatory Bodies In US Swipe Smartly A Practical Guide Fin SS V template. It offers a minimalistic and classy look that is great for making a statement. The colors have been employed intelligently to add a bit of playfulness while still remaining professional. Construct the ideal Credit Card Regulatory Bodies In US Swipe Smartly A Practical Guide Fin SS V that effortlessly grabs the attention of your audience Begin now and be certain to wow your customers This slide shows information about various agencies or authorities which are responsible for regulating credit cards in United States of America. It includes bodies such as CFPB, FRB, OCC, FTC, etc.
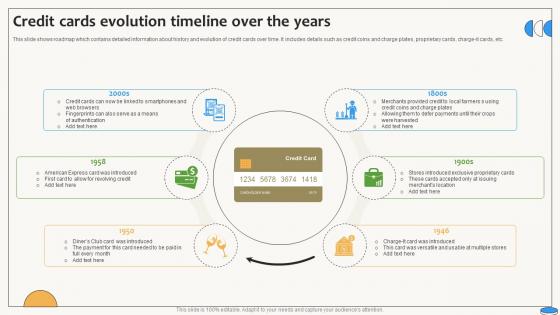
Credit Cards Evolution Timeline Over The Years Swipe Smartly A Practical Guide Fin SS V
This slide shows roadmap which contains detailed information about history and evolution of credit cards over time. It includes details such as credit coins and charge plates, proprietary cards, charge-it cards, etc. Make sure to capture your audiences attention in your business displays with our gratis customizable Credit Cards Evolution Timeline Over The Years Swipe Smartly A Practical Guide Fin SS V. These are great for business strategies, office conferences, capital raising or task suggestions. If you desire to acquire more customers for your tech business and ensure they stay satisfied, create your own sales presentation with these plain slides. This slide shows roadmap which contains detailed information about history and evolution of credit cards over time. It includes details such as credit coins and charge plates, proprietary cards, charge-it cards, etc.
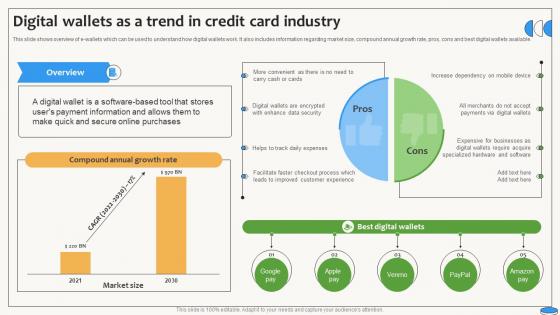
Digital Wallets As A Trend In Credit Card Industry Swipe Smartly A Practical Guide Fin SS V
This slide shows overview of e-wallets which can be used to understand how digital wallets work. It also includes information regarding market size, compound annual growth rate, pros, cons and best digital wallets available. This modern and well-arranged Digital Wallets As A Trend In Credit Card Industry Swipe Smartly A Practical Guide Fin SS V provides lots of creative possibilities. It is very simple to customize and edit with the Powerpoint Software. Just drag and drop your pictures into the shapes. All facets of this template can be edited with Powerpoint, no extra software is necessary. Add your own material, put your images in the places assigned for them, adjust the colors, and then you can show your slides to the world, with an animated slide included. This slide shows overview of e-wallets which can be used to understand how digital wallets work. It also includes information regarding market size, compound annual growth rate, pros, cons and best digital wallets available.
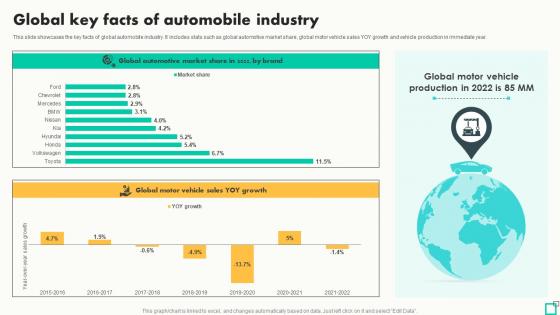
Global Key Facts Of Automobile Industry Innovative Tactics For Revving Up Strategy SS
This slide showcases the key facts of global automobile industry. It includes stats such as global automotive market share, global motor vehicle sales YOY growth and vehicle production in immediate year. Crafting an eye-catching presentation has never been more straightforward. Let your presentation shine with this tasteful yet straightforward Global Key Facts Of Automobile Industry Innovative Tactics For Revving Up Strategy SS template. It offers a minimalistic and classy look that is great for making a statement. The colors have been employed intelligently to add a bit of playfulness while still remaining professional. Construct the ideal Global Key Facts Of Automobile Industry Innovative Tactics For Revving Up Strategy SS that effortlessly grabs the attention of your audience Begin now and be certain to wow your customers This slide showcases the key facts of global automobile industry. It includes stats such as global automotive market share, global motor vehicle sales YOY growth and vehicle production in immediate year.
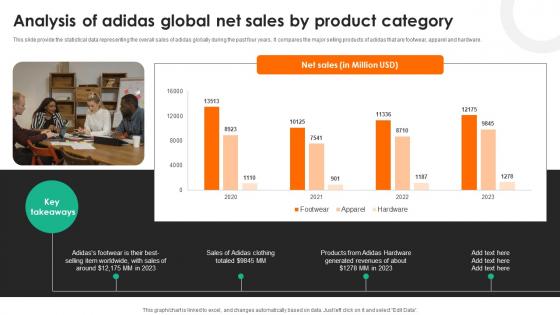
Evaluating Adidas Branding Analysis Of Adidas Global Net Sales By Product Category Strategy SS V
This slide provide the statistical data representing the overall sales of Adidas globally during the past four years. It compares the major selling products of Adidas that are footwear, apparel and hardware. Make sure to capture your audiences attention in your business displays with our gratis customizable Evaluating Adidas Branding Analysis Of Adidas Global Net Sales By Product Category Strategy SS V. These are great for business strategies, office conferences, capital raising or task suggestions. If you desire to acquire more customers for your tech business and ensure they stay satisfied, create your own sales presentation with these plain slides. This slide provide the statistical data representing the overall sales of Adidas globally during the past four years. It compares the major selling products of Adidas that are footwear, apparel and hardware.
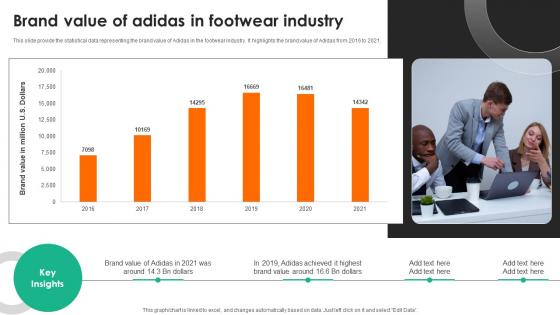
Evaluating Adidas Branding Brand Value Of Adidas In Footwear Industry Strategy SS V
This slide provide the statistical data representing the brand value of Adidas in the footwear industry. It highlights the brand value of Adidas from 2016 to 2021. This modern and well-arranged Evaluating Adidas Branding Brand Value Of Adidas In Footwear Industry Strategy SS V provides lots of creative possibilities. It is very simple to customize and edit with the Powerpoint Software. Just drag and drop your pictures into the shapes. All facets of this template can be edited with Powerpoint, no extra software is necessary. Add your own material, put your images in the places assigned for them, adjust the colors, and then you can show your slides to the world, with an animated slide included. This slide provide the statistical data representing the brand value of Adidas in the footwear industry. It highlights the brand value of Adidas from 2016 to 2021.
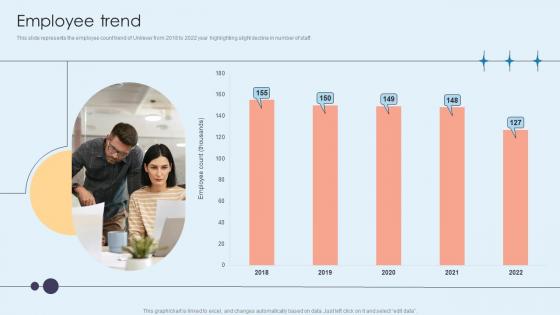
Employee Trend Home Care Solutions Company Profile CP SS V
This slide represents the employee count trend of Unilever from 2018 to 2022 year highlighting slight decline in number of staff.Crafting an eye-catching presentation has never been more straightforward. Let your presentation shine with this tasteful yet straightforward Employee Trend Home Care Solutions Company Profile CP SS V template. It offers a minimalistic and classy look that is great for making a statement. The colors have been employed intelligently to add a bit of playfulness while still remaining professional. Construct the ideal Employee Trend Home Care Solutions Company Profile CP SS V that effortlessly grabs the attention of your audience Begin now and be certain to wow your customers This slide represents the employee count trend of Unilever from 2018 to 2022 year highlighting slight decline in number of staff.
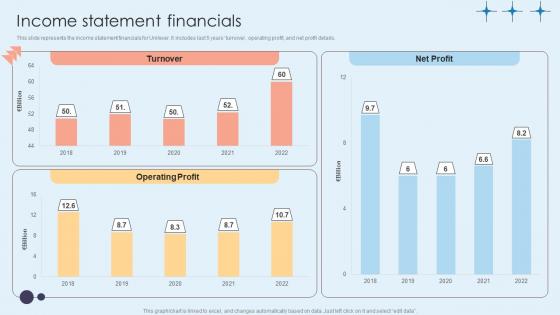
Income Statement Financials Home Care Solutions Company Profile CP SS V
This slide represents the income statement financials for Unilever. It includes last 5 yearsturnover, operating profit, and net profit details.Welcome to our selection of the Income Statement Financials Home Care Solutions Company Profile CP SS V. These are designed to help you showcase your creativity and bring your sphere to life. Planning and Innovation are essential for any business that is just starting out. This collection contains the designs that you need for your everyday presentations. All of our PowerPoints are 100 percent editable, so you can customize them to suit your needs. This multi-purpose template can be used in various situations. Grab these presentation templates today. This slide represents the income statement financials for Unilever. It includes last 5 yearsturnover, operating profit, and net profit details.

Compound Annual Growth Rate CAGR Of Application Security Testing
This slide depicts the market growth of application security by software tools such as white-box testing, black-box testing, etc. Crafting an eye-catching presentation has never been more straightforward. Let your presentation shine with this tasteful yet straightforward Compound Annual Growth Rate CAGR Of Application Security Testing template. It offers a minimalistic and classy look that is great for making a statement. The colors have been employed intelligently to add a bit of playfulness while still remaining professional. Construct the ideal Compound Annual Growth Rate CAGR Of Application Security Testing that effortlessly grabs the attention of your audience Begin now and be certain to wow your customers This slide depicts the market growth of application security by software tools such as white-box testing, black-box testing, etc.
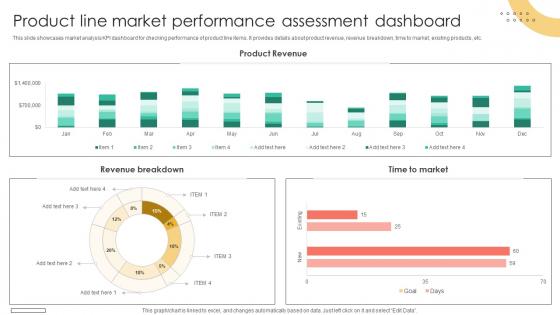
Brand Extension Techniques Product Line Market Performance Assessment Dashboard Strategy SS V
This slide showcases market analysis KPI dashboard for checking performance of product line items. It provides details about product revenue, revenue breakdown, time to market, existing products, etc. This Brand Extension Techniques Product Line Market Performance Assessment Dashboard Strategy SS V from Slidegeeks makes it easy to present information on your topic with precision. It provides customization options, so you can make changes to the colors, design, graphics, or any other component to create a unique layout. It is also available for immediate download, so you can begin using it right away. Slidegeeks has done good research to ensure that you have everything you need to make your presentation stand out. Make a name out there for a brilliant performance. This slide showcases market analysis KPI dashboard for checking performance of product line items. It provides details about product revenue, revenue breakdown, time to market, existing products, etc.
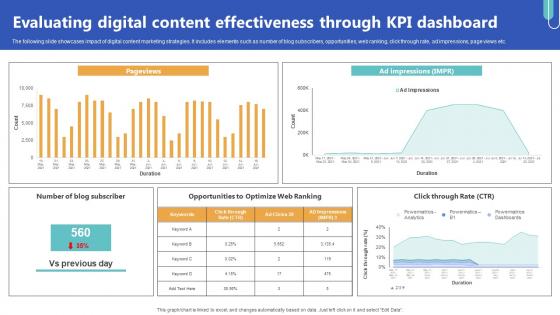
Evaluating Digital Content Effectiveness Through Top Of The Funnel Digital Content Strategy SS V
Crafting an eye-catching presentation has never been more straightforward. Let your presentation shine with this tasteful yet straightforward Evaluating Digital Content Effectiveness Through Top Of The Funnel Digital Content Strategy SS V template. It offers a minimalistic and classy look that is great for making a statement. The colors have been employed intelligently to add a bit of playfulness while still remaining professional. Construct the ideal Evaluating Digital Content Effectiveness Through Top Of The Funnel Digital Content Strategy SS V that effortlessly grabs the attention of your audience Begin now and be certain to wow your customers Our Evaluating Digital Content Effectiveness Through Top Of The Funnel Digital Content Strategy SS V are topically designed to provide an attractive backdrop to any subject. Use them to look like a presentation pro.
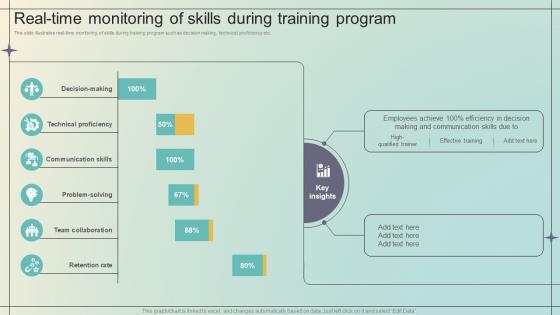
Immersive Training For Practical Real Time Monitoring Of Skills During Training Program DTE SS V
This slide illustrates real-time monitoring of skills during training program such as decision making, technical proficiency etc. This modern and well-arranged Immersive Training For Practical Real Time Monitoring Of Skills During Training Program DTE SS V provides lots of creative possibilities. It is very simple to customize and edit with the Powerpoint Software. Just drag and drop your pictures into the shapes. All facets of this template can be edited with Powerpoint, no extra software is necessary. Add your own material, put your images in the places assigned for them, adjust the colors, and then you can show your slides to the world, with an animated slide included. This slide illustrates real-time monitoring of skills during training program such as decision making, technical proficiency etc.
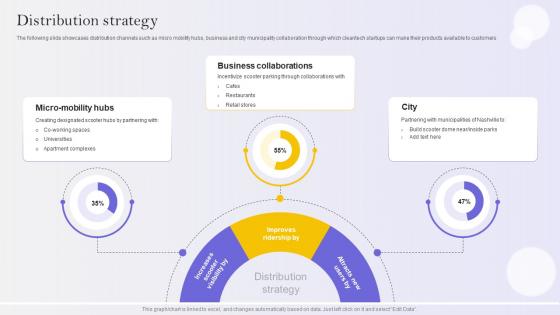
Distribution Strategy E Scooter Business Market Entry Strategy
The following slide showcases distribution channels such as micro mobility hubs, business and city municipality collaboration through which cleantech startups can make their products available to customersPresent like a pro with Distribution Strategy E Scooter Business Market Entry Strategy. Create beautiful presentations together with your team, using our easy-to-use presentation slides. Share your ideas in real-time and make changes on the fly by downloading our templates. So whether you are in the office, on the go, or in a remote location, you can stay in sync with your team and present your ideas with confidence. With Slidegeeks presentation got a whole lot easier. Grab these presentations today. The following slide showcases distribution channels such as micro mobility hubs, business and city municipality collaboration through which cleantech startups can make their products available to customers
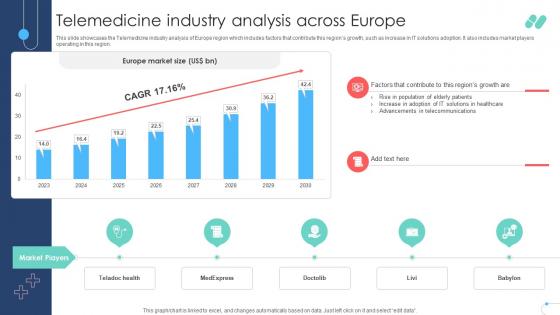
Telemedicine Industry Analysis Across Europe Remote Healthcare Services IR SS V
This slide showcases the Telemedicine industry analysis of Europe region which includes factors that contribute this regions growth, such as increase in IT solutions adoption. It also includes market players operating in this region. This Telemedicine Industry Analysis Across Europe Remote Healthcare Services IR SS V from Slidegeeks makes it easy to present information on your topic with precision. It provides customization options, so you can make changes to the colors, design, graphics, or any other component to create a unique layout. It is also available for immediate download, so you can begin using it right away. Slidegeeks has done good research to ensure that you have everything you need to make your presentation stand out. Make a name out there for a brilliant performance. This slide showcases the Telemedicine industry analysis of Europe region which includes factors that contribute this regions growth, such as increase in IT solutions adoption. It also includes market players operating in this region.
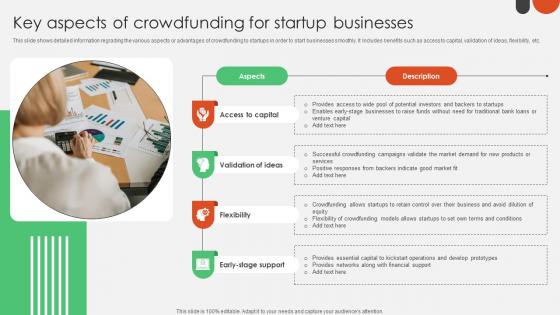
Key Aspects Of Crowdfunding For Startup Crowdfunding For Nonprofits To Support Fin SS V
This slide shows detailed information regrading the various aspects or advantages of crowdfunding to startups in order to start businesses smoothly. It Includes benefits such as access to capital, validation of ideas, flexibility, etc. Welcome to our selection of the Key Aspects Of Crowdfunding For Startup Crowdfunding For Nonprofits To Support Fin SS V. These are designed to help you showcase your creativity and bring your sphere to life. Planning and Innovation are essential for any business that is just starting out. This collection contains the designs that you need for your everyday presentations. All of our PowerPoints are 100Percent editable, so you can customize them to suit your needs. This multi-purpose template can be used in various situations. Grab these presentation templates today. This slide shows detailed information regrading the various aspects or advantages of crowdfunding to startups in order to start businesses smoothly. It Includes benefits such as access to capital, validation of ideas, flexibility, etc.
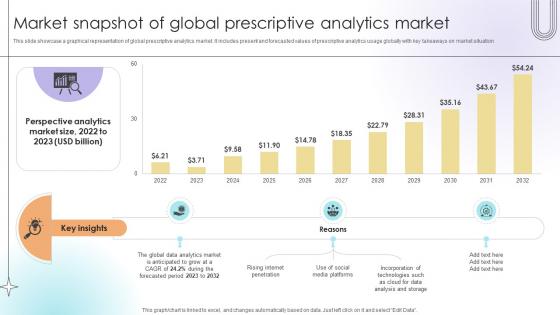
Market Snapshot Of Global Prescriptive Analytics Market Data Analytics SS V
This slide showcase a graphical representation of global prescriptive analytics market. It includes present and forecasted values of prescriptive analytics usage globally with key takeaways on market situation.Make sure to capture your audiences attention in your business displays with our gratis customizable Market Snapshot Of Global Prescriptive Analytics Market Data Analytics SS V. These are great for business strategies, office conferences, capital raising or task suggestions. If you desire to acquire more customers for your tech business and ensure they stay satisfied, create your own sales presentation with these plain slides. This slide showcase a graphical representation of global prescriptive analytics market. It includes present and forecasted values of prescriptive analytics usage globally with key takeaways on market situation.
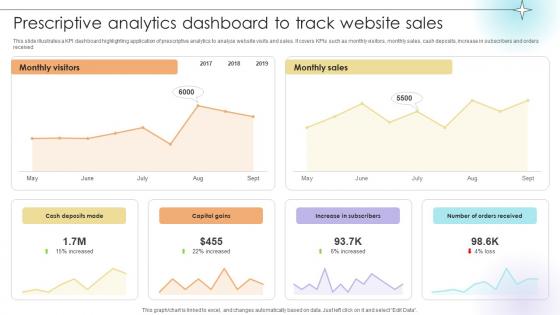
Prescriptive Analytics Dashboard To Track Website Sales Data Analytics SS V
This slide illustrates a KPI dashboard highlighting application of prescriptive analytics to analyze website visits and sales. It covers KPIs such as monthly visitors, monthly sales, cash deposits, increase in subscribers and orders received.This modern and well-arranged Prescriptive Analytics Dashboard To Track Website Sales Data Analytics SS V provides lots of creative possibilities. It is very simple to customize and edit with the Powerpoint Software. Just drag and drop your pictures into the shapes. All facets of this template can be edited with Powerpoint, no extra software is necessary. Add your own material, put your images in the places assigned for them, adjust the colors, and then you can show your slides to the world, with an animated slide included. This slide illustrates a KPI dashboard highlighting application of prescriptive analytics to analyze website visits and sales. It covers KPIs such as monthly visitors, monthly sales, cash deposits, increase in subscribers and orders received.

Step 7 Monitor Analytics Implementation For Inventory Using Dashboard Data Analytics SS V
This slide provides a dashboard highlighting inventory performance aimed at helping businesses streamline operations. It covers details on sales orders, invoices, order value, invoice amount, YTD invoice value and sales growth. Welcome to our selection of the Step 7 Monitor Analytics Implementation For Inventory Using Dashboard Data Analytics SS V. These are designed to help you showcase your creativity and bring your sphere to life. Planning and Innovation are essential for any business that is just starting out. This collection contains the designs that you need for your everyday presentations. All of our PowerPoints are 100 percent editable, so you can customize them to suit your needs. This multi-purpose template can be used in various situations. Grab these presentation templates today. This slide provides a dashboard highlighting inventory performance aimed at helping businesses streamline operations. It covers details on sales orders, invoices, order value, invoice amount, YTD invoice value and sales growth.
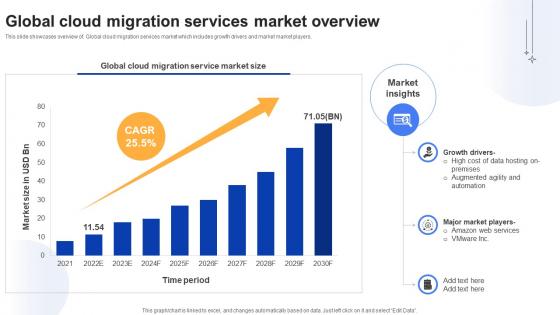
Effective Data Migration Global Cloud Migration Services Market Overview
This slide showcases overview of. Global cloud migration services market which includes growth drivers and market market players. This modern and well-arranged Effective Data Migration Global Cloud Migration Services Market Overview provides lots of creative possibilities. It is very simple to customize and edit with the Powerpoint Software. Just drag and drop your pictures into the shapes. All facets of this template can be edited with Powerpoint, no extra software is necessary. Add your own material, put your images in the places assigned for them, adjust the colors, and then you can show your slides to the world, with an animated slide included. This slide showcases overview of. Global cloud migration services market which includes growth drivers and market market players.

Effective Data Migration Multi Cloud Migration Progress Status Dashboard
This slide showcases dashboard to track application migration process to cloud platform using KPIs such as scheduled migrations, sources, project duration etc. This Effective Data Migration Multi Cloud Migration Progress Status Dashboard from Slidegeeks makes it easy to present information on your topic with precision. It provides customization options, so you can make changes to the colors, design, graphics, or any other component to create a unique layout. It is also available for immediate download, so you can begin using it right away. Slidegeeks has done good research to ensure that you have everything you need to make your presentation stand out. Make a name out there for a brilliant performance. This slide showcases dashboard to track application migration process to cloud platform using KPIs such as scheduled migrations, sources, project duration etc.
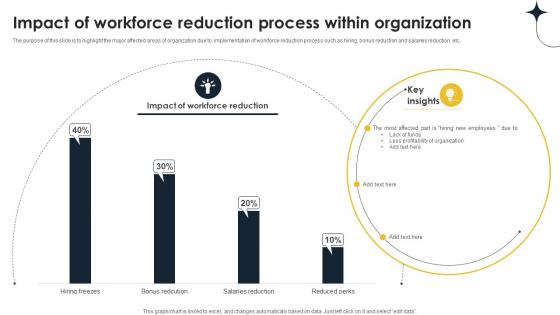
Impact Of Workforce Reduction Process Within Implementing Personnel Downsizing Initiative
The purpose of this slide is to highlight the major affected areas of organization due to implementation of workforce reduction process such as hiring, bonus reduction and salaries reduction, etc. Crafting an eye-catching presentation has never been more straightforward. Let your presentation shine with this tasteful yet straightforward Impact Of Workforce Reduction Process Within Implementing Personnel Downsizing Initiative template. It offers a minimalistic and classy look that is great for making a statement. The colors have been employed intelligently to add a bit of playfulness while still remaining professional. Construct the ideal Impact Of Workforce Reduction Process Within Implementing Personnel Downsizing Initiative that effortlessly grabs the attention of your audience Begin now and be certain to wow your customers The purpose of this slide is to highlight the major affected areas of organization due to implementation of workforce reduction process such as hiring, bonus reduction and salaries reduction, etc.
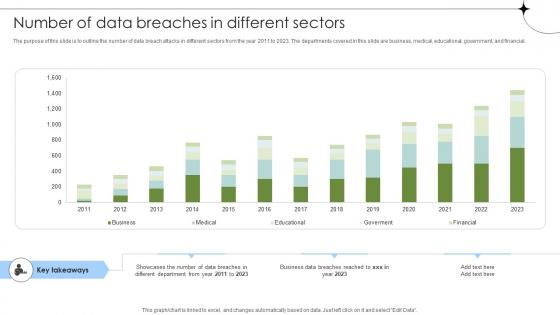
Number Of Data Breaches In Different Sectors Data Fortification Strengthening Defenses
The purpose of this slide is to outline the number of data breach attacks in different sectors from the year 2011 to 2023. The departments covered in this slide are business, medical, educational, government, and financial.This Number Of Data Breaches In Different Sectors Data Fortification Strengthening Defenses from Slidegeeks makes it easy to present information on your topic with precision. It provides customization options, so you can make changes to the colors, design, graphics, or any other component to create a unique layout. It is also available for immediate download, so you can begin using it right away. Slidegeeks has done good research to ensure that you have everything you need to make your presentation stand out. Make a name out there for a brilliant performance. The purpose of this slide is to outline the number of data breach attacks in different sectors from the year 2011 to 2023. The departments covered in this slide are business, medical, educational, government, and financial.
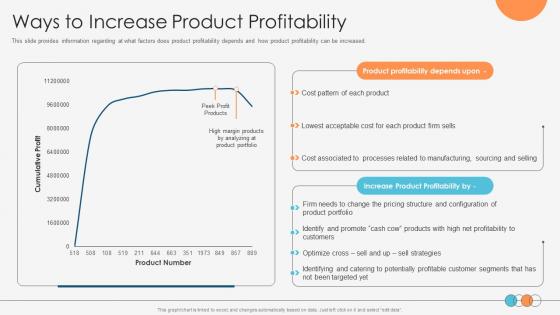
Enhancing Profitability Modelling Ways To Increase Product Profitability
This slide provides information regarding at what factors does product profitability depends and how product profitability can be increased. This modern and well-arranged Enhancing Profitability Modelling Ways To Increase Product Profitability provides lots of creative possibilities. It is very simple to customize and edit with the Powerpoint Software. Just drag and drop your pictures into the shapes. All facets of this template can be edited with Powerpoint, no extra software is necessary. Add your own material, put your images in the places assigned for them, adjust the colors, and then you can show your slides to the world, with an animated slide included. This slide provides information regarding at what factors does product profitability depends and how product profitability can be increased.
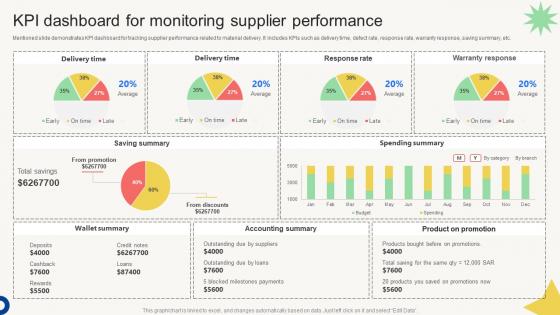
Vendor Management Audit KPI Dashboard For Monitoring Supplier Performance
Mentioned slide demonstrates KPI dashboard for tracking supplier performance related to material delivery. It includes KPIs such as delivery time, defect rate, response rate, warranty response, saving summary, etc. This modern and well-arranged Vendor Management Audit KPI Dashboard For Monitoring Supplier Performance provides lots of creative possibilities. It is very simple to customize and edit with the Powerpoint Software. Just drag and drop your pictures into the shapes. All facets of this template can be edited with Powerpoint, no extra software is necessary. Add your own material, put your images in the places assigned for them, adjust the colors, and then you can show your slides to the world, with an animated slide included. Mentioned slide demonstrates KPI dashboard for tracking supplier performance related to material delivery. It includes KPIs such as delivery time, defect rate, response rate, warranty response, saving summary, etc.
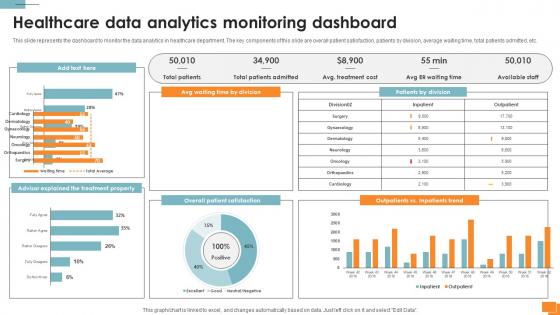
Statistical Tools For Evidence Healthcare Data Analytics Monitoring Dashboard
This slide represents the dashboard to monitor the data analytics in healthcare department. The key components of this slide are overall patient satisfaction, patients by division, average waiting time, total patients admitted, etc. Welcome to our selection of the Statistical Tools For Evidence Healthcare Data Analytics Monitoring Dashboard. These are designed to help you showcase your creativity and bring your sphere to life. Planning and Innovation are essential for any business that is just starting out. This collection contains the designs that you need for your everyday presentations. All of our PowerPoints are 100Percent editable, so you can customize them to suit your needs. This multi-purpose template can be used in various situations. Grab these presentation templates today. This slide represents the dashboard to monitor the data analytics in healthcare department. The key components of this slide are overall patient satisfaction, patients by division, average waiting time, total patients admitted, etc.
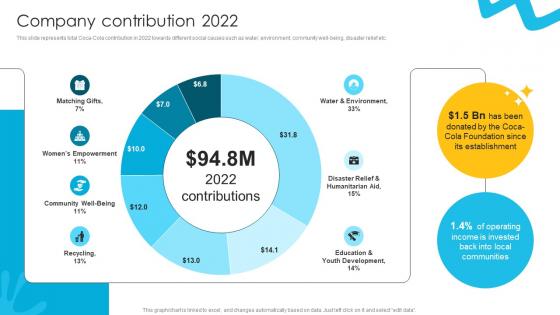
Company Contribution 2022 Liquid Refreshment Manufacturer Company Profile Ppt Template CP SS V
This slide represents total Coca-Cola contribution in 2022 towards different social causes such as water, environment, community well-being, disaster relief etc. Crafting an eye-catching presentation has never been more straightforward. Let your presentation shine with this tasteful yet straightforward Company Contribution 2022 Liquid Refreshment Manufacturer Company Profile Ppt Template CP SS V template. It offers a minimalistic and classy look that is great for making a statement. The colors have been employed intelligently to add a bit of playfulness while still remaining professional. Construct the ideal Company Contribution 2022 Liquid Refreshment Manufacturer Company Profile Ppt Template CP SS V that effortlessly grabs the attention of your audience Begin now and be certain to wow your customers This slide represents total Coca-Cola contribution in 2022 towards different social causes such as water, environment, community well-being, disaster relief etc.
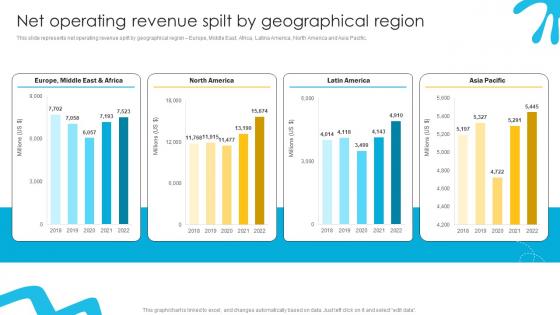
Net Operating Revenue Spilt By Liquid Refreshment Manufacturer Company Profile Ppt Example CP SS V
This slide represents net operating revenue spilt by geographical region Europe, Middle East, Africa, Latina America, North America and Asia Pacific. Crafting an eye-catching presentation has never been more straightforward. Let your presentation shine with this tasteful yet straightforward Net Operating Revenue Spilt By Liquid Refreshment Manufacturer Company Profile Ppt Example CP SS V template. It offers a minimalistic and classy look that is great for making a statement. The colors have been employed intelligently to add a bit of playfulness while still remaining professional. Construct the ideal Net Operating Revenue Spilt By Liquid Refreshment Manufacturer Company Profile Ppt Example CP SS V that effortlessly grabs the attention of your audience Begin now and be certain to wow your customers This slide represents net operating revenue spilt by geographical region Europe, Middle East, Africa, Latina America, North America and Asia Pacific.
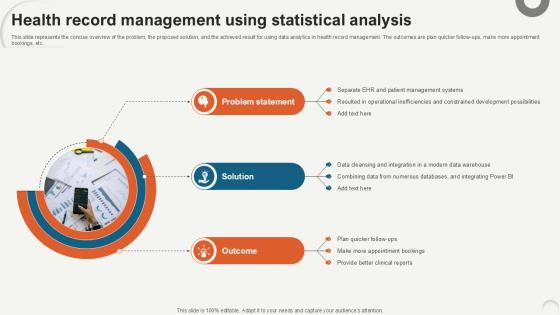
Health Record Management Using Data Analytics For Informed Decision Ppt Sample
This slide represents the concise overview of the problem, the proposed solution, and the achieved result for using data analytics in health record management. The outcomes are plan quicker follow-ups, make more appointment bookings, etc. Crafting an eye-catching presentation has never been more straightforward. Let your presentation shine with this tasteful yet straightforward Health Record Management Using Data Analytics For Informed Decision Ppt Sample template. It offers a minimalistic and classy look that is great for making a statement. The colors have been employed intelligently to add a bit of playfulness while still remaining professional. Construct the ideal Health Record Management Using Data Analytics For Informed Decision Ppt Sample that effortlessly grabs the attention of your audience Begin now and be certain to wow your customers This slide represents the concise overview of the problem, the proposed solution, and the achieved result for using data analytics in health record management. The outcomes are plan quicker follow-ups, make more appointment bookings, etc.
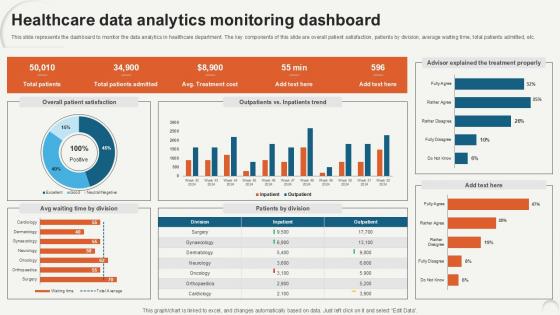
Healthcare Data Analytics Monitoring Data Analytics For Informed Decision Ppt PowerPoint
This slide represents the dashboard to monitor the data analytics in healthcare department. The key components of this slide are overall patient satisfaction, patients by division, average waiting time, total patients admitted, etc. Make sure to capture your audiences attention in your business displays with our gratis customizable Healthcare Data Analytics Monitoring Data Analytics For Informed Decision Ppt PowerPoint. These are great for business strategies, office conferences, capital raising or task suggestions. If you desire to acquire more customers for your tech business and ensure they stay satisfied, create your own sales presentation with these plain slides. This slide represents the dashboard to monitor the data analytics in healthcare department. The key components of this slide are overall patient satisfaction, patients by division, average waiting time, total patients admitted, etc.
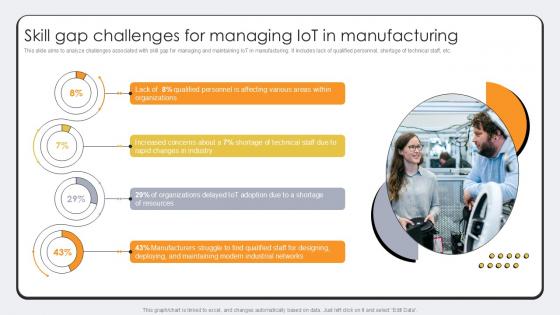
Skill Gap Challenges For Managing Revolutionizing Production IoT Ppt Sample
This slide aims to analyze challenges associated with skill gap for managing and maintaining IoT in manufacturing. It includes lack of qualified personnel, shortage of technical staff, etc. This Skill Gap Challenges For Managing Revolutionizing Production IoT Ppt Sample from Slidegeeks makes it easy to present information on your topic with precision. It provides customization options, so you can make changes to the colors, design, graphics, or any other component to create a unique layout. It is also available for immediate download, so you can begin using it right away. Slidegeeks has done good research to ensure that you have everything you need to make your presentation stand out. Make a name out there for a brilliant performance. This slide aims to analyze challenges associated with skill gap for managing and maintaining IoT in manufacturing. It includes lack of qualified personnel, shortage of technical staff, etc.

Financial Metrics Of Commercial Vehicles Luxury Automobile Vehicles PPT Slide CP SS V
This slide showcases the financial metrics of commercial vehicles. It includes metrics such as sales volume in units, revenue in crores, domestic market share and EBITDA percent and Y-O-Y growth. Make sure to capture your audiences attention in your business displays with our gratis customizable Financial Metrics Of Commercial Vehicles Luxury Automobile Vehicles PPT Slide CP SS V. These are great for business strategies, office conferences, capital raising or task suggestions. If you desire to acquire more customers for your tech business and ensure they stay satisfied, create your own sales presentation with these plain slides. This slide showcases the financial metrics of commercial vehicles. It includes metrics such as sales volume in units, revenue in crores, domestic market share and EBITDA percent and Y-O-Y growth.

Financial Metrics Of Passenger Vehicles Luxury Automobile Vehicles PPT Slide CP SS V
This slide showcases the financial metrics of passenger vehicles. It includes metrics such as sales volume in units, revenue in crores, market share and EBITDA percent and Y-O-Y growth. This modern and well-arranged Financial Metrics Of Passenger Vehicles Luxury Automobile Vehicles PPT Slide CP SS V provides lots of creative possibilities. It is very simple to customize and edit with the Powerpoint Software. Just drag and drop your pictures into the shapes. All facets of this template can be edited with Powerpoint, no extra software is necessary. Add your own material, put your images in the places assigned for them, adjust the colors, and then you can show your slides to the world, with an animated slide included. This slide showcases the financial metrics of passenger vehicles. It includes metrics such as sales volume in units, revenue in crores, market share and EBITDA percent and Y-O-Y growth.
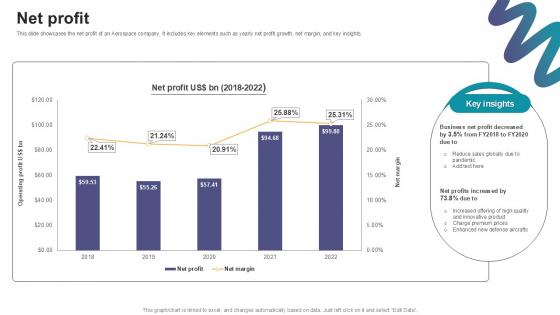
Net Profit Digital Marketings Strategies PPT PowerPoint CP SS V
This slide showcases the net profit of an Aerospace company. It includes key elements such as yearly net profit growth, net margin, and key insights. Welcome to our selection of the Net Profit Digital Marketings Strategies PPT PowerPoint CP SS V. These are designed to help you showcase your creativity and bring your sphere to life. Planning and Innovation are essential for any business that is just starting out. This collection contains the designs that you need for your everyday presentations. All of our PowerPoints are 100Percent editable, so you can customize them to suit your needs. This multi-purpose template can be used in various situations. Grab these presentation templates today. This slide showcases the net profit of an Aerospace company. It includes key elements such as yearly net profit growth, net margin, and key insights.
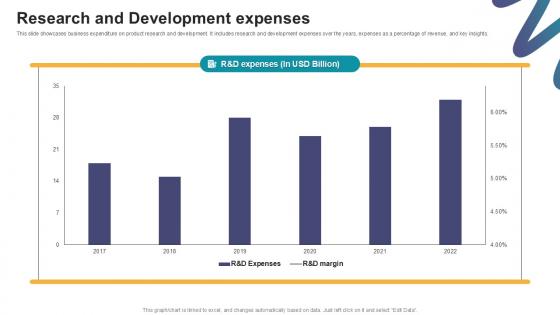
Research And Development Expenses Digital Marketings Strategies PPT PowerPoint CP SS V
This slide showcases business expenditure on product research and development. It includes research and development expenses over the years, expenses as a percentage of revenue, and key insights. This Research And Development Expenses Digital Marketings Strategies PPT PowerPoint CP SS V from Slidegeeks makes it easy to present information on your topic with precision. It provides customization options, so you can make changes to the colors, design, graphics, or any other component to create a unique layout. It is also available for immediate download, so you can begin using it right away. Slidegeeks has done good research to ensure that you have everything you need to make your presentation stand out. Make a name out there for a brilliant performance. This slide showcases business expenditure on product research and development. It includes research and development expenses over the years, expenses as a percentage of revenue, and key insights.
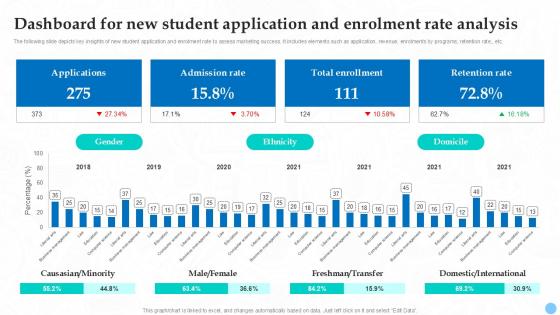
Dashboard For New Student Application Higher Education Ppt Sample Strategy SS V
The following slide depicts key insights of new student application and enrolment rate to assess marketing success. It includes elements such as application, revenue, enrolments by programs, retention rate, etc. Crafting an eye-catching presentation has never been more straightforward. Let your presentation shine with this tasteful yet straightforward Dashboard For New Student Application Higher Education Ppt Sample Strategy SS V template. It offers a minimalistic and classy look that is great for making a statement. The colors have been employed intelligently to add a bit of playfulness while still remaining professional. Construct the ideal Dashboard For New Student Application Higher Education Ppt Sample Strategy SS V that effortlessly grabs the attention of your audience Begin now and be certain to wow your customers The following slide depicts key insights of new student application and enrolment rate to assess marketing success. It includes elements such as application, revenue, enrolments by programs, retention rate, etc.
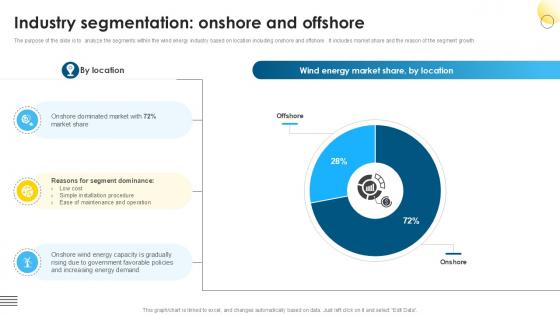
Industry Segmentation Onshore Global Wind Power Market PPT Template IR SS V
The purpose of the slide is to analyze the segments within the wind energy industry based on location including onshore and offshore . It includes market share and the reason of the segment growth. Make sure to capture your audiences attention in your business displays with our gratis customizable Industry Segmentation Onshore Global Wind Power Market PPT Template IR SS V. These are great for business strategies, office conferences, capital raising or task suggestions. If you desire to acquire more customers for your tech business and ensure they stay satisfied, create your own sales presentation with these plain slides. The purpose of the slide is to analyze the segments within the wind energy industry based on location including onshore and offshore . It includes market share and the reason of the segment growth.
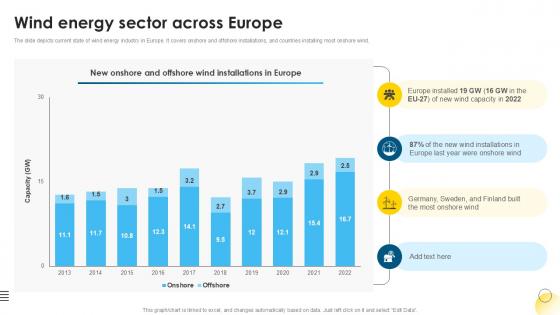
Wind Energy Sector Across Europe Global Wind Power Market PPT Sample IR SS V
The slide depicts current state of wind energy industry in Europe. It covers onshore and offshore installations, and countries installing most onshore wind. This modern and well-arranged Wind Energy Sector Across Europe Global Wind Power Market PPT Sample IR SS V provides lots of creative possibilities. It is very simple to customize and edit with the Powerpoint Software. Just drag and drop your pictures into the shapes. All facets of this template can be edited with Powerpoint, no extra software is necessary. Add your own material, put your images in the places assigned for them, adjust the colors, and then you can show your slides to the world, with an animated slide included. The slide depicts current state of wind energy industry in Europe. It covers onshore and offshore installations, and countries installing most onshore wind.
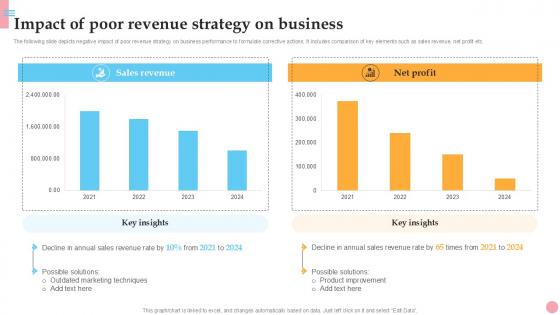
Impact Of Poor Revenue Strategy How To Improve Company PPT Presentation Strategy SS V
The following slide depicts negative impact of poor revenue strategy on business performance to formulate corrective actions. It includes comparison of key elements such as sales revenue, net profit etc. Make sure to capture your audiences attention in your business displays with our gratis customizable Impact Of Poor Revenue Strategy How To Improve Company PPT Presentation Strategy SS V. These are great for business strategies, office conferences, capital raising or task suggestions. If you desire to acquire more customers for your tech business and ensure they stay satisfied, create your own sales presentation with these plain slides. The following slide depicts negative impact of poor revenue strategy on business performance to formulate corrective actions. It includes comparison of key elements such as sales revenue, net profit etc.
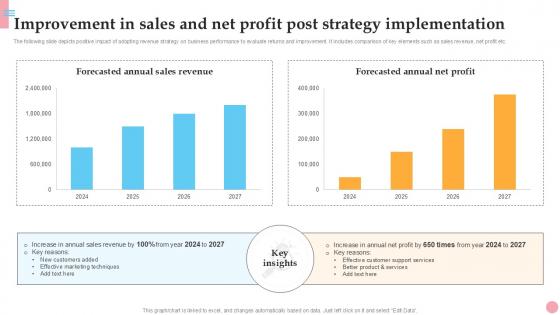
Improvement In Sales And Net Profit How To Improve Company PPT Template Strategy SS V
The following slide depicts positive impact of adopting revenue strategy on business performance to evaluate returns and improvement. It includes comparison of key elements such as sales revenue, net profit etc. This modern and well-arranged Improvement In Sales And Net Profit How To Improve Company PPT Template Strategy SS V provides lots of creative possibilities. It is very simple to customize and edit with the Powerpoint Software. Just drag and drop your pictures into the shapes. All facets of this template can be edited with Powerpoint, no extra software is necessary. Add your own material, put your images in the places assigned for them, adjust the colors, and then you can show your slides to the world, with an animated slide included. The following slide depicts positive impact of adopting revenue strategy on business performance to evaluate returns and improvement. It includes comparison of key elements such as sales revenue, net profit etc.
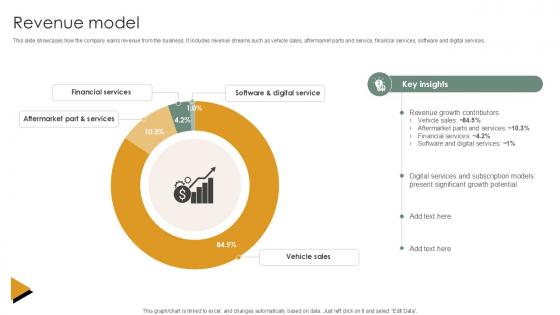
Revenue Model Vehicle Industry Business Model PPT Template BMC SS V
This slide showcases how the company earns revenue from the business. It includes revenue streams such as vehicle sales, aftermarket parts and service, financial services, software and digital services. This Revenue Model Vehicle Industry Business Model PPT Template BMC SS V from Slidegeeks makes it easy to present information on your topic with precision. It provides customization options, so you can make changes to the colors, design, graphics, or any other component to create a unique layout. It is also available for immediate download, so you can begin using it right away. Slidegeeks has done good research to ensure that you have everything you need to make your presentation stand out. Make a name out there for a brilliant performance. This slide showcases how the company earns revenue from the business. It includes revenue streams such as vehicle sales, aftermarket parts and service, financial services, software and digital services.
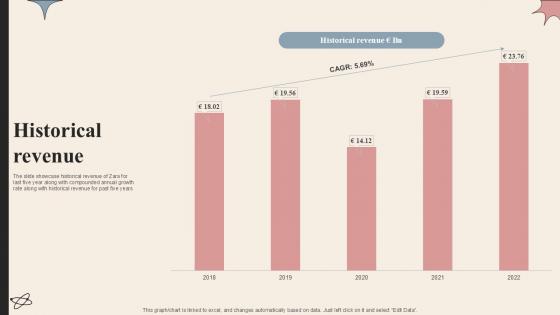
Historical Revenue Branded Clothing Company Profile PPT PowerPoint CP SS V
The slide showcase historical revenue of Zara for last five year along with compounded annual growth rate along with historical revenue for past five years. Crafting an eye-catching presentation has never been more straightforward. Let your presentation shine with this tasteful yet straightforward Historical Revenue Branded Clothing Company Profile PPT PowerPoint CP SS V template. It offers a minimalistic and classy look that is great for making a statement. The colors have been employed intelligently to add a bit of playfulness while still remaining professional. Construct the ideal Historical Revenue Branded Clothing Company Profile PPT PowerPoint CP SS V that effortlessly grabs the attention of your audience Begin now and be certain to wow your customers The slide showcase historical revenue of Zara for last five year along with compounded annual growth rate along with historical revenue for past five years.
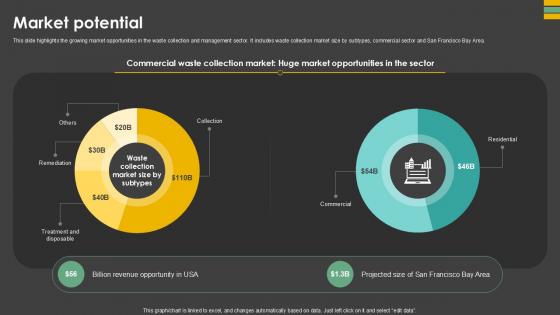
Market Potential Waste Control Platform Pitch Deck Ppt Slides
This slide highlights the growing market opportunities in the waste collection and management sector. It includes waste collection market size by subtypes, commercial sector and San Francisco Bay Area. Crafting an eye-catching presentation has never been more straightforward. Let your presentation shine with this tasteful yet straightforward Market Potential Waste Control Platform Pitch Deck Ppt Slides template. It offers a minimalistic and classy look that is great for making a statement. The colors have been employed intelligently to add a bit of playfulness while still remaining professional. Construct the ideal Market Potential Waste Control Platform Pitch Deck Ppt Slides that effortlessly grabs the attention of your audience Begin now and be certain to wow your customers This slide highlights the growing market opportunities in the waste collection and management sector. It includes waste collection market size by subtypes, commercial sector and San Francisco Bay Area.
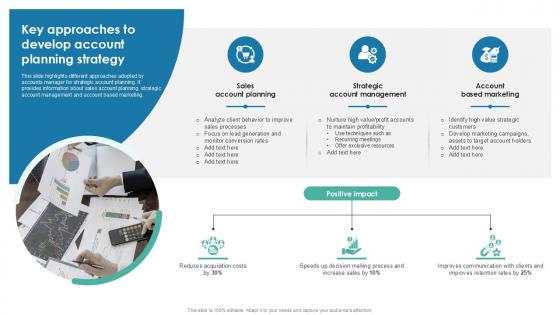
Key Approaches To Develop Account Planning Strategy PPT Example SS
This slide highlights different approaches adopted by accounts manager for strategic account planning. It provides information about sales account planning, strategic account management and account based marketing. Crafting an eye-catching presentation has never been more straightforward. Let your presentation shine with this tasteful yet straightforward Key Approaches To Develop Account Planning Strategy PPT Example SS template. It offers a minimalistic and classy look that is great for making a statement. The colors have been employed intelligently to add a bit of playfulness while still remaining professional. Construct the ideal Key Approaches To Develop Account Planning Strategy PPT Example SS that effortlessly grabs the attention of your audience Begin now and be certain to wow your customers This slide highlights different approaches adopted by accounts manager for strategic account planning. It provides information about sales account planning, strategic account management and account based marketing.
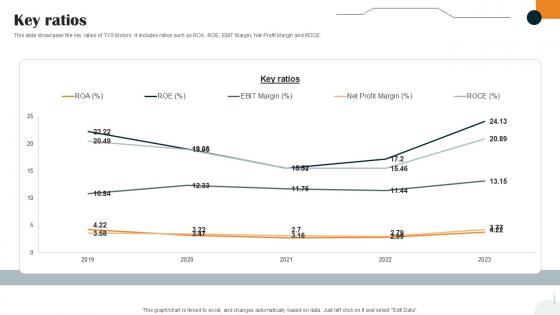
Key Ratios Vehicle Manufacturer Company Profile PPT Template CP SS V
This slide showcases the key ratios of TVS Motors. It includes ratios such as ROA, ROE, EBIT Margin, Net Profit Margin and ROCE. Crafting an eye-catching presentation has never been more straightforward. Let your presentation shine with this tasteful yet straightforward Key Ratios Vehicle Manufacturer Company Profile PPT Template CP SS V template. It offers a minimalistic and classy look that is great for making a statement. The colors have been employed intelligently to add a bit of playfulness while still remaining professional. Construct the ideal Key Ratios Vehicle Manufacturer Company Profile PPT Template CP SS V that effortlessly grabs the attention of your audience Begin now and be certain to wow your customers This slide showcases the key ratios of TVS Motors. It includes ratios such as ROA, ROE, EBIT Margin, Net Profit Margin and ROCE.
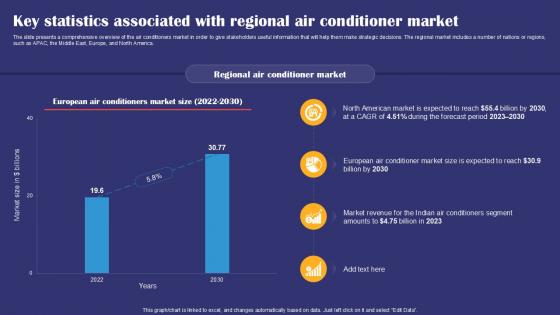
Key Statistics Associated With Regional Air Conditioner Smartphones Industry Report PPT Template IR SS V
The slide presents a comprehensive overview of the air conditioners market in order to give stakeholders useful information that will help them make strategic decisions. The regional market includes a number of nations or regions, such as APAC, the Middle East, Europe, and North America. Make sure to capture your audiences attention in your business displays with our gratis customizable Key Statistics Associated With Regional Air Conditioner Smartphones Industry Report PPT Template IR SS V. These are great for business strategies, office conferences, capital raising or task suggestions. If you desire to acquire more customers for your tech business and ensure they stay satisfied, create your own sales presentation with these plain slides. The slide presents a comprehensive overview of the air conditioners market in order to give stakeholders useful information that will help them make strategic decisions. The regional market includes a number of nations or regions, such as APAC, the Middle East, Europe, and North America.
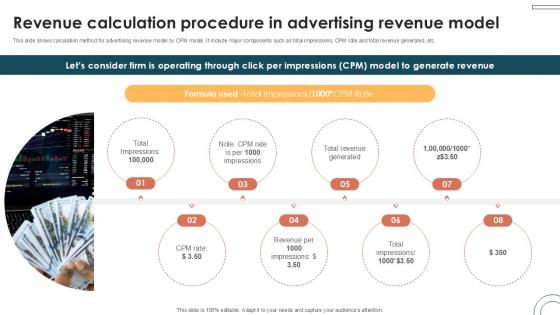
Revenue Calculation Procedure In Internet Based Trade Structure Ppt Slide
This slide shows calculation method for advertising revenue model by CPM model. It include major components such as total impressions, CPM rate and total revenue generated, etc. Make sure to capture your audiences attention in your business displays with our gratis customizable Revenue Calculation Procedure In Internet Based Trade Structure Ppt Slide. These are great for business strategies, office conferences, capital raising or task suggestions. If you desire to acquire more customers for your tech business and ensure they stay satisfied, create your own sales presentation with these plain slides. This slide shows calculation method for advertising revenue model by CPM model. It include major components such as total impressions, CPM rate and total revenue generated, etc.
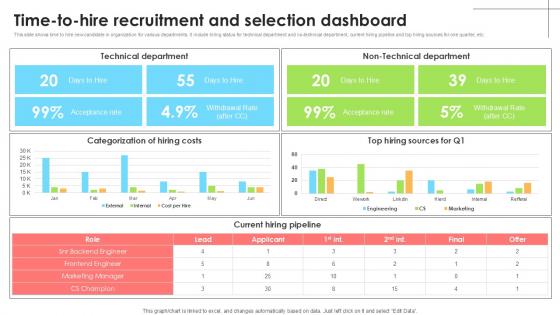
Time To Hire Recruitment And Selection Employee Attraction And Competency Ppt Sample
This slide shows time to hire new candidate in organization for various departments. It include hiring status for technical department and no-technical department, current hiring pipeline and top hiring sources for one quarter, etc. Welcome to our selection of the Time To Hire Recruitment And Selection Employee Attraction And Competency Ppt Sample. These are designed to help you showcase your creativity and bring your sphere to life. Planning and Innovation are essential for any business that is just starting out. This collection contains the designs that you need for your everyday presentations. All of our PowerPoints are 100Percent editable, so you can customize them to suit your needs. This multi-purpose template can be used in various situations. Grab these presentation templates today. This slide shows time to hire new candidate in organization for various departments. It include hiring status for technical department and no-technical department, current hiring pipeline and top hiring sources for one quarter, etc.
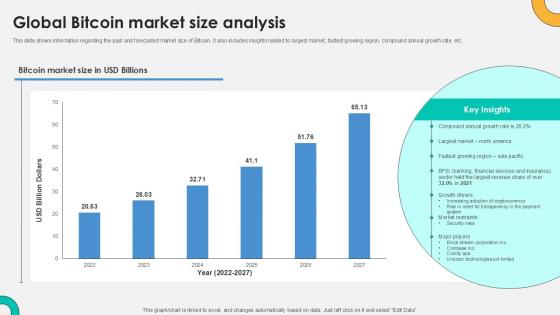
Global Bitcoin Market Size Analysis Everything About Bitcoin PPT PowerPoint Fin SS V
This slide shows information regarding the past and forecasted market size of Bitcoin. It also includes insights related to largest market, fastest growing region, compound annual growth rate, etc. Welcome to our selection of the Global Bitcoin Market Size Analysis Everything About Bitcoin PPT PowerPoint Fin SS V. These are designed to help you showcase your creativity and bring your sphere to life. Planning and Innovation are essential for any business that is just starting out. This collection contains the designs that you need for your everyday presentations. All of our PowerPoints are 100Percent editable, so you can customize them to suit your needs. This multi-purpose template can be used in various situations. Grab these presentation templates today. This slide shows information regarding the past and forecasted market size of Bitcoin. It also includes insights related to largest market, fastest growing region, compound annual growth rate, etc.
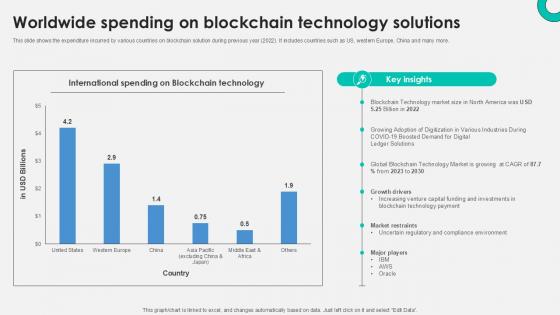
Worldwide Spending On Blockchain Everything About Bitcoin PPT Template Fin SS V
This slide shows the expenditure incurred by various countries on blockchain solution during previous year 2022. It includes countries such as US, western Europe, China and many more. Make sure to capture your audiences attention in your business displays with our gratis customizable Worldwide Spending On Blockchain Everything About Bitcoin PPT Template Fin SS V. These are great for business strategies, office conferences, capital raising or task suggestions. If you desire to acquire more customers for your tech business and ensure they stay satisfied, create your own sales presentation with these plain slides. This slide shows the expenditure incurred by various countries on blockchain solution during previous year 2022. It includes countries such as US, western Europe, China and many more.

Pharmaceutical Company Sales Analysis On Power BI Ppt Presentation SS
This Pharmaceutical Company Sales Analysis On Power BI Ppt Presentation SS from Slidegeeks makes it easy to present information on your topic with precision. It provides customization options, so you can make changes to the colors, design, graphics, or any other component to create a unique layout. It is also available for immediate download, so you can begin using it right away. Slidegeeks has done good research to ensure that you have everything you need to make your presentation stand out. Make a name out there for a brilliant performance. Our Pharmaceutical Company Sales Analysis On Power BI Ppt Presentation SS are topically designed to provide an attractive backdrop to any subject. Use them to look like a presentation pro.
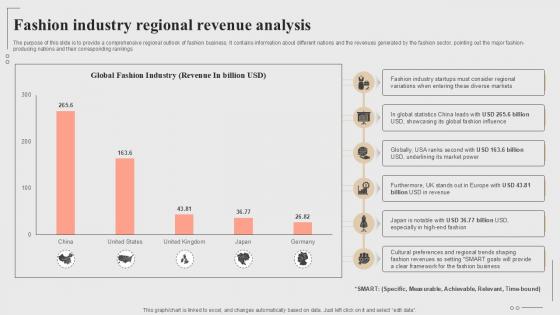
Fashion Industry Regional Revenue Analysis Fashion Startup Roadmap Plan Ppt Template BP SS V
The purpose of this slide is to provide a comprehensive regional outlook of fashion business. It contains information about different nations and the revenues generated by the fashion sector, pointing out the major fashion-producing nations and their corresponding rankings Make sure to capture your audiences attention in your business displays with our gratis customizable Fashion Industry Regional Revenue Analysis Fashion Startup Roadmap Plan Ppt Template BP SS V These are great for business strategies, office conferences, capital raising or task suggestions. If you desire to acquire more customers for your tech business and ensure they stay satisfied, create your own sales presentation with these plain slides. The purpose of this slide is to provide a comprehensive regional outlook of fashion business. It contains information about different nations and the revenues generated by the fashion sector, pointing out the major fashion-producing nations and their corresponding rankings
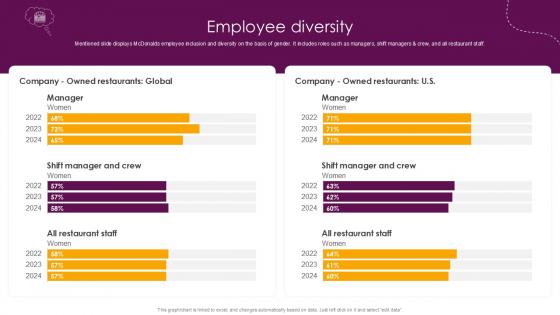
Employee Diversity Food And Beverages Company Profile Ppt Sample CP SS V
Mentioned slide displays McDonalds employee inclusion and diversity on the basis of gender. It includes roles such as managers, shift managers and crew, and all restaurant staff. Crafting an eye-catching presentation has never been more straightforward. Let your presentation shine with this tasteful yet straightforward Employee Diversity Food And Beverages Company Profile Ppt Sample CP SS V template. It offers a minimalistic and classy look that is great for making a statement. The colors have been employed intelligently to add a bit of playfulness while still remaining professional. Construct the ideal Employee Diversity Food And Beverages Company Profile Ppt Sample CP SS V that effortlessly grabs the attention of your audience Begin now and be certain to wow your customers Mentioned slide displays McDonalds employee inclusion and diversity on the basis of gender. It includes roles such as managers, shift managers and crew, and all restaurant staff.
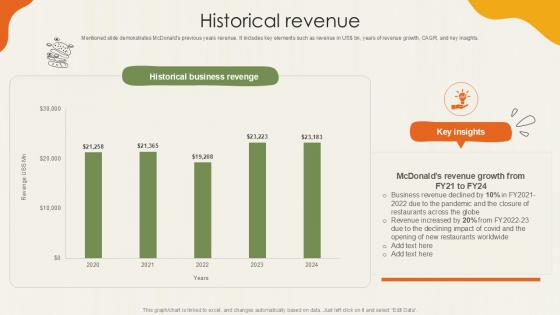
Historical Revenue Food Retailer Company Profile Ppt Presentation CP SS V
Mentioned slide demonstrates McDonalds previous years revenue. It includes key elements such as revenue in US doller bn, years of revenue growth, CAGR, and key insights. Crafting an eye-catching presentation has never been more straightforward. Let your presentation shine with this tasteful yet straightforward Historical Revenue Food Retailer Company Profile Ppt Presentation CP SS V template. It offers a minimalistic and classy look that is great for making a statement. The colors have been employed intelligently to add a bit of playfulness while still remaining professional. Construct the ideal Historical Revenue Food Retailer Company Profile Ppt Presentation CP SS V that effortlessly grabs the attention of your audience Begin now and be certain to wow your customers Mentioned slide demonstrates McDonalds previous years revenue. It includes key elements such as revenue in US doller bn, years of revenue growth, CAGR, and key insights.
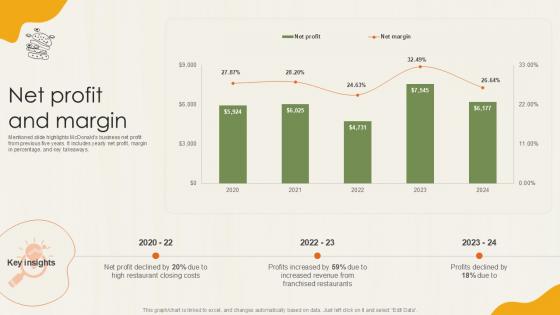
Net Profit And Margin Food Retailer Company Profile Ppt Sample CP SS V
Mentioned slide highlights McDonalds business net profit from previous five years. It includes yearly net profit, margin in percentage, and key takeaways. Welcome to our selection of the Net Profit And Margin Food Retailer Company Profile Ppt Sample CP SS V These are designed to help you showcase your creativity and bring your sphere to life. Planning and Innovation are essential for any business that is just starting out. This collection contains the designs that you need for your everyday presentations. All of our PowerPoints are 100Percent editable, so you can customize them to suit your needs. This multi-purpose template can be used in various situations. Grab these presentation templates today. Mentioned slide highlights McDonalds business net profit from previous five years. It includes yearly net profit, margin in percentage, and key takeaways.
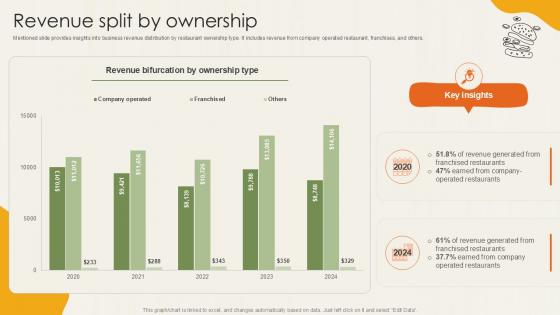
Revenue Split By Ownership Food Retailer Company Profile Ppt Template CP SS V
Mentioned slide provides insights into business revenue distribution by restaurant ownership type. It includes revenue from company operated restaurant, franchises, and others. This Revenue Split By Ownership Food Retailer Company Profile Ppt Template CP SS V from Slidegeeks makes it easy to present information on your topic with precision. It provides customization options, so you can make changes to the colors, design, graphics, or any other component to create a unique layout. It is also available for immediate download, so you can begin using it right away. Slidegeeks has done good research to ensure that you have everything you need to make your presentation stand out. Make a name out there for a brilliant performance. Mentioned slide provides insights into business revenue distribution by restaurant ownership type. It includes revenue from company operated restaurant, franchises, and others.
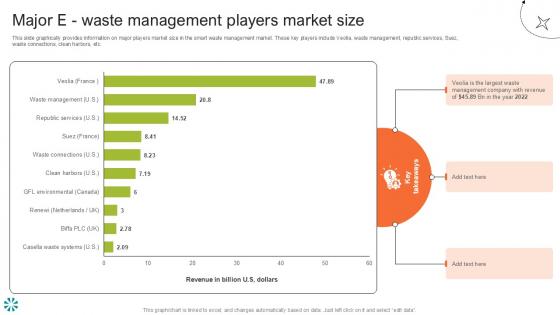
Major E Waste Management Step By Step Guide For Electronic Ppt Template
This slide graphically provides information on major players market size in the smart waste management market. These key players include Veolia, waste management, republic services, Suez, waste connections, clean harbors, etc.Welcome to our selection of the Major E Waste Management Step By Step Guide For Electronic Ppt Template. These are designed to help you showcase your creativity and bring your sphere to life. Planning and Innovation are essential for any business that is just starting out. This collection contains the designs that you need for your everyday presentations. All of our PowerPoints are 100Percent editable, so you can customize them to suit your needs. This multi-purpose template can be used in various situations. Grab these presentation templates today. This slide graphically provides information on major players market size in the smart waste management market. These key players include Veolia, waste management, republic services, Suez, waste connections, clean harbors, etc.


 Continue with Email

 Home
Home


