Continuum Graphic
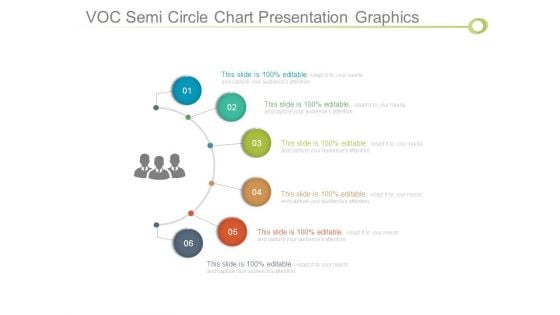
Voc Semi Circle Chart Presentation Graphics
This is a voc semi circle chart presentation graphics. This is a six stage process. The stages in this process are business, marketing, management, success, diagram.
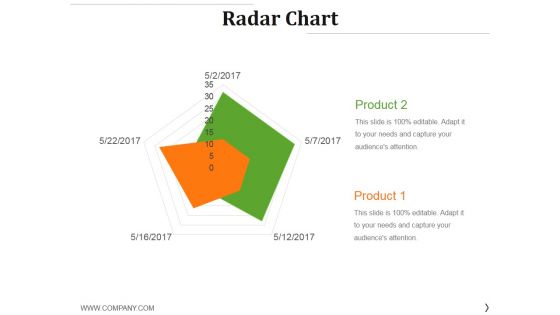
Radar Chart Ppt PowerPoint Presentation Slides Graphics
This is a radar chart ppt powerpoint presentation slides graphics. This is a two stage process. The stages in this process are product, shapes, management, business, marketing.
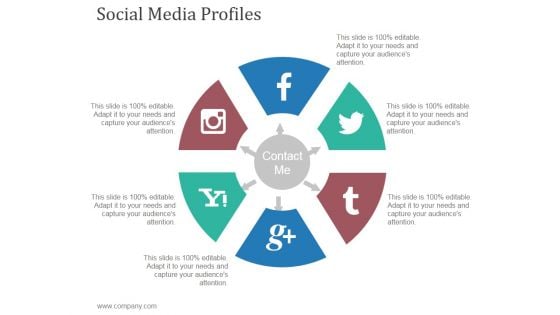
Social Media Profiles Ppt PowerPoint Presentation Graphics
This is a social media profiles ppt powerpoint presentation graphics. This is a six stage process. The stages in this process are business, marketing, circular, management, process.
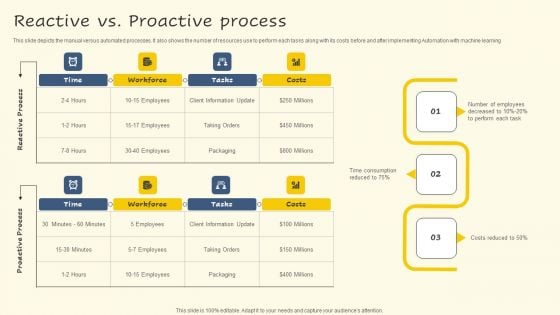
Reactive Vs Proactive Process Graphics PDF
This slide depicts the manual versus automated processes. It also shows the number of resources use to perform each tasks along with its costs before and after implementing Automation with machine learning Welcome to our selection of the Reactive Vs Proactive Process Graphics PDF. These are designed to help you showcase your creativity and bring your sphere to life. Planning and Innovation are essential for any business that is just starting out. This collection contains the designs that you need for your everyday presentations. All of our PowerPoints are 100 percent editable, so you can customize them to suit your needs. This multi purpose template can be used in various situations. Grab these presentation templates today.

Sales Cycle Stages Ppt Presentation Graphics
This is a sales cycle stages ppt presentation graphics. This is a seven stage process. The stages in this process are follow up, closing, handling objections, presentation, approach, planning and preparation, prospecting.

Management Buyouts Example Template Powerpoint Graphics
This is a management buyouts example template powerpoint graphics. This is a three stage process. The stages in this process are mergers and acquisitions advisory, exit planning, capital raising.
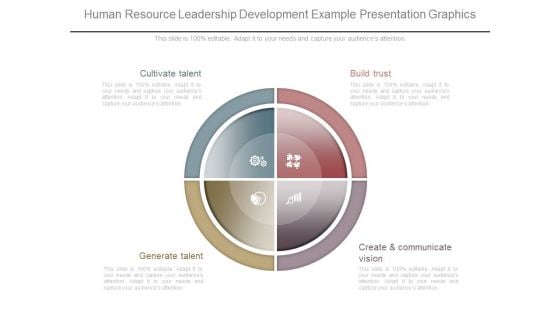
Human Resource Leadership Development Example Presentation Graphics
This is a human resource leadership development example presentation graphics. This is a four stage process. The stages in this process are cultivate talent, build trust, generate talent, create and communicate vision.
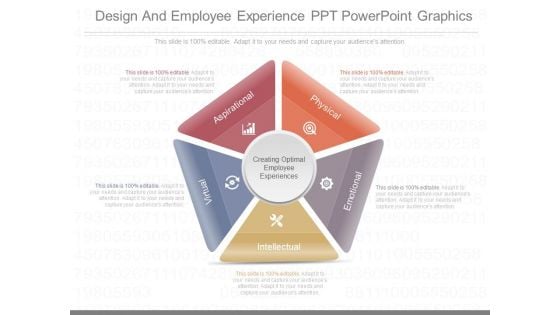
Design And Employee Experience Ppt Powerpoint Graphics
This is a design and employee experience ppt powerpoint graphics. This is a five stage process. The stages in this process are aspirational, physical, emotional, intellectual, virtual, creating optimal employee experiences.\n\n\n\n\n\n
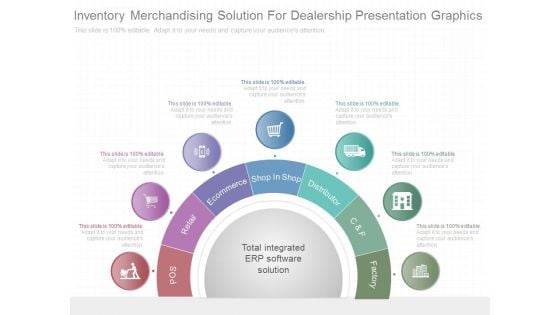
Inventory Merchandising Solution For Dealership Presentation Graphics
This is a inventory merchandising solution for dealership presentation graphics. This is a seven stage process. The stages in this process are total integrated erp software solution, pos, retail, ecommerce, shop in shop, distributor, c and f, factory.
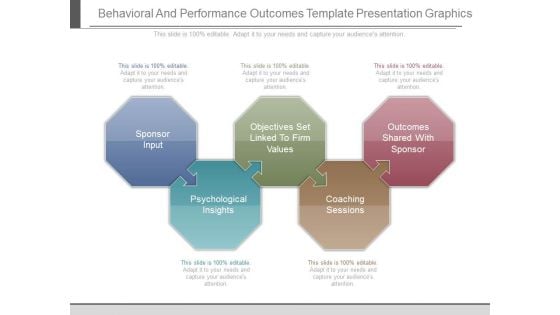
Behavioral And Performance Outcomes Template Presentation Graphics
This is a behavioral and performance outcomes template presentation graphics. This is a five stage process. The stages in this process are sponsor input, psychological insights, objectives set linked to firm values, coaching sessions, outcomes shared with sponsor.
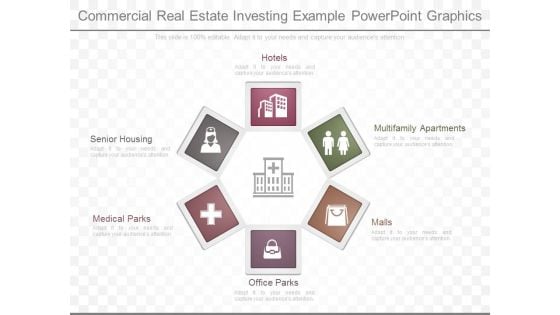
Commercial Real Estate Investing Example Powerpoint Graphics
This is a commercial real estate investing example powerpoint graphics. This is a six stage process. The stages in this process are hotels, multifamily apartments, malls, office parks, medical parks, senior housing.
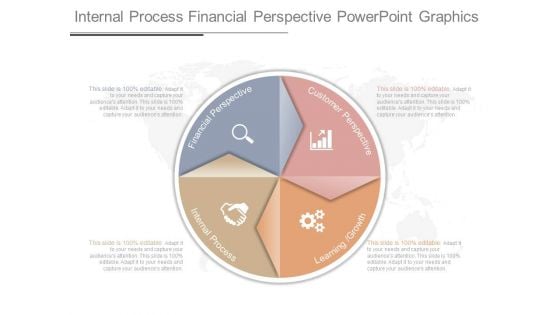
Internal Process Financial Perspective Powerpoint Graphics
This is a internal process financial perspective powerpoint graphics. This is a four stage process. The stages in this process are financial perspective, customer perspective, learning growth, internal process.
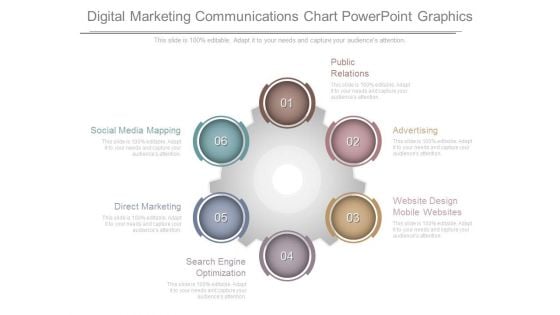
Digital Marketing Communications Chart Powerpoint Graphics
This is a digital marketing communications chart powerpoint graphics. This is a six stage process. The stages in this process are public relations, advertising, website design mobile websites, search engine optimization, direct marketing, social media mapping.
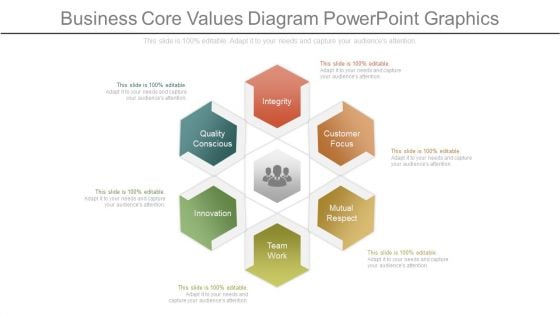
Business Core Values Diagram Powerpoint Graphics
This is a business core values diagram powerpoint graphics. This is a six stage process. The stages in this process are integrity, customer focus, mutual respect, teamwork, innovation, quality conscious.
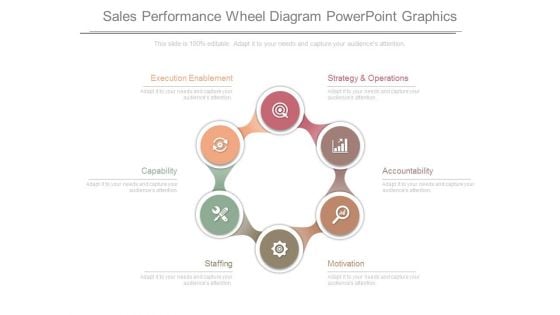
Sales Performance Wheel Diagram Powerpoint Graphics
This is a sales performance wheel diagram powerpoint graphics. This is a six stage process. The stages in this process are strategy and operations, accountability, motivation, staffing, capability, execution enablement.
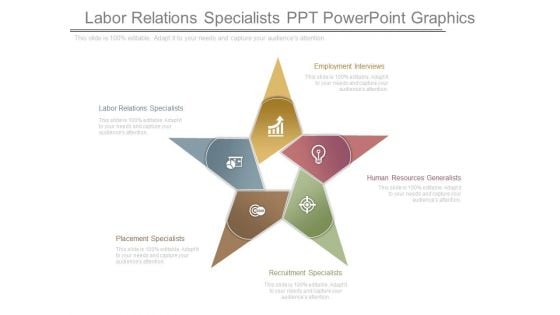
Labor Relations Specialists Ppt Powerpoint Graphics
This is a labor relations specialists ppt powerpoint graphics. This is a five stage process. The stages in this process are employment interviews, human resources generalists, recruitment specialists, labor relations specialists, placement specialists.
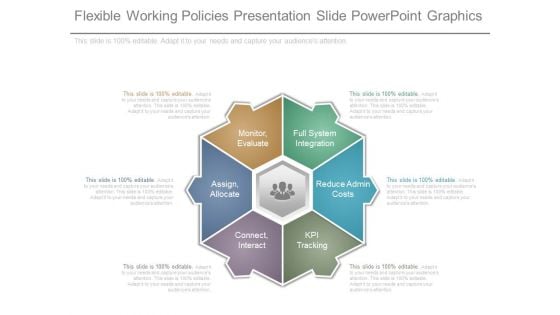
Flexible Working Policies Presentation Slide Powerpoint Graphics
This is a flexible working policies presentation slide powerpoint graphics. This is a six stage process. The stages in this process are assign, allocate, monitor, evaluate, full system integration, reduce admin costs, kpi tracking, connect, interact.
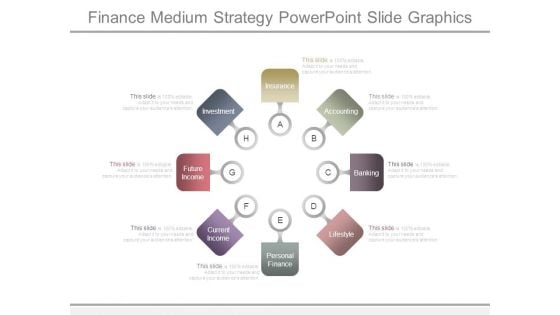
Finance Medium Strategy Powerpoint Slide Graphics
This is a finance medium strategy powerpoint slide graphics. This is a eight stage process. The stages in this process are insurance, accounting, banking, lifestyle, personal finance, current income, future income, investment.
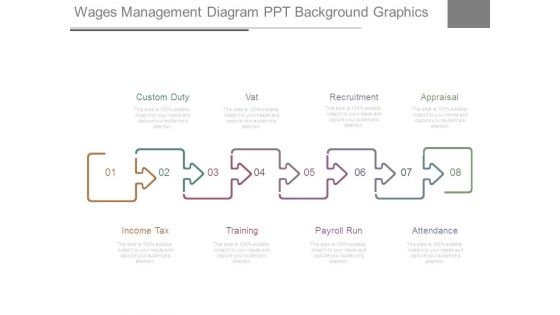
Wages Management Diagram Ppt Background Graphics
This is a wages management diagram ppt background graphics. This is a eight stage process. The stages in this process are custom duty, vat, recruitment, appraisal, income tax, training, payroll run, attendance.
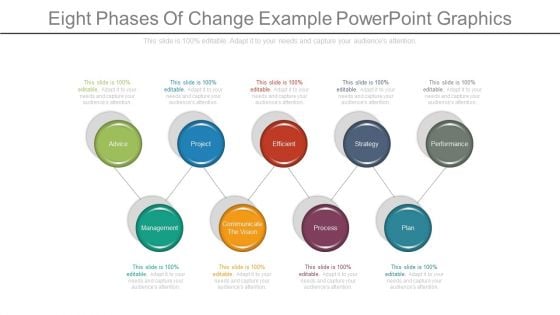
Eight Phases Of Change Example Powerpoint Graphics
This is a eight phases of change example powerpoint graphics. This is a nine stage process. The stages in this process are advice, project, efficient, strategy, performance, plan, process, communicate the vision, management.
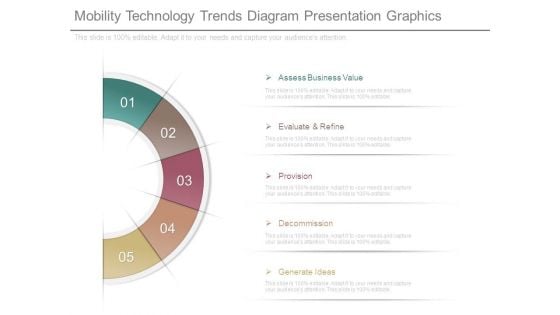
Mobility Technology Trends Diagram Presentation Graphics
This is a Mobility Technology Trends Diagram Presentation Graphics. This is a five stage process. The stages in this process are assess business value, evaluate and refine, provision, decommission, generate ideas.
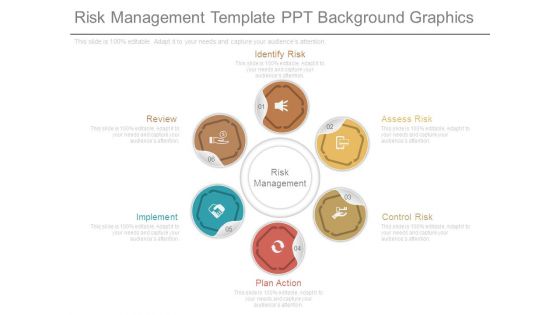
Risk Management Template Ppt Background Graphics
This is a risk management template ppt background graphics. This is a six stage process. The stages in this process are risk management, identify risk, assess risk, control risk, plan action, implement, review.

Purchasing Policy Ppt Layout Ppt Background Graphics
This is a purchasing policy ppt layout ppt background graphics. This is a seven stage process. The stages in this process are purchase requisition, order placement, shipment tracking, quality products, profitability, rebates, improved pricing.
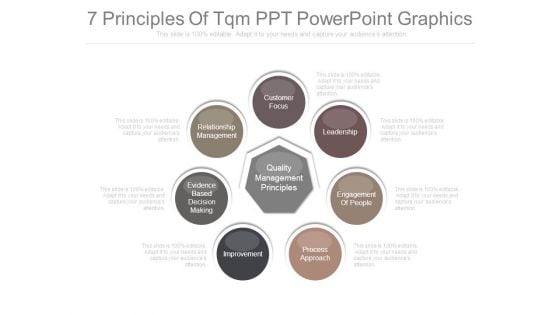
7 Principles Of Tqm Ppt Powerpoint Graphics
This is a 7 principles of tqm ppt powerpoint graphics. This is a seven stage process. The stages in this process are customer focus, leadership, engagement of people, process approach, improvement, evidence based decision making, relationship management, quality management principles.
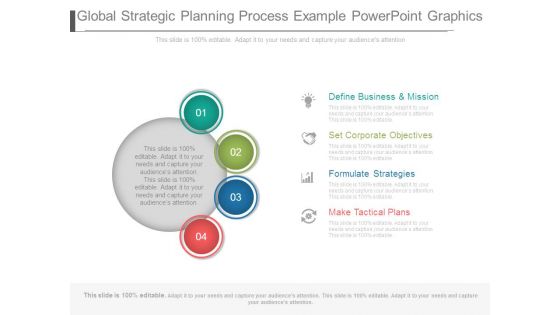
Global Strategic Planning Process Example Powerpoint Graphics
This is a global strategic planning process example powerpoint graphics. This is a four stage process. The stages in this process are define business and mission, set corporate objectives, formulate strategies, make tactical plans.
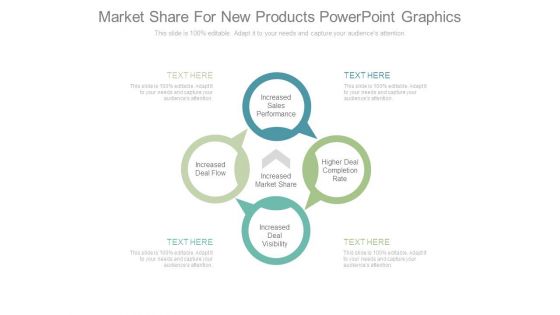
Market Share For New Products Powerpoint Graphics
This is a market share for new products powerpoint graphics. This is a four stage process. The stages in this process are increased sales performance, higher deal completion rate, increased deal visibility, increased deal flow, increased market share.
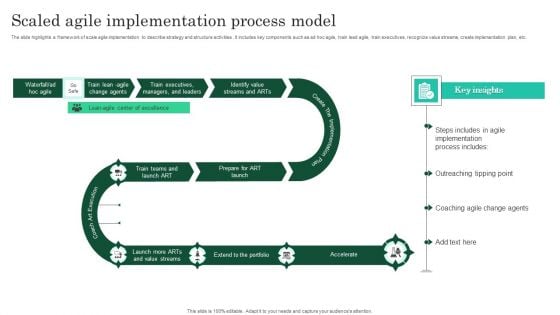
Scaled Agile Implementation Process Model Graphics PDF
The slide highlights a framework of scale agile implementation to describe strategy and structure activities . It includes key components such as ad hoc agile, train lead agile, train executives, recognize value streams, create implementation plan, etc. Persuade your audience using this Scaled Agile Implementation Process Model Graphics PDF. This PPT design covers five stages, thus making it a great tool to use. It also caters to a variety of topics including Implementation, Value StreamsImplementation, Value Streams, Portfolio. Download this PPT design now to present a convincing pitch that not only emphasizes the topic but also showcases your presentation skills.
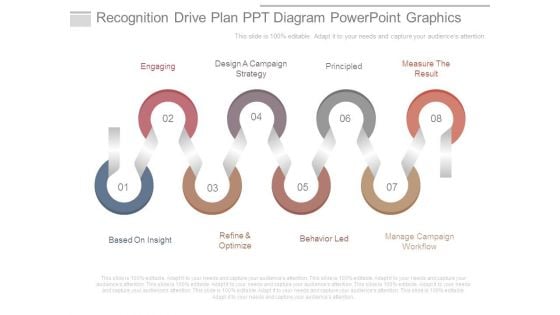
Recognition Drive Plan Ppt Diagram Powerpoint Graphics
This is a recognition drive plan ppt diagram powerpoint graphics. This is a eight stage process. The stages in this process are engaging, design a campaign strategy, principled, measure the result, based on insight, refine and optimize, behavior led, manage campaign workflow.
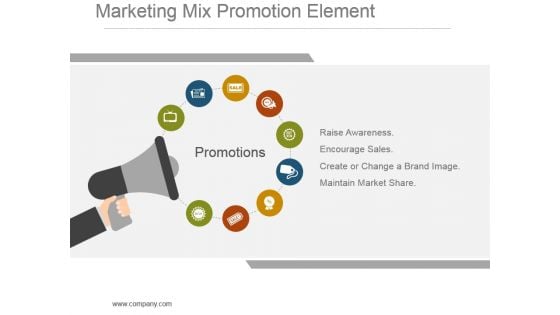
Marketing Mix Promotion Element Powerpoint Graphics
This is a marketing mix promotion element powerpoint graphics. This is a nine stage process. The stages in this process are promotions, raise awareness, encourage sales, create or change a brand image, maintain market share.
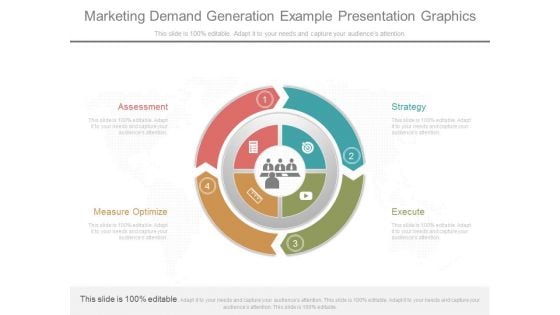
Marketing Demand Generation Example Presentation Graphics
This is a marketing demand generation example presentation graphics. This is a four stage process. The stages in this process are strategy, execute, measure optimize, assessment.
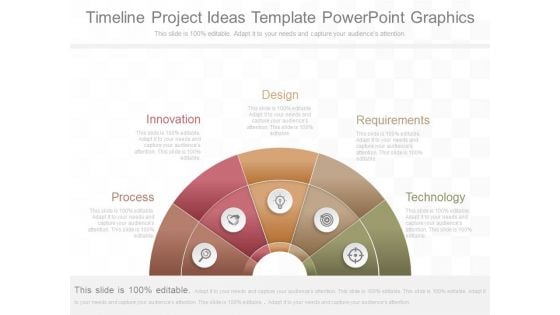
Timeline Project Ideas Template Powerpoint Graphics
This is a timeline project ideas template powerpoint graphics. This is a five stage process. The stages in this process are process, innovation, design, requirements, technology.
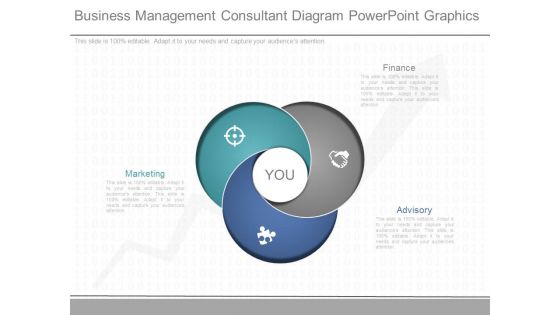
Business Management Consultant Diagram Powerpoint Graphics
This is a business management consultant diagram powerpoint graphics. This is a three stage process. The stages in this process are marketing, finance, advisory, you.
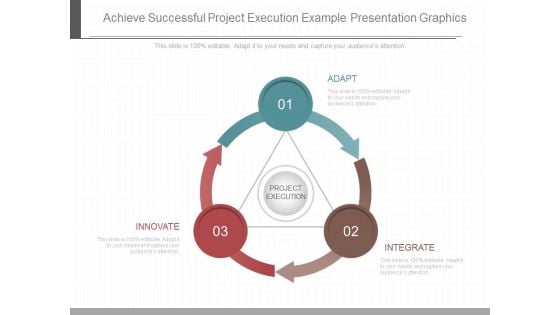
Achieve Successful Project Execution Example Presentation Graphics
This is a achieve successful project execution example presentation graphics. This is a three stage process. The stages in this process are adapt, innovate, integrate.
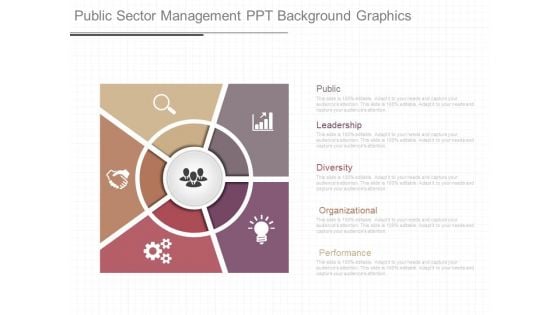
Public Sector Management Ppt Background Graphics
This is a public sector management ppt background graphics. This is a five stage process. The stages in this process are public, leadership, diversity, organizational, performance.

Dimensions In Cultural Intelligence Powerpoint Graphics
This is a dimensions in cultural intelligence powerpoint graphics. This is a three stage process. The stages in this process are intercultural engagement, intercultural communication, cultural understanding.
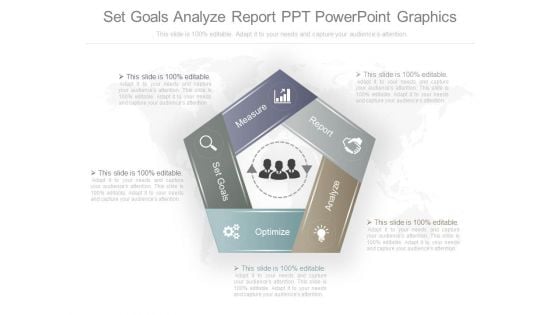
Set Goals Analyze Report Ppt Powerpoint Graphics
This is a set goals analyze report ppt powerpoint graphics. This is a five stage process. The stages in this process are measure, report, analyze, optimize, set goals.
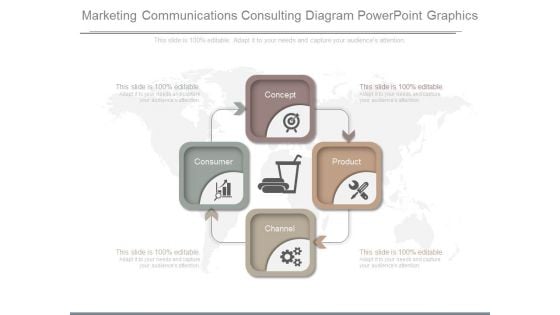
Marketing Communications Consulting Diagram Powerpoint Graphics
This is a marketing communications consulting diagram powerpoint graphics. This is a four stage process. The stages in this process are consumer, concept, product, channel.
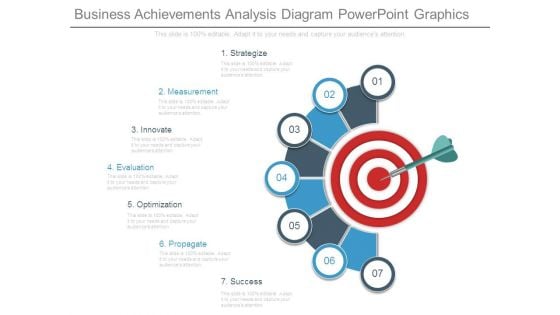
Business Achievements Analysis Diagram Powerpoint Graphics
This is a business achievements analysis diagram powerpoint graphics. This is a seven stage process. The stages in this process are strategize, measurement, innovate, evaluation, optimization, propagate, success.
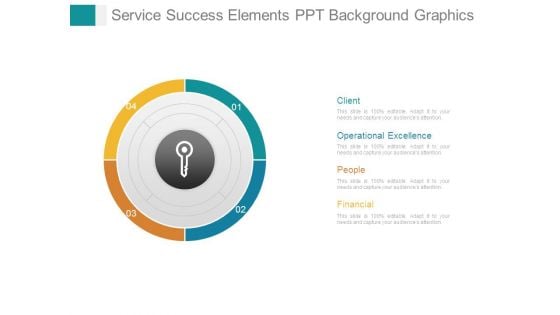
Service Success Elements Ppt Background Graphics
This is a service success elements ppt background graphics. This is a four stage process. The stages in this process are client, operational excellence, people, financial.

Process Scheduling Steps Layout Ppt Background Graphics
This is a process scheduling steps layout ppt background graphics. This is a six stage process. The stages in this process are jan, feb, mar, apr, may, jun.
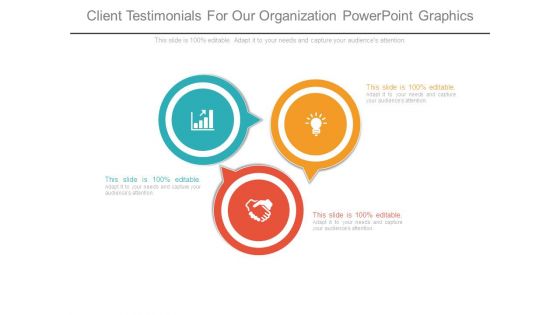
Client Testimonials For Our Organization Powerpoint Graphics
This is a client testimonials for our organization powerpoint graphics. This is a three stage process. The stages in this process are business, marketing, management, icons, process.
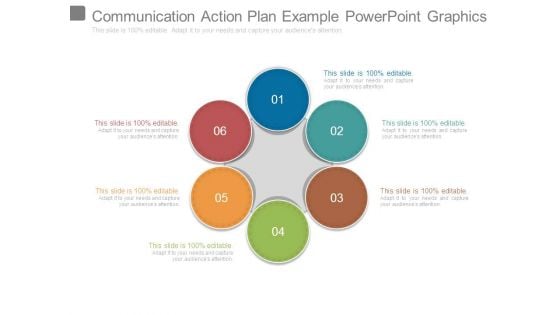
Communication Action Plan Example Powerpoint Graphics
This is a communication action plan example powerpoint graphics. This is a six stage process. The stages in this process are process, business, marketing, analysis, strategy.

Setting Short Term Goals Powerpoint Slide Graphics
This is a setting short term goals powerpoint slide graphics. This is a five stage process. The stages in this process are february, january, march, may, april.
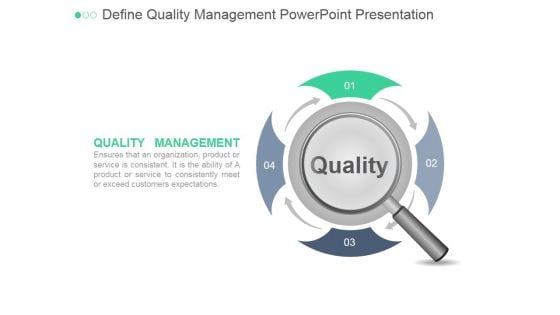
Define Quality Management Ppt PowerPoint Presentation Graphics
This is a define quality management ppt powerpoint presentation graphics. This is a four stage process. The stages in this process are quality, management, business, marketing, strategy, success.
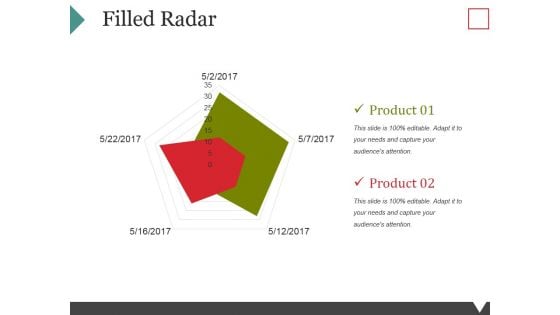
Filled Radar Ppt PowerPoint Presentation Layouts Graphics
This is a filled radar ppt powerpoint presentation layouts graphics. This is a two stage process. The stages in this process are business, marketing, product, radar chart, strategy.
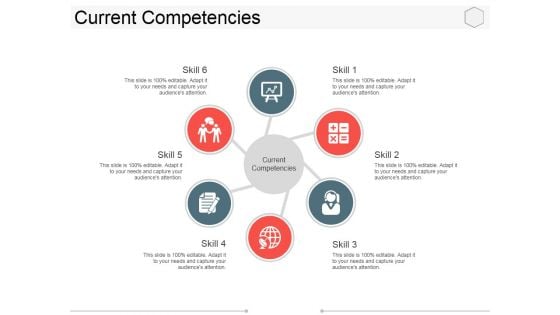
Current Competencies Ppt PowerPoint Presentation Inspiration Graphics
This is a current competencies ppt powerpoint presentation inspiration graphics. This is a six stage process. The stages in this process are skill, business, marketing, process, icons, success.
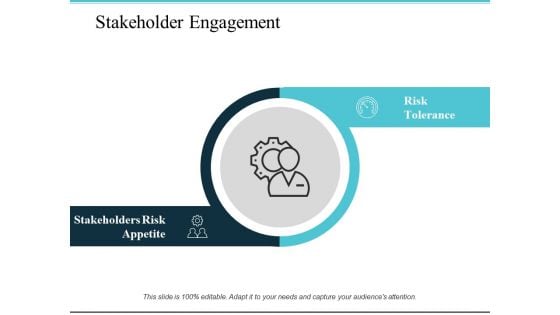
Stakeholder Engagement Ppt PowerPoint Presentation Model Graphics
This is a stakeholder engagement ppt powerpoint presentation model graphics. This is a two stage process. The stages in this process are stakeholders risk appetite, risk tolerance, business.
Derivative Products Ppt PowerPoint Presentation Icon Graphics
This is a derivative products ppt powerpoint presentation icon graphics. This is a two stage process. The stages in this process are business, management, marketing, process.
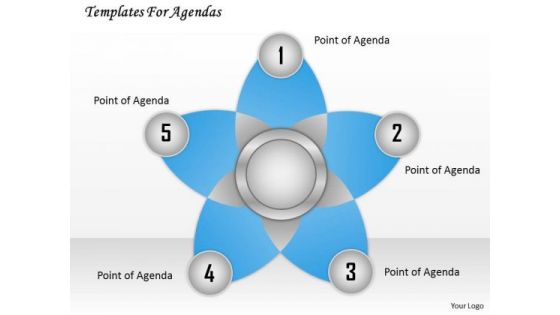
Business Framework Animated Graphics PowerPoint Presentation
This diagram is a simple diagram that provides overview of a continuing sequence of stages, tasks. This is an effective way of displaying information you may edit text, color, shade and style as per you need.
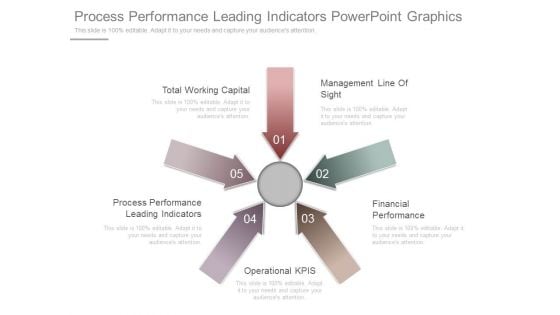
Process Performance Leading Indicators Powerpoint Graphics
This is a process performance leading indicators powerpoint graphics. This is a five stage process. The stages in this process are total working capital, management line of sight, process performance leading indicators, financial performance, operational kpis.
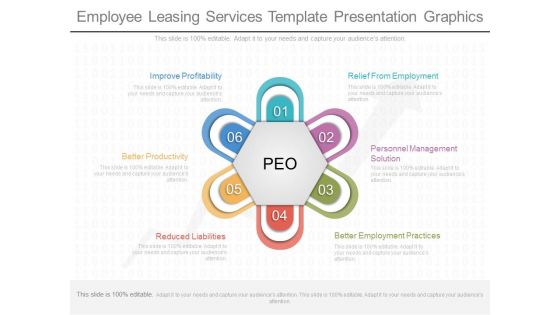
Employee Leasing Services Template Presentation Graphics
This is a employee leasing services template presentation graphics. This is a six stage process. The stages in this process are improve profitability, better productivity, reduced liabilities, relief from employment, personnel management solution, better employment practices.
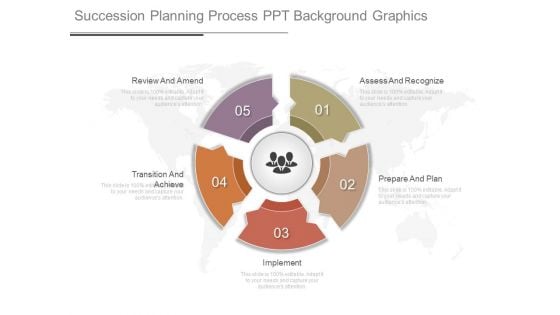
Succession Planning Process Ppt Background Graphics
This is a succession planning process ppt background graphics. This is a five stage process. The stages in this process are review and amend, transition and achieve, assess and recognize, prepare and plan, implement.
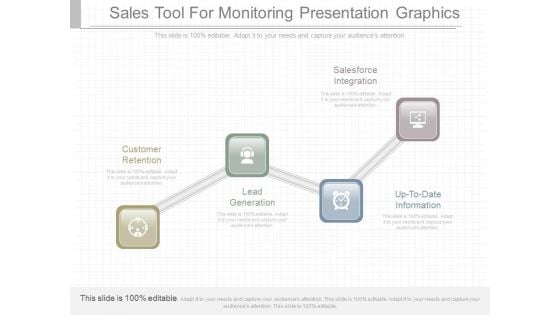
Sales Tool For Monitoring Presentation Graphics
This is a sales tool for monitoring presentation graphics. This is a four stage process. The stages in this process are customer retention, lead generation, up to date information, salesforce integration.
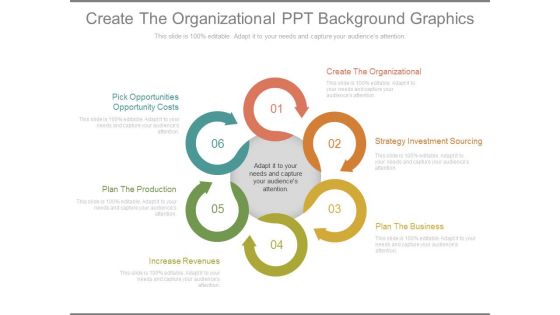
Create The Organizational Ppt Background Graphics
This is a create the organizational ppt background graphics. This is a six stage process. The stages in this process are pick opportunities opportunity costs, plan the production, increase revenues, create the organizational, create the organizational, plan the business.
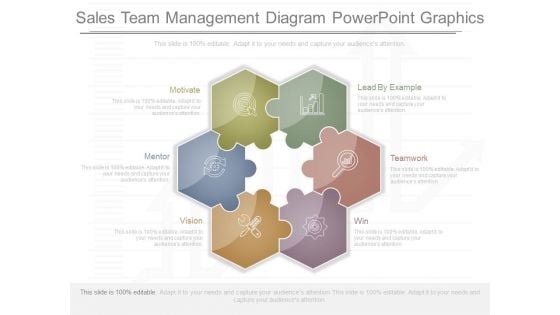
Sales Team Management Diagram Powerpoint Graphics
This is a sales team management diagram powerpoint graphics. This is a six stage process. The stages in this process are lead by example, teamwork, win, vision, mentor, motivate.
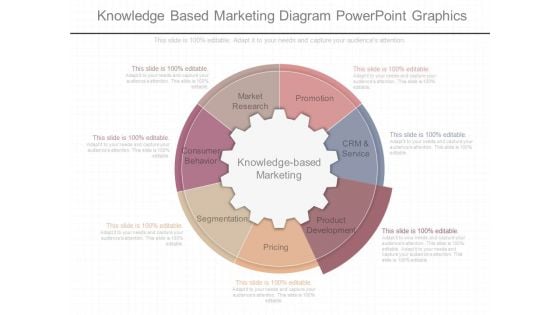
Knowledge Based Marketing Diagram Powerpoint Graphics
This is a knowledge based marketing diagram powerpoint graphics. This is a seven stage process. The stages in this process are market research, promotion, consumer behavior, knowledge based marketing, segmentation, pricing, product development, crm and service.
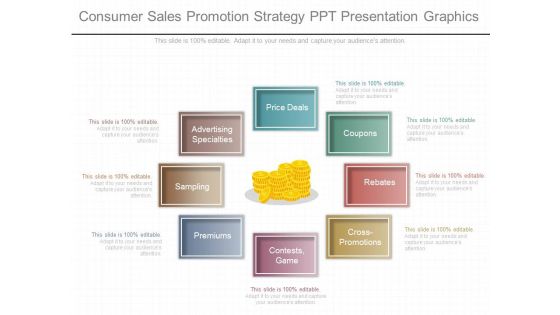
Consumer Sales Promotion Strategy Ppt Presentation Graphics
This is a consumer sales promotion strategy ppt presentation graphics. This is a eight stage process. The stages in this process are advertising specialties, price deals, sampling, premiums, contests, game, cross promotions, rebates, coupons.\n\n\n
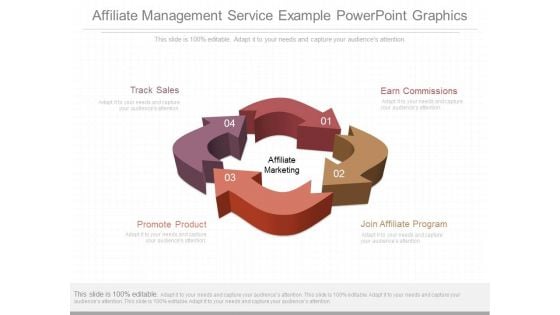
Affiliate Management Service Example Powerpoint Graphics
This is a affiliate management service example powerpoint graphics. This is a four stage process. The stages in this process are earn commissions, join affiliate program, promote product, track sales.
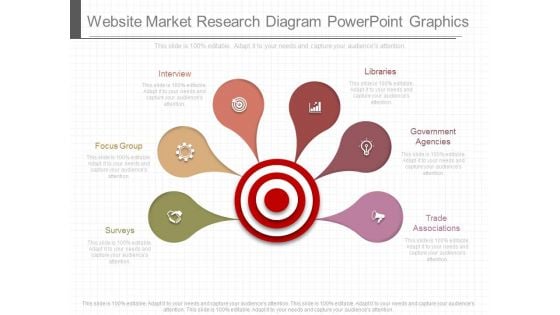
Website Market Research Diagram Powerpoint Graphics
This is a website market research diagram powerpoint graphics. This is a six stage process. The stages in this process are interview, focus group, surveys, libraries, government agencies, trade associations.
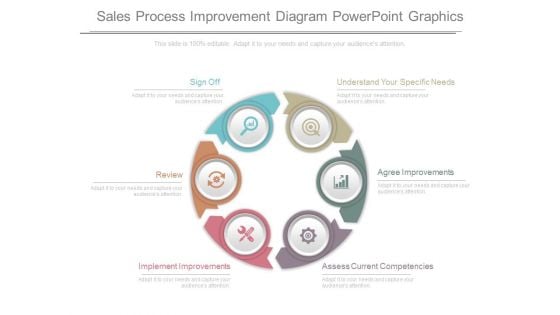
Sales Process Improvement Diagram Powerpoint Graphics
This is a sales process improvement diagram powerpoint graphics. This is a six stage process. The stages in this process are sign off, understand your specific needs, review, agree improvements, implement improvements, assess current competencies.


 Continue with Email

 Home
Home


