Continuum Graphic
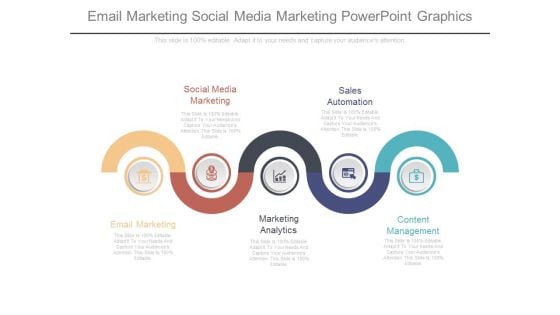
Email Marketing Social Media Marketing Powerpoint Graphics
This is a email marketing social media marketing powerpoint graphics. This is a five stage process. The stages in this process are social media marketing, sales automation, content management, marketing analytics, email marketing.
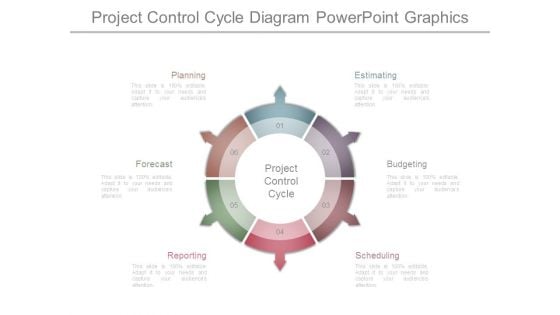
Project Control Cycle Diagram Powerpoint Graphics
This is a project control cycle diagram powerpoint graphics. This is a six stage process. The stages in this process are estimating, budgeting, scheduling, reporting, forecast, planning, project control cycle.
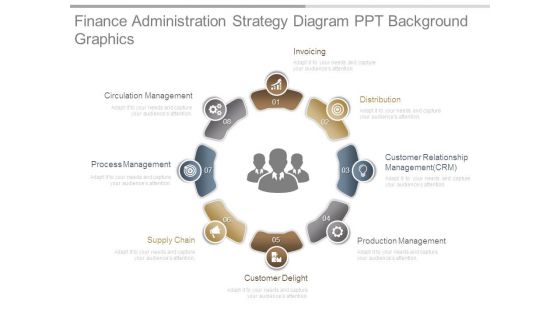
Finance Administration Strategy Diagram Ppt Background Graphics
This is a finance administration strategy diagram ppt background graphics. This is a eight stage process. The stages in this process are invoicing, distribution, customer relationship management crm, production management, customer delight, supply chain, process management, circulation management.
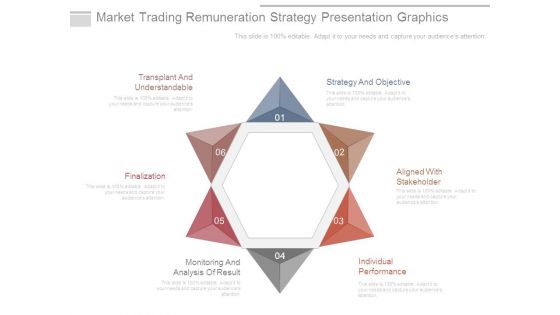
Market Trading Remuneration Strategy Presentation Graphics
This is a market trading remuneration strategy presentation graphics. This is a six stage process. The stages in this process are strategy and objective, aligned with stakeholder, individual performance, monitoring and analysis of result, finalization, transplant and understandable.
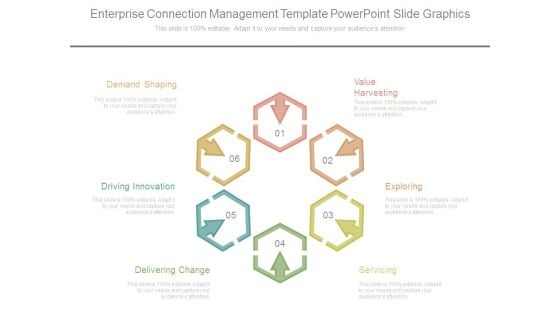
Enterprise Connection Management Template Powerpoint Slide Graphics
This is a enterprise connection management template powerpoint slide graphics. This is a six stage process. The stages in this process are value harvesting, exploring, servicing, delivering change, driving innovation, demand shaping.
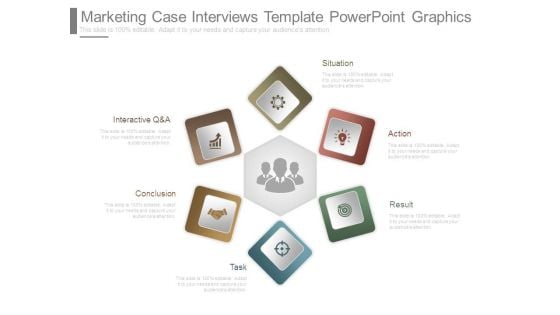
Marketing Case Interviews Template Powerpoint Graphics
This is a marketing case interviews template powerpoint graphics. This is a six stage process. The stages in this process are interactive q and a, conclusion, task, situation, action, result.
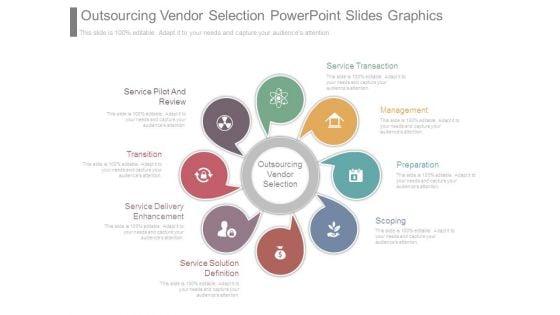
Outsourcing Vendor Selection Powerpoint Slides Graphics
This is a outsourcing vendor selection powerpoint slides graphics. This is a eight stage process. The stages in this process are service pilot and review, transition, service delivery enhancement, service solution definition, scoping, preparation, management, service transaction, outsourcing vendor selection.
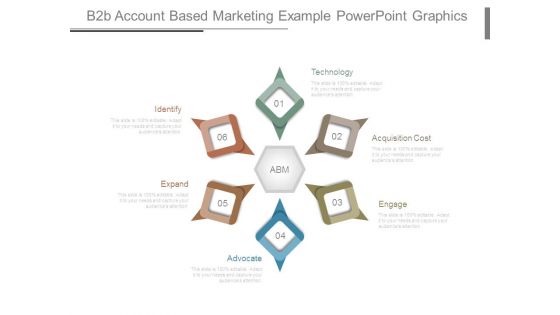
B2b Account Based Marketing Example Powerpoint Graphics
This is a b2b account based marketing example powerpoint graphics. This is a six stage process. The stages in this process are identify, expand, advocate, technology, acquisition cost, engage.
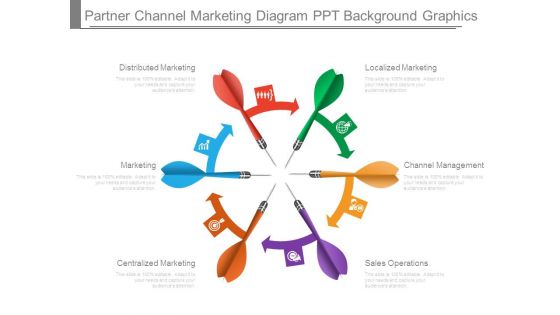
Partner Channel Marketing Diagram Ppt Background Graphics
This is a partner channel marketing diagram ppt background graphics. This is a six stage process. The stages in this process are localized marketing, channel management, sales operations, centralized marketing, marketing, distributed marketing.
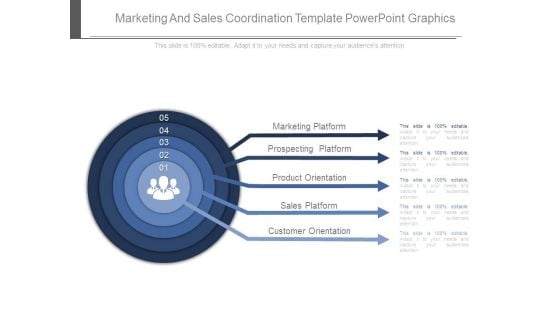
Marketing And Sales Coordination Template Powerpoint Graphics
This is a marketing and sales coordination template powerpoint graphics. This is a five stage process. The stages in this process are marketing platform, prospecting platform, product orientation, sales platform, customer orientation.
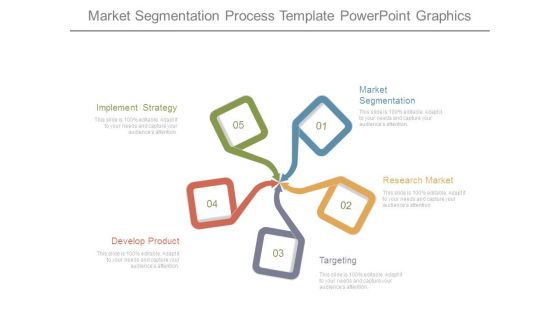
Market Segmentation Process Template Powerpoint Graphics
This is a market segmentation process template powerpoint graphics. This is a five stage process. The stages in this process are implement strategy, develop product, market segmentation, research market, targeting.
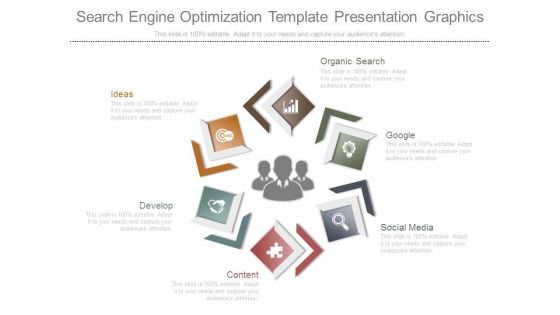
Search Engine Optimization Template Presentation Graphics
This is a search engine optimization template presentation graphics. This is a six stage process. The stages in this process are ideas, develop, content, social media, google, organic search.
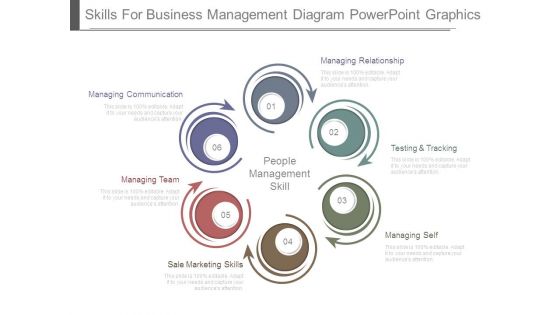
Skills For Business Management Diagram Powerpoint Graphics
This is a skills for business management diagram powerpoint graphics. This is a six stage process. The stages in this process are managing relationship, testing and tracking, managing self, sale marketing skills, managing team, managing communication, people management skill.
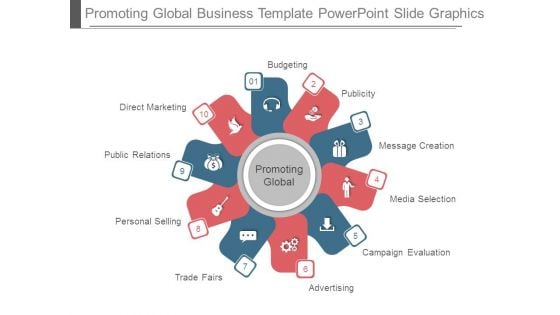
Promoting Global Business Template Powerpoint Slide Graphics
This is a promoting global business template powerpoint slide graphics. This is a ten stage process. The stages in this process are budgeting, publicity, message creation, media selection, campaign evaluation, advertising, trade fairs, personal selling, public relations, direct marketing.
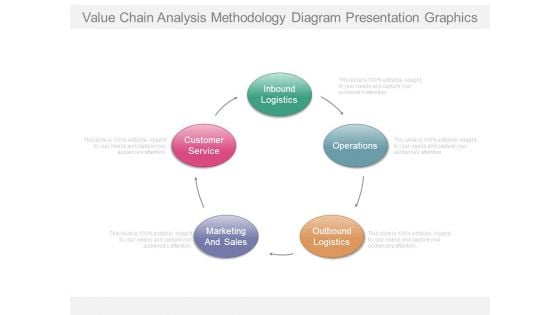
Value Chain Analysis Methodology Diagram Presentation Graphics
This is a value chain analysis methodology diagram presentation graphics. This is a five stage process. The stages in this process are customer service, marketing and sales, inbound logistics, operations, outbound logistics.
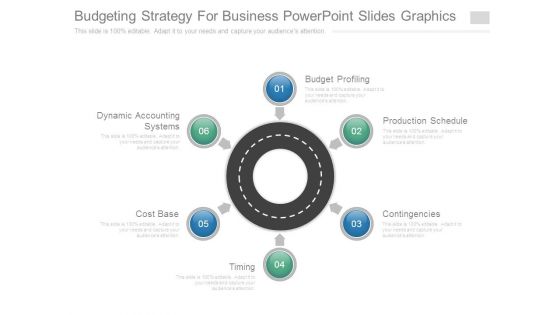
Budgeting Strategy For Business Powerpoint Slides Graphics
This is a budgeting strategy for business powerpoint slides graphics. This is a six stage process. The stages in this process are dynamic accounting systems, cost base, timing, contingencies, production schedule, budget profiling.
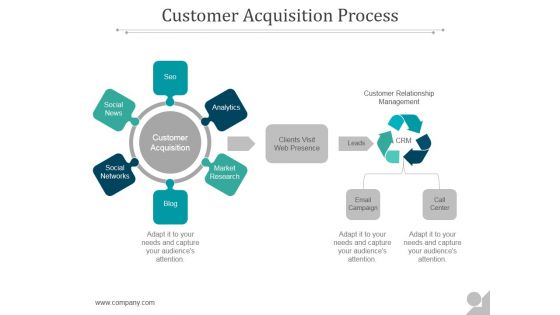
Customer Acquisition Process Ppt PowerPoint Presentation Graphics
This is a customer acquisition process ppt powerpoint presentation graphics. This is a six stage process. The stages in this process are customer acquisition, social news, social networks, blog, market research.
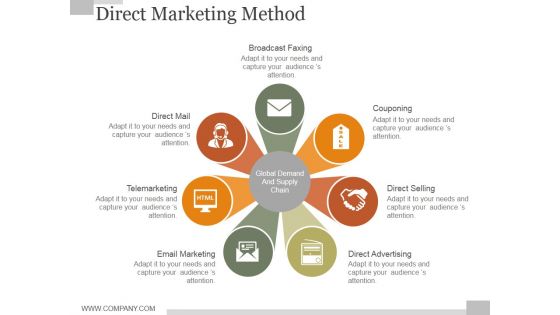
Direct Marketing Method Ppt PowerPoint Presentation Graphics
This is a direct marketing method ppt powerpoint presentation graphics. This is a seven stage process. The stages in this process are broadcast faxing, couponing, direct selling, direct advertising, email marketing, telemarketing, direct mail, global demand and supply chain.
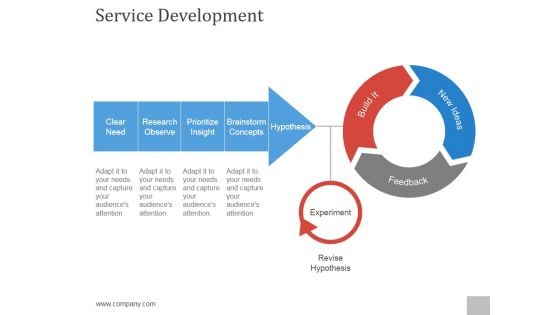
Service Development Ppt PowerPoint Presentation Graphics
This is a service development ppt powerpoint presentation graphics. This is a three stage process. The stages in this process are clear need, re observe search, prioritize insight, brainstorm concepts, hypothesis.
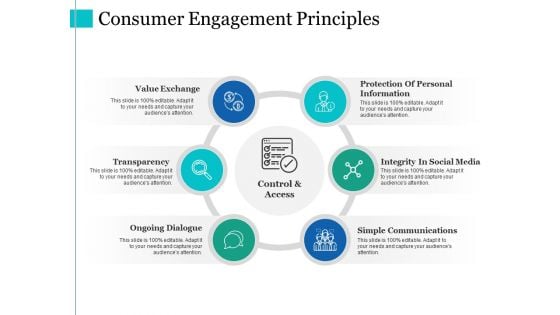
Consumer Engagement Principles Ppt PowerPoint Presentation Graphics
This is a consumer engagement principles ppt powerpoint presentation graphics. This is a six stage process. The stages in this process are value exchange, transparency, ongoing dialogue, simple communications, control.

Product Information Management Business Template Presentation Graphics
This is a product information management business template presentation graphics. This is a two stage process. The stages in this process are enterprise pim, supply, sell, crm systems, supply chain management, retail, ecommerce, mobile, emarketing, direct print, market place, data warehouse, warehouse management, erp systems, agencies, photographers, market place, data pools, consultant copywriters, vendor feeds.
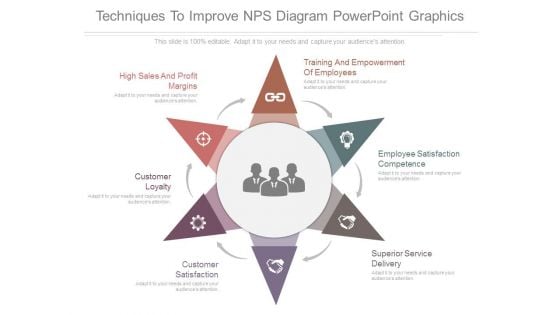
Techniques To Improve Nps Diagram Powerpoint Graphics
This is a techniques to improve nps diagram powerpoint graphics. This is a six stage process. The stages in this process are high sales and profit margins, training and empowerment of employees, employee, satisfaction competence, superior service delivery, customer satisfaction, customer loyalty.
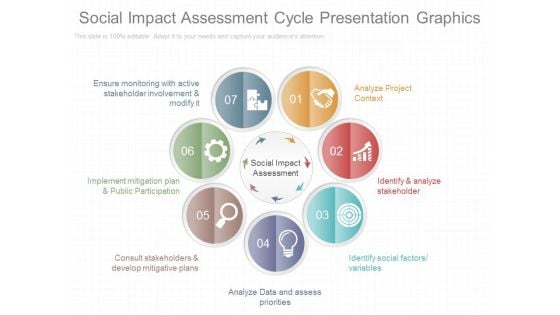
Social Impact Assessment Cycle Presentation Graphics
This is a social impact assessment cycle presentation graphics. This is a seven stage process. The stages in this process are social impact assessment, ensure monitoring with active stakeholder involvement and modify it, analyze project context, implement mitigation plan and public participation, identify and analyze stakeholder, consult stakeholders and develop mitigative plans, identify social factors variables, analyze data and assess priorities.

Project Financial Management Effective Ppt Presentation Graphics
This is a project financial management effective ppt presentation graphics. This is a eight stage process. The stages in this process are crate accountability, regulate commitment and payment, payment process, decide who what where, create tracking tool, create tracking tool, communicate, institute checks and balance.
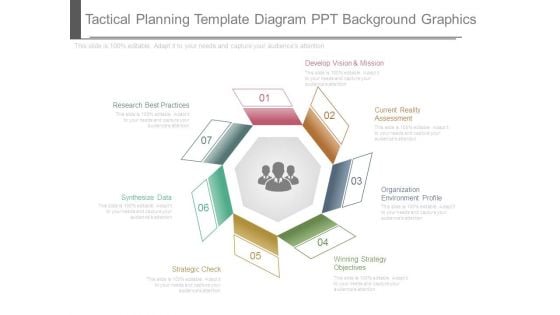
Tactical Planning Template Diagram Ppt Background Graphics
This is a tactical planning template diagram ppt background graphics. This is a seven stage process. The stages in this process are research best practices, develop vision and mission, current reality assessment, synthesize data, strategic check, winning strategy objectives, organization environment profile.

Improve Customer Service Process Ppt Background Graphics
This is a Improve Customer Service Process Ppt Background Graphics. This is a eight stage process. The stages in this process are improve knowledge of customer, increase production capacity, improve skills and knowledge, increase knowledge of governance, improve customer service process, improve safety of physical plants, update marketing, improve relations between departments.
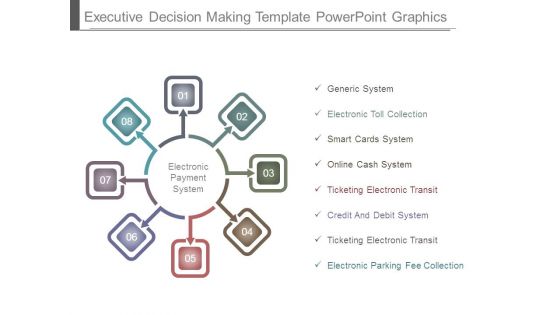
Executive Decision Making Template Powerpoint Graphics
This is a executive decision making template powerpoint graphics. This is a eight stage process. The stages in this process are generic system, electronic toll collection, smart cards system, online cash system, ticketing electronic transit, credit and debit system, electronic parking fee collection.
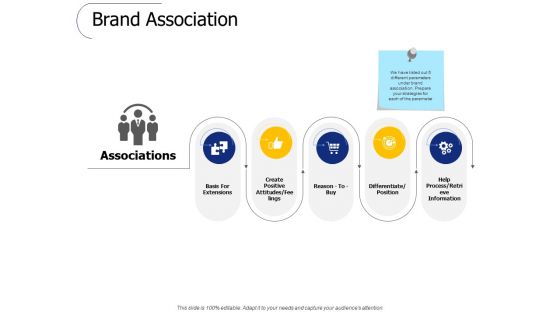
Brand Association Ppt PowerPoint Presentation Pictures Graphics
Presenting this set of slides with name brand association ppt powerpoint presentation pictures graphics. This is a five stage process. The stages in this process are basis for extensions, create positive attitudes, feelings, reason to buy, differentiate, position, help process, retrieve information. This is a completely editable PowerPoint presentation and is available for immediate download. Download now and impress your audience.
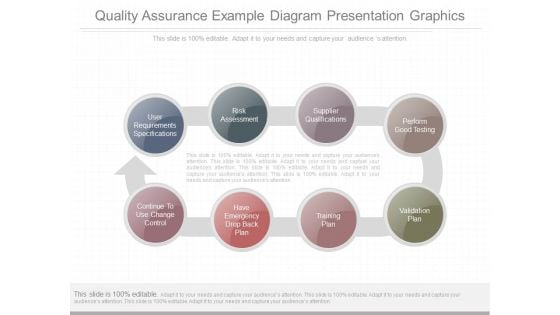
Quality Assurance Example Diagram Presentation Graphics
This is a quality assurance example diagram presentation graphics. This is a eight stage process. The stages in this process are user requirements specifications, risk assessment, supplier qualifications, perform good testing, continue to use change control, have emergency drop back plan, training plan, validation plan.
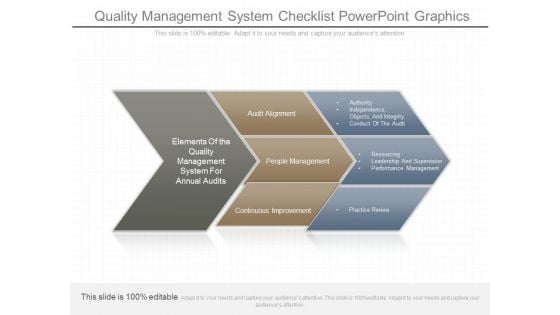
Quality Management System Checklist Powerpoint Graphics
This is a quality management system checklist powerpoint graphics. This is a three stage process. The stages in this process are process are elements of the quality management system for annual audits, audit alignment, people management, continuous improvement, authority independence, objects, and integrity conduct of the audit, resourcing leadership and supervision, performance management, practice review.
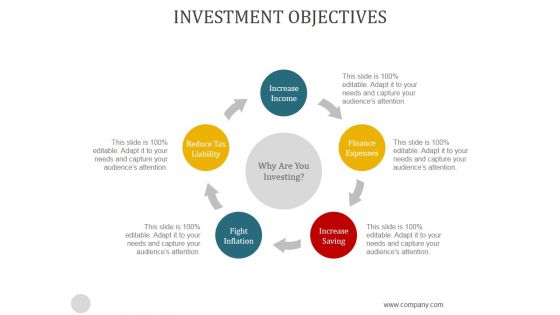
Investment Objectives Ppt PowerPoint Presentation Graphics
This is a investment objectives ppt powerpoint presentation graphics. This is a five stage process. The stages in this process are increase income, finance expenses, increase saving, fight inflation, reduce tax liability why are you investing.
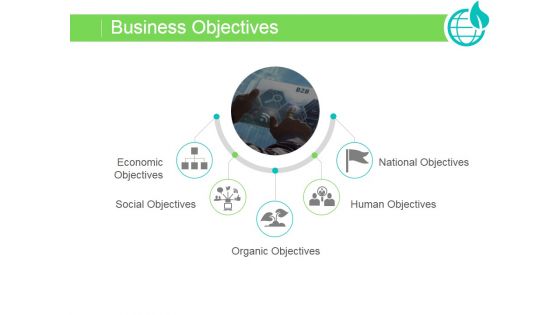
Business Objectives Ppt PowerPoint Presentation Graphics
This is a business objectives ppt powerpoint presentation graphics. This is a five stage process. The stages in this process are economic objectives, social objectives, organic objectives, human objectives, national objectives.

Affiliate Web Marketing Techniques Diagram Powerpoint Graphics
This is a affiliate web marketing techniques diagram powerpoint graphics. This is a four stage process. The stages in this process are affiliate gets a commission you get a sale, affiliate puts your ad on their website, customer clicks and converts, conversions are tracked.
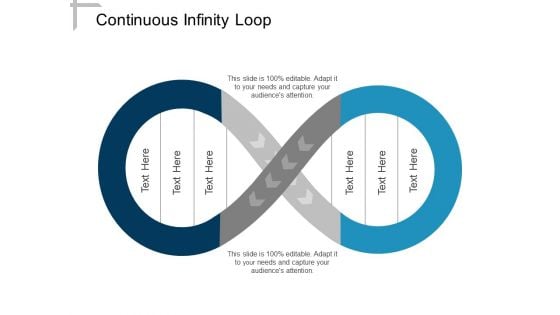
Continuous Infinity Loop Ppt PowerPoint Presentation Show Graphics Tutorials
This is a continuous infinity loop ppt powerpoint presentation show graphics tutorials. This is a two stage process. The stages in this process are circular, continuity, continuum.
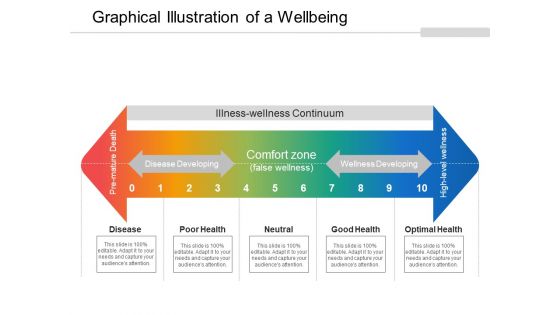
Graphical Illustration Of A Wellbeing Ppt PowerPoint Presentation Gallery Show
This is a graphical illustration of a wellbeing ppt powerpoint presentation gallery show. This is a five stage process. The stages in this process are circular, continuity, continuum.
Graphical Illustration Of A Wellbeing Ppt PowerPoint Presentation Icon Model
This is a graphical illustration of a wellbeing ppt powerpoint presentation icon model. This is a ten stage process. The stages in this process are circular, continuity, continuum.

Eight Stages Sequential Function Chart Ppt PowerPoint Presentation Slides Graphics
This is a eight stages sequential function chart ppt powerpoint presentation slides graphics. This is a eight stage process. The stages in this process are circular, continuity, continuum.
Co Worker Satisfaction And Continuous Feedback Icon Graphics Pdf
Pitch your topic with ease and precision using this Co Worker Satisfaction And Continuous Feedback Icon Graphics Pdf This layout presents information on Co Worker Satisfaction, Continuous Feedback Icon It is also available for immediate download and adjustment. So, changes can be made in the color, design, graphics or any other component to create a unique layout. Our Co Worker Satisfaction And Continuous Feedback Icon Graphics Pdf are topically designed to provide an attractive backdrop to any subject. Use them to look like a presentation pro.
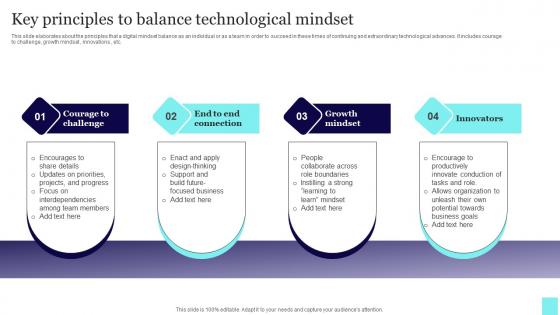
Key Principles To Balance Technological Mindset Graphics Pdf
This slide elaborates about the principles that a digital mindset balance as an individual or as a team in order to succeed in these times of continuing and extraordinary technological advances. It includes courage to challenge, growth mindset, innovations, etc. Pitch your topic with ease and precision using this Key Principles To Balance Technological Mindset Graphics Pdf. This layout presents information on Growth Mindset, Innovations. It is also available for immediate download and adjustment. So, changes can be made in the color, design, graphics or any other component to create a unique layout. This slide elaborates about the principles that a digital mindset balance as an individual or as a team in order to succeed in these times of continuing and extraordinary technological advances. It includes courage to challenge, growth mindset, innovations, etc.
Scrum Agile Development Events And Methodology Graphics Pdf
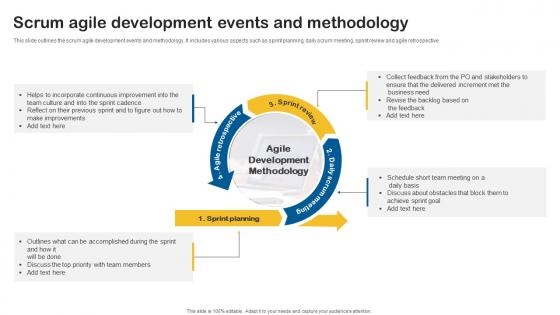
This slide outlines the scrum agile development events and methodology. It includes various aspects such as sprint planning, daily scrum meeting, sprint review and agile retrospective.Pitch your topic with ease and precision using this Scrum Agile Development Events And Methodology Graphics Pdf This layout presents information on Incorporate Continuous, Previous Sprint, Discuss About Obstacles It is also available for immediate download and adjustment. So, changes can be made in the color, design, graphics or any other component to create a unique layout. This slide outlines the scrum agile development events and methodology. It includes various aspects such as sprint planning, daily scrum meeting, sprint review and agile retrospective.
Business Plan Time Line Chart PowerPoint Templates Ppt Slides Graphics
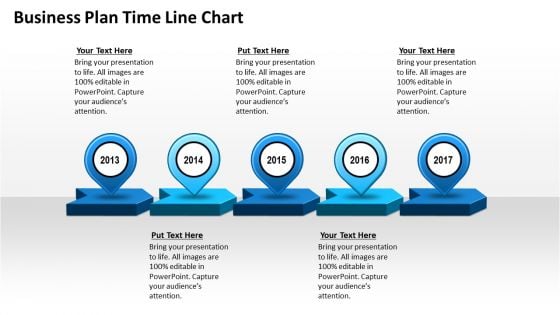
We present our Business Plan Time Line Chart PowerPoint Templates PPT Slides Graphics.Present our Marketing PowerPoint Templates because customer satisfaction is a mantra of the marketplace. Building a loyal client base is an essential element of your business. Download our Time planning PowerPoint Templates because you have some great folks working with you, thinking with you. Present our Timelines PowerPoint Templates because they will Amplify your thoughts via our appropriate templates. Use our Arrows PowerPoint Templates because you are buzzing with ideas. Present our Business PowerPoint Templates because this layout helps you to bring some important aspects of your business process to the notice of all concerned. Streamline the flow of information across the board.Use these PowerPoint slides for presentations relating to Art, Background, Button, Call, City, Colorful, Concept, Country, Destination, Editable, Flag, Fuel, Geography, Graphic, Home, Icon, Illustration, Journey, Land, Locate, Location, Macro, Map, Mapping, Mark, Navigate, Needle, Petrol, Pin, Pinpoint, Place, Pointing, Pump, Push, Pushpin, Restaurant, Road, Roadmap, Service, Set, Shiny, Space, Symbol, Town, Travel, Trip. The prominent colors used in the PowerPoint template are Blue, Blue light, Gray. You can be sure our Business Plan Time Line Chart PowerPoint Templates PPT Slides Graphics are Excellent. You can be sure our Country PowerPoint templates and PPT Slides are Stylish. Professionals tell us our Business Plan Time Line Chart PowerPoint Templates PPT Slides Graphics are Majestic. Use our Colorful PowerPoint templates and PPT Slides are Charming. Use our Business Plan Time Line Chart PowerPoint Templates PPT Slides Graphics are Energetic. Use our Button PowerPoint templates and PPT Slides are Excellent. Put your thoughts effortlessly together. Our Business Plan Time Line Chart PowerPoint Templates Ppt Slides Graphics will create a classic ensemble.
Continuous Random Variables Ppt PowerPoint Presentation Professional Graphics Cpb Pdf
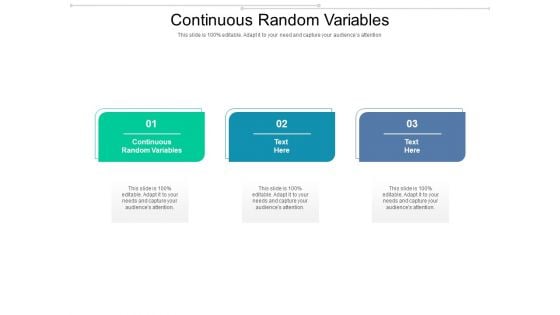
Presenting this set of slides with name continuous random variables ppt powerpoint presentation professional graphics cpb pdf. This is an editable Powerpoint three stages graphic that deals with topics like continuous random variables to help convey your message better graphically. This product is a premium product available for immediate download and is 100 percent editable in Powerpoint. Download this now and use it in your presentations to impress your audience.

Process Improvement Continuous Ppt PowerPoint Presentation Outline Graphics Design Cpb
This is a process improvement continuous ppt powerpoint presentation outline graphics design cpb. This is a seven stage process. The stages in this process are process improvement continuous.
Continuous Deployment Vector Icon Ppt Powerpoint Presentation Summary Graphics Pictures
This is a continuous deployment vector icon ppt powerpoint presentation summary graphics pictures. This is a three stage process. The stages in this process are combination icon, incorporation icon, integration icon.
Continuous Integration Learning Ppt PowerPoint Presentation Infographic Template Graphics Pictures
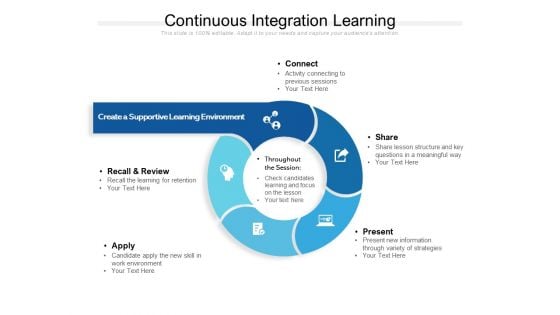
Presenting this set of slides with name continuous integration learning ppt powerpoint presentation infographic template graphics pictures. This is a five stage process. The stages in this process are connect, share, present, apply, recall and review. This is a completely editable PowerPoint presentation and is available for immediate download. Download now and impress your audience.

Business Continuity Plans Ppt PowerPoint Presentation Gallery Graphics Template Cpb
This is a business continuity plans ppt powerpoint presentation gallery graphics template cpb. This is a five stage process. The stages in this process are business continuity plans.
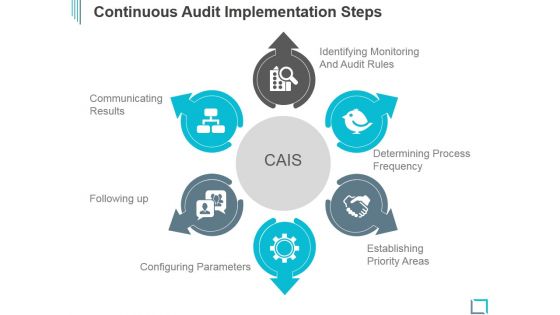
Continuous Audit Implementation Steps Ppt PowerPoint Presentation Graphics
This is a continuous audit implementation steps ppt powerpoint presentation graphics. This is a six stage process. The stages in this process are identifying audit rules, determining process frequency, establishing priority areas, configuring parameters, following up, communicating results.
Icon For Continuous Improvement In Scrum Learning Graphics PDF
Pitch your topic with ease and precision using this Icon For Continuous Improvement In Scrum Learning Graphics PDF. This layout presents information on Icon Continuous, Improvement Scrum Learning, Collaborative, Mostly. It is also available for immediate download and adjustment. So, changes can be made in the color, design, graphics or any other component to create a unique layout.

Continuous Improvement Customer Service Ppt PowerPoint Presentation Inspiration Graphics Pictures
This is a continuous improvement customer service ppt powerpoint presentation inspiration graphics pictures. This is a four stage process. The stages in this process are continuous improvement customer service.
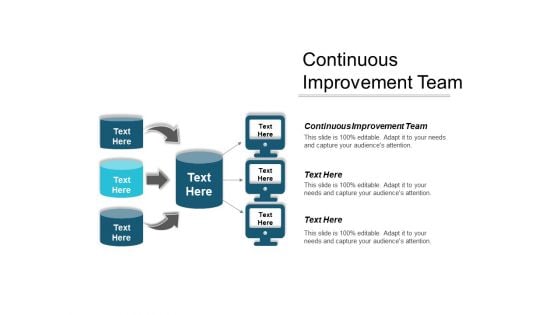
Continuous Improvement Team Ppt PowerPoint Presentation Slides Graphics Design Cpb
This is a continuous improvement team ppt powerpoint presentation slides graphics design cpb. The topics discussed in this diagram are continuous improvement team. This is a completely editable PowerPoint presentation, and is available for immediate download.
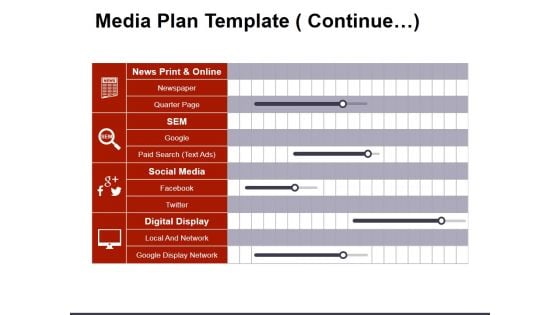
Media Plan Template Continue Ppt PowerPoint Presentation Infographics Graphics Tutorials
This is a media plan template continue ppt powerpoint presentation infographics graphics tutorials. This is a five stage process. The stages in this process are news print and online, newspaper, quarter page, social media, facebook.
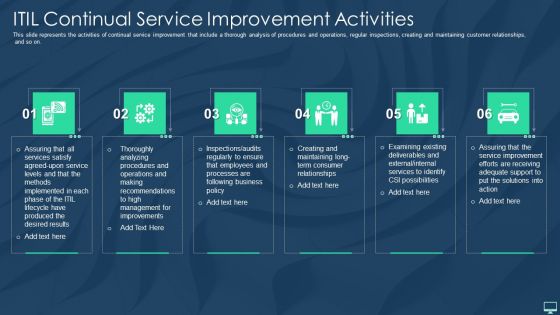
ITIL Continual Service Improvement Activities Ppt Portfolio Graphics Design PDF
This slide represents the activities of continual service improvement that include a thorough analysis of procedures and operations, regular inspections, creating and maintaining customer relationships, and so on. Presenting itil continual service improvement activities ppt portfolio graphics design pdf to provide visual cues and insights. Share and navigate important information on six stages that need your due attention. This template can be used to pitch topics like implemented, methods, service, produced, analyzing. In addtion, this PPT design contains high resolution images, graphics, etc, that are easily editable and available for immediate download.

Quarterly Business Roadmap For Lean Six Sigma Continuous Enhancement Graphics
We present our quarterly business roadmap for lean six sigma continuous enhancement graphics. This PowerPoint layout is easy-to-edit so you can change the font size, font type, color, and shape conveniently. In addition to this, the PowerPoint layout is Google Slides compatible, so you can share it with your audience and give them access to edit it. Therefore, download and save this well-researched quarterly business roadmap for lean six sigma continuous enhancement graphics in different formats like PDF, PNG, and JPG to smoothly execute your business plan.
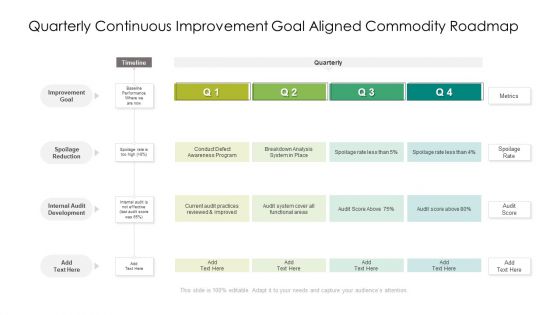
Quarterly Continuous Improvement Goal Aligned Commodity Roadmap Graphics
We present our quarterly continuous improvement goal aligned commodity roadmap graphics. This PowerPoint layout is easy to edit so you can change the font size, font type, color, and shape conveniently. In addition to this, the PowerPoint layout is Google Slides compatible, so you can share it with your audience and give them access to edit it. Therefore, download and save this well researched quarterly continuous improvement goal aligned commodity roadmap graphics in different formats like PDF, PNG, and JPG to smoothly execute your business plan.
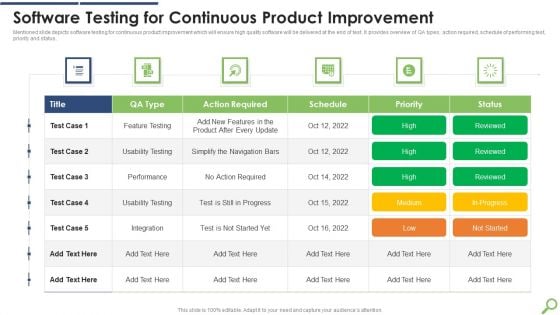
Software Testing For Continuous Product Improvement Graphics PDF
Mentioned slide depicts software testing for continuous product improvement which will ensure high quality software will be delivered at the end of test. It provides overview of QA types, action required, schedule of performing test, priority and status.Pitch your topic with ease and precision using this Software Testing For Continuous Product Improvement Graphics PDF This layout presents information on Action Required, Usability Testing, Simplify Navigation It is also available for immediate download and adjustment. So, changes can be made in the color, design, graphics or any other component to create a unique layout.
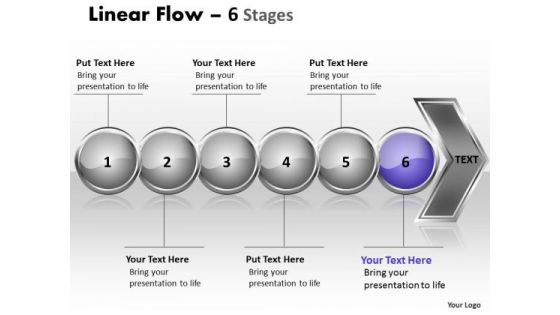
Business Ppt Theme Continual Illustration Graphical Of 6 Issues 7
We present our Business PPT Theme continual illustration Graphical of 6 issues 7.Use our Spheres PowerPoint Templates because, Cycle Template: - Rolling along while gathering profits along the way is the aim. Use our Symbol PowerPoint Templates because, Many a core idea has various enveloping layers. Use our Arrows PowerPoint Templates because, Timelines Template: - Getting it done may not be enough. Use our Metaphor PowerPoint Templates because, But it cannot be gained to desired levels in one go. Use our Business PowerPoint Templates because, Marketing Strategy Business Template:- Maximizing sales of your product is the intended destination. Use these PowerPoint slides for presentations relating to Arrow, Background, Business, Chart, Diagram, Financial, Flow, Graphic, Gray, Icon, Illustration, Linear, Management, Orange, Perspective, Process, Reflection, Spheres, Stage, Text. The prominent colors used in the PowerPoint template are Purple, Gray, and Black Your team will get faithfully behind you. Assume control with our Business Ppt Theme Continual Illustration Graphical Of 6 Issues 7.
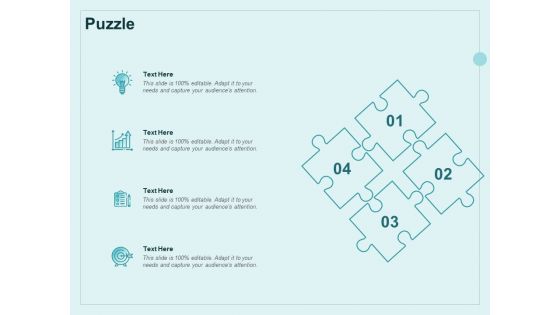
Continual Improvement Model Puzzle Ppt Infographics Graphics PDF
Presenting this set of slides with name continual improvement model puzzle ppt infographics graphics pdf. This is a four stage process. The stages in this process are puzzle. This is a completely editable PowerPoint presentation and is available for immediate download. Download now and impress your audience.
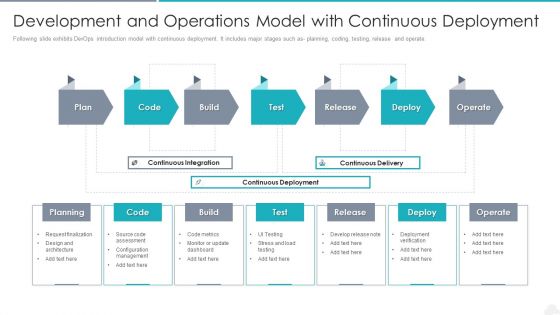
Development And Operations Model With Continuous Deployment Graphics PDF
Presenting development and operations model with continuous deployment graphics pdf to dispense important information. This template comprises seven stages. It also presents valuable insights into the topics including management, deploy, planning. This is a completely customizable PowerPoint theme that can be put to use immediately. So, download it and address the topic impactfully.
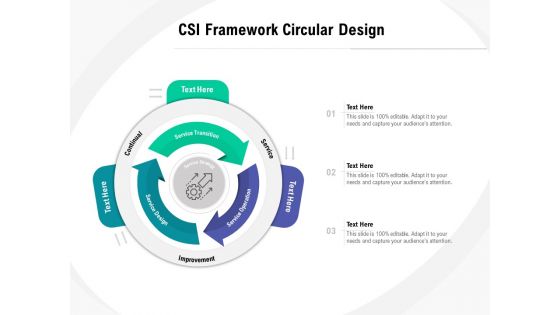
CSI Framework Circular Design Ppt PowerPoint Presentation Ideas Graphics PDF
Presenting this set of slides with name csi framework circular design ppt powerpoint presentation ideas graphics pdf. This is a three stage process. The stages in this process are service transition, service operation, service design, continual, service, improvement. This is a completely editable PowerPoint presentation and is available for immediate download. Download now and impress your audience.
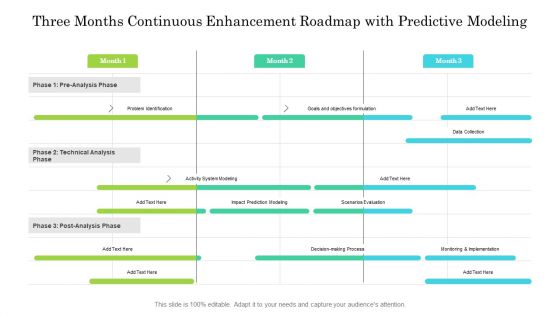
Three Months Continuous Enhancement Roadmap With Predictive Modeling Graphics
Presenting our innovatively structured three months continuous enhancement roadmap with predictive modeling graphics Template. Showcase your roadmap process in different formats like PDF, PNG, and JPG by clicking the download button below. This PPT design is available in both Standard Screen and Widescreen aspect ratios. It can also be easily personalized and presented with modified font size, font type, color, and shapes to measure your progress in a clear way.


 Continue with Email

 Home
Home


