Coordination
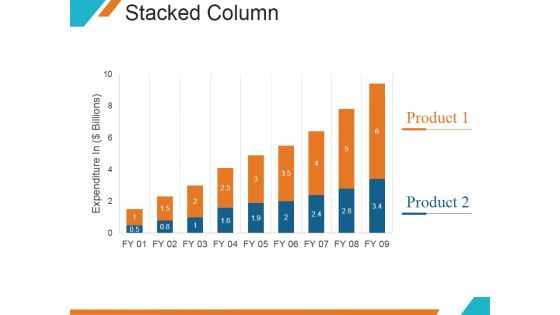
Stacked Column Ppt PowerPoint Presentation Topics
This is a stacked column ppt powerpoint presentation topics. This is a nine stage process. The stages in this process are expenditure in, product, graph, growth, success.
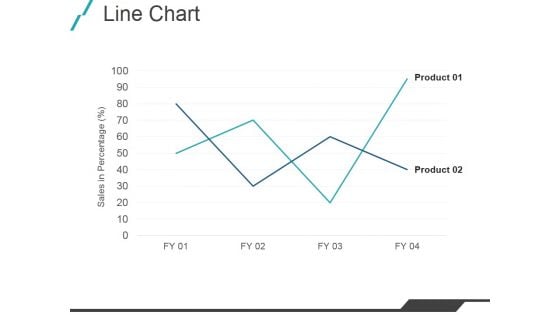
Line Chart Ppt PowerPoint Presentation Model Example File
This is a line chart ppt powerpoint presentation model example file. This is a two stage process. The stages in this process are product, graph, growth, management.
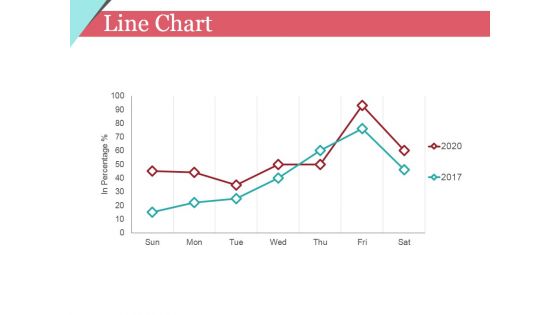
Line Chart Ppt PowerPoint Presentation Infographics Ideas
This is a line chart ppt powerpoint presentation infographics ideas. This is a two stage process. The stages in this process are growth, graph, marketing.
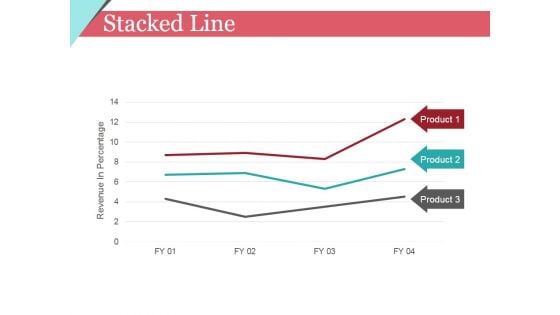
Stacked Line Ppt PowerPoint Presentation Gallery Display
This is a stacked line ppt powerpoint presentation gallery display. This is a three stage process. The stages in this process are revenue in percentage, product, graph, finance.
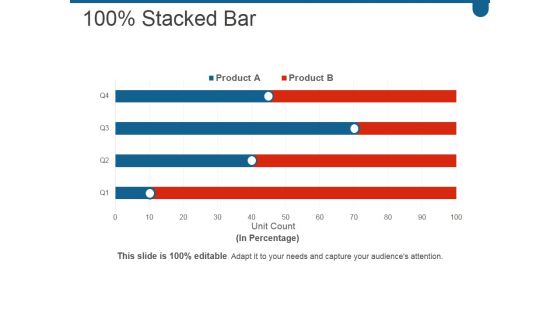
Stacked Bar Ppt PowerPoint Presentation File Graphics Example
This is a stacked bar ppt powerpoint presentation file graphics example. This is a four stage process. The stages in this process are business, marketing, bar, graph, percentage.

Scatter Chart Ppt PowerPoint Presentation Portfolio Design Inspiration
This is a scatter chart ppt powerpoint presentation portfolio design inspiration. This is a twelve stage process. The stages in this process are graph, growth, success, business.
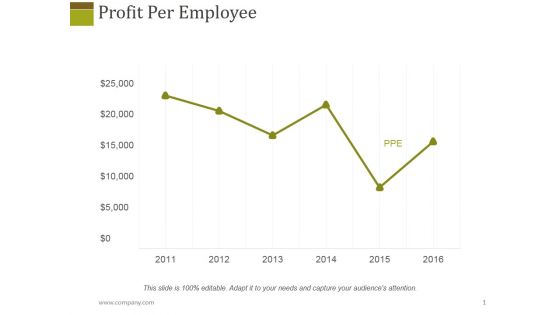
Profit Per Employee Ppt PowerPoint Presentation Slides Graphics Tutorials
This is a profit per employee ppt powerpoint presentation slides graphics tutorials. This is a four stage process. The stages in this process are year, graph, management, finance.
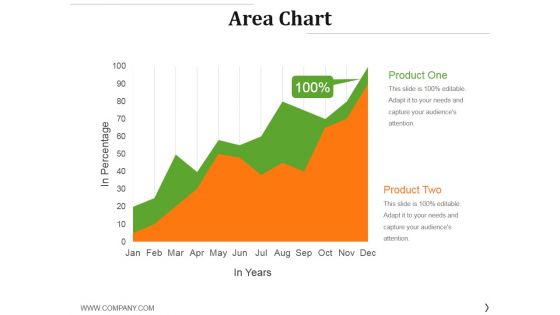
Area Chart Ppt PowerPoint Presentation Gallery Inspiration
This is a area chart ppt powerpoint presentation gallery inspiration. This is a two stage process. The stages in this process are product, growth, success, graph, finance.
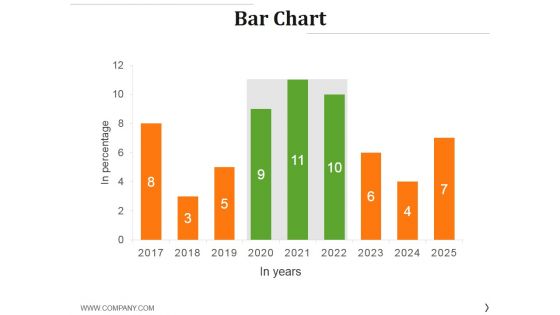
Bar Chart Ppt PowerPoint Presentation Styles Graphics Example
This is a bar chart ppt powerpoint presentation styles graphics example. This is a nine stage process. The stages in this process are graph, growth, success, business, finance.

Magnifying Glass Ppt Powerpoint Presentation Ideas Templates
This is a magnifying glass ppt powerpoint presentation ideas templates. This is a three stage process. The stages in this process are magnifying glass, marketing, business, graph.
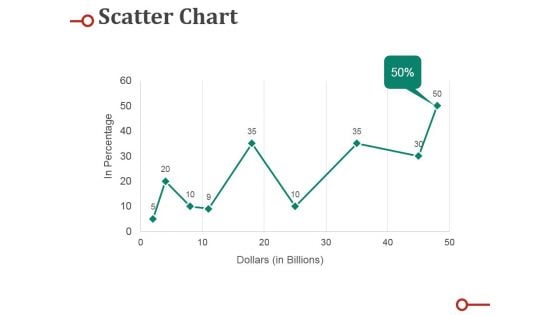
Scatter Chart Ppt PowerPoint Presentation Professional Deck
This is a scatter chart ppt powerpoint presentation professional deck. This is a nine stage process. The stages in this process are percentage, business, marketing, graph, line.
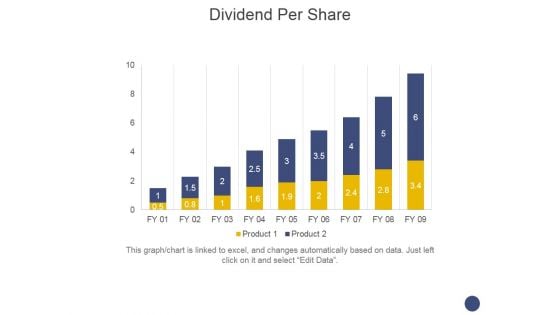
Dividend Per Share Ppt PowerPoint Presentation File Ideas
This is a dividend per share ppt powerpoint presentation file ideas. This is a nine stage process. The stages in this process are business, growth, finance, graph, management.
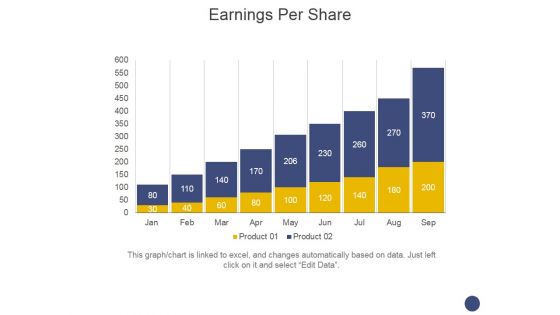
Earnings Per Share Ppt PowerPoint Presentation Outline Gridlines
This is a earnings per share ppt powerpoint presentation outline gridlines. This is a nine stage process. The stages in this process are business, growth, finance, graph, management.

Clustered Column Ppt PowerPoint Presentation Information
This is a clustered column ppt powerpoint presentation information. This is a twelve stage process. The stages in this process are bar graph, business, marketing, growth, success.
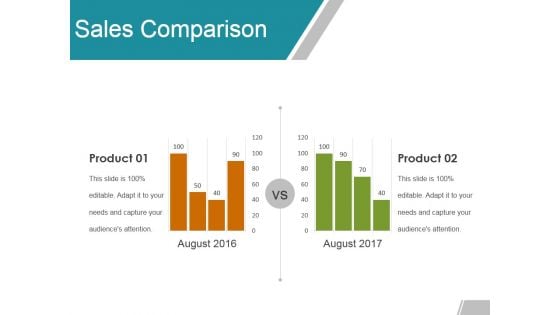
Sales Comparison Ppt PowerPoint Presentation Professional Templates
This is a sales comparison ppt powerpoint presentation professional templates. This is a two stage process. The stages in this process are product, compare, business, marketing, graph.
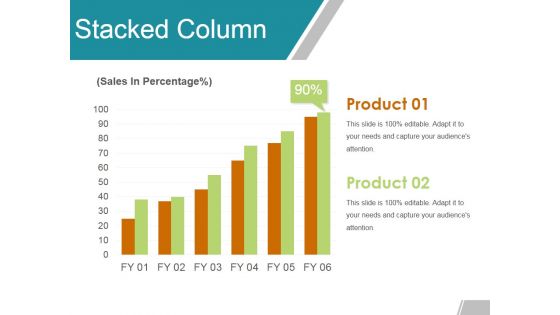
Stacked Column Ppt PowerPoint Presentation Layouts Templates
This is a stacked column ppt powerpoint presentation layouts templates. This is a six stage process. The stages in this process are product, growth, finance, success, graph.
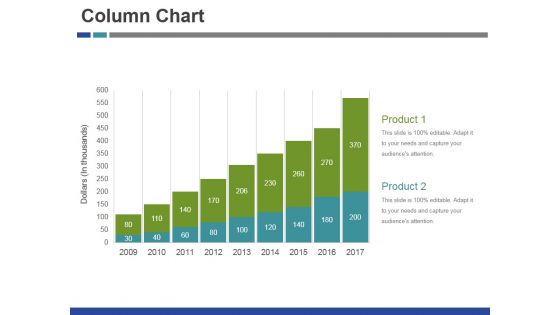
Column Chart Ppt PowerPoint Presentation Infographic Template Layouts
This is a column chart ppt powerpoint presentation infographic template layouts. This is a nine stage process. The stages in this process are product, growth, success, business, graph.
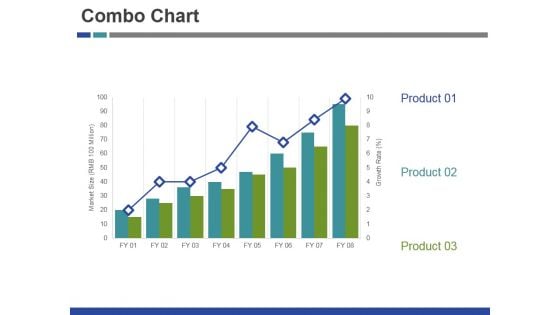
Combo Chart Ppt PowerPoint Presentation Diagram Lists
This is a combo chart ppt powerpoint presentation diagram lists. This is a eight stage process. The stages in this process are product, growth, success, business, graph.
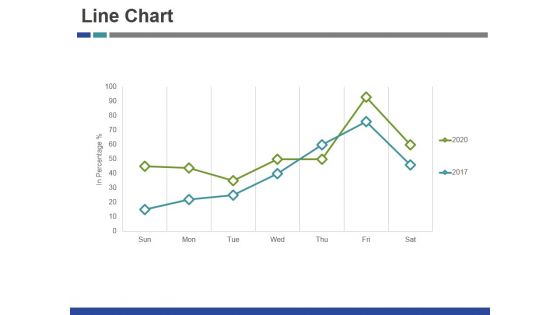
Line Chart Ppt PowerPoint Presentation Gallery Summary
This is a line chart ppt powerpoint presentation gallery summary. This is a two stage process. The stages in this process are finance, graph, business, management, marketing.
Internal Analysis Ppt PowerPoint Presentation Icon Outline
This is a internal analysis ppt powerpoint presentation icon outline. This is a four stage process. The stages in this process are finance, graph, business, marketing.
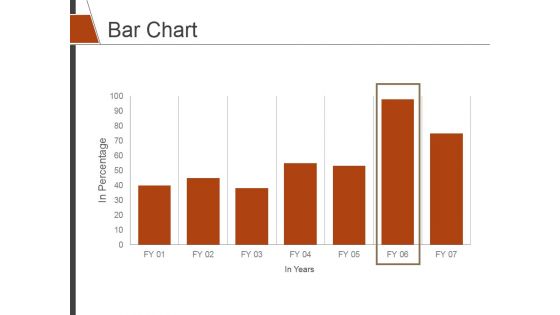
Bar Chart Ppt PowerPoint Presentation Slides Shapes
This is a bar chart ppt powerpoint presentation slides shapes. This is a seven stage process. The stages in this process are bar graph, finance, marketing, strategy, analysis.

Area Chart Ppt PowerPoint Presentation Slides Show
This is a area chart ppt powerpoint presentation slides show. This is a two stage process. The stages in this process are business, marketing, success, graph, growth.
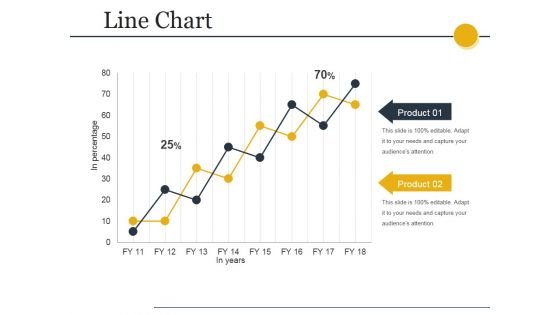
Line Chart Ppt PowerPoint Presentation Ideas Demonstration
This is a line chart ppt powerpoint presentation ideas demonstration. This is a eight stage process. The stages in this process are business, marketing, graph, success, growth.

Clustered Bar Ppt PowerPoint Presentation File Inspiration
This is a clustered bar ppt powerpoint presentation file inspiration. This is a two stage process. The stages in this process are product, profit, growth, success, graph.

Line Chart Ppt PowerPoint Presentation Styles Graphics Example
This is a line chart ppt powerpoint presentation styles graphics example. This is a two stage process. The stages in this process are graph, business, success, marketing, line.
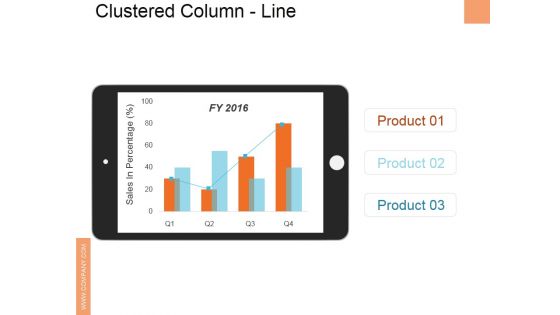
Clustered Column Line Ppt PowerPoint Presentation File Clipart
This is a clustered column line ppt powerpoint presentation file clipart. This is a three stage process. The stages in this process are bar, graph, technology, server, strategy.

Column Chart Ppt PowerPoint Presentation Inspiration Design Ideas
This is a column chart ppt powerpoint presentation inspiration design ideas. This is a nine stage process. The stages in this process are product, growth, success, graph, business.
Combo Chart Ppt PowerPoint Presentation Icon Rules
This is a combo chart ppt powerpoint presentation icon rules. This is a ten stage process. The stages in this process are cumulative, value, sales, graph, business.
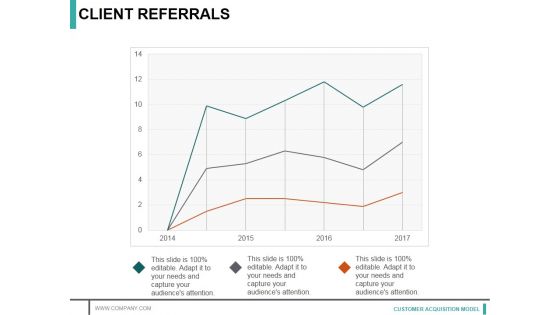
Client Referrals Ppt PowerPoint Presentation Infographic Template Maker
This is a client referrals ppt powerpoint presentation infographic template maker. This is a three stage process. The stages in this process are growth, graph, success, finance, business.
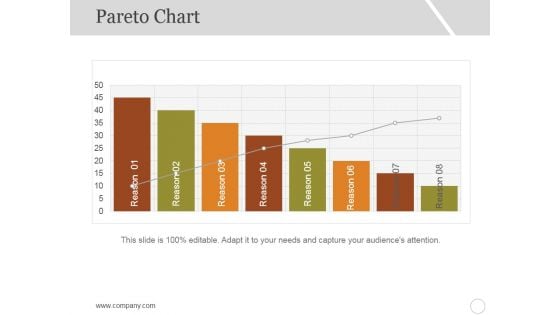
Pareto Chart Ppt PowerPoint Presentation Show Vector
This is a pareto chart ppt powerpoint presentation show vector. This is a eight stage process. The stages in this process are reason, business, marketing, graph, decline.
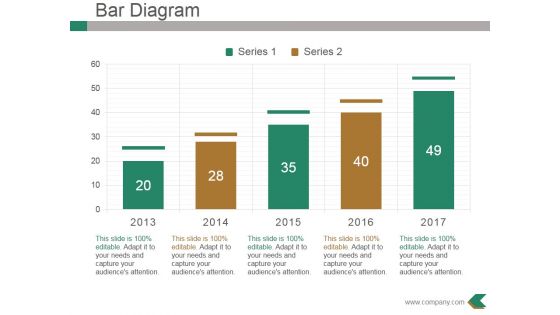
Bar Diagram Ppt PowerPoint Presentation Pictures Designs
This is a bar diagram ppt powerpoint presentation pictures designs. This is a five stage process. The stages in this process are business, marketing, growth, graph, success.
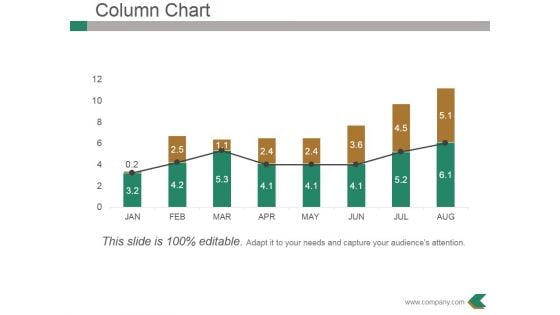
Column Chart Ppt PowerPoint Presentation Professional Example
This is a column chart ppt powerpoint presentation professional example. This is a eight stage process. The stages in this process are bar graph, growth, success, business, marketing.
Growth Team Ppt PowerPoint Presentation Icon Topics
This is a growth team ppt powerpoint presentation icon topics. This is a five stage process. The stages in this process are bar graph, growth, success, business, marketing.

Development And Testing Ppt PowerPoint Presentation Gallery Slideshow
This is a development and testing ppt powerpoint presentation gallery slideshow. This is a five stage process. The stages in this process are percentage, business, finance, marketing, graph.

Clustered Column Ppt PowerPoint Presentation Outline Visuals
This is a clustered column ppt powerpoint presentation outline visuals. This is a two stage process. The stages in this process are profit, business, product, marketing, graph.
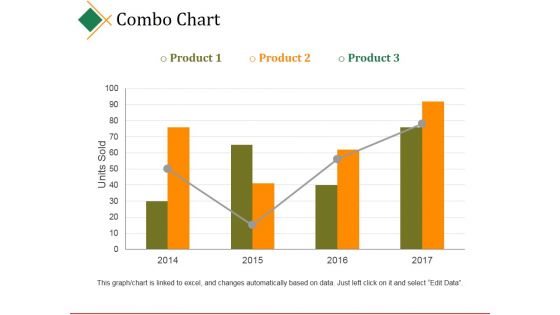
Combo Chart Ppt PowerPoint Presentation Slides Diagrams
This is a combo chart ppt powerpoint presentation slides diagrams. This is a four stage process. The stages in this process are units sold, business, product, marketing, graph.
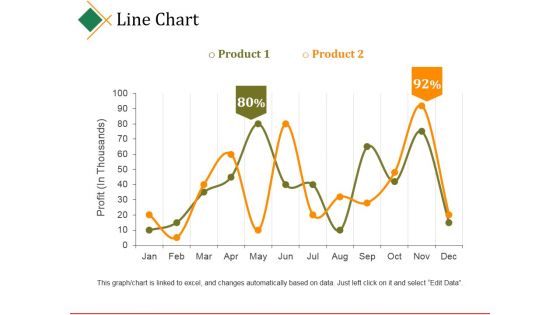
Line Chart Ppt PowerPoint Presentation Portfolio Shapes
This is a line chart ppt powerpoint presentation portfolio shapes. This is a two stage process. The stages in this process are profit, product, business, marketing, graph.
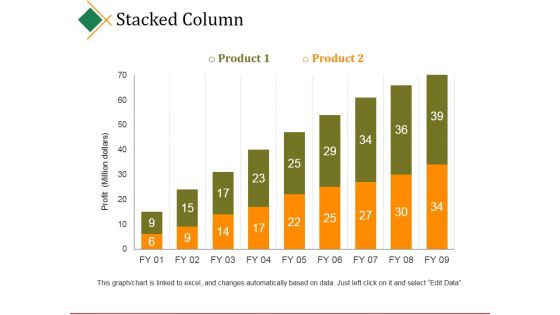
Stacked Column Ppt PowerPoint Presentation Show Slideshow
This is a stacked column ppt powerpoint presentation show slideshow. This is a nine stage process. The stages in this process are product, profit, business, marketing, graph.
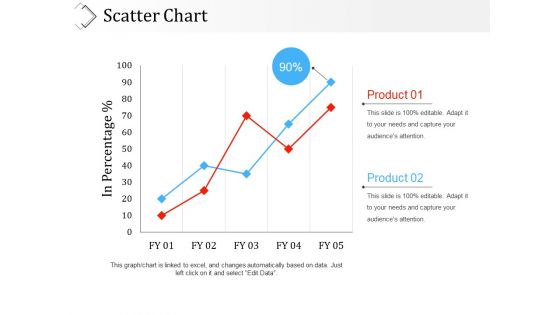
Scatter Chart Ppt PowerPoint Presentation Outline Picture
This is a scatter chart ppt powerpoint presentation outline picture. This is a two stage process. The stages in this process are in percentage, business, marketing, product, graph.

Column Chart Ppt PowerPoint Presentation Ideas Inspiration
This is a column chart ppt powerpoint presentation ideas inspiration. This is a five stage process. The stages in this process are graph, year, business, marketing, product.

Scatter Chart Ppt PowerPoint Presentation Infographic Template Objects
This is a scatter chart ppt powerpoint presentation infographic template objects. This is a nine stage process. The stages in this process are product, growth, success, graph.
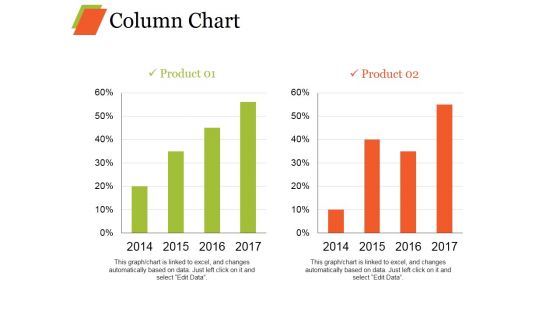
Column Chart Ppt PowerPoint Presentation Infographics Model
This is a column chart ppt powerpoint presentation infographics model. This is a two stage process. The stages in this process are bar graph, growth, product, percentage, year.
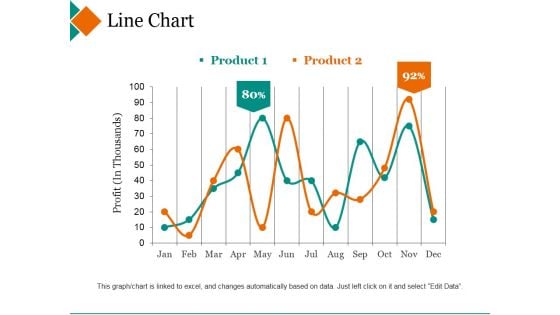
Line Chart Ppt PowerPoint Presentation Inspiration Deck
This is a line chart ppt powerpoint presentation inspiration deck. This is a two stage process. The stages in this process are product, profit, percentage, finance, line graph.
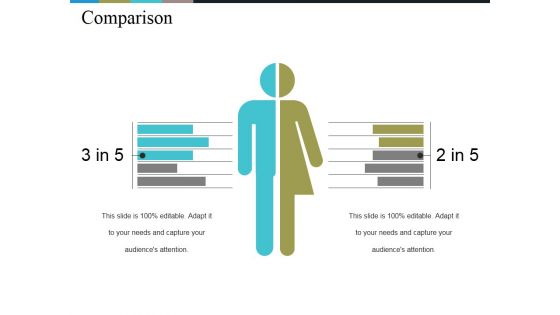
Comparison Ppt PowerPoint Presentation Layouts Show
This is a comparison ppt powerpoint presentation layouts show. This is a two stage process. The stages in this process are comparison, business, marketing, planning, graph.
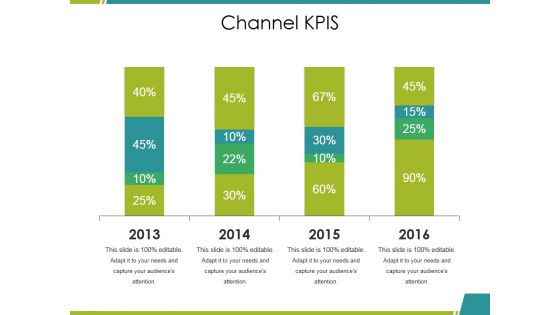
Channel Kpis Ppt PowerPoint Presentation Inspiration Aids
This is a channel kpis ppt powerpoint presentation inspiration aids. This is a four stage process. The stages in this process are business, marketing, graph, percentage, finance.
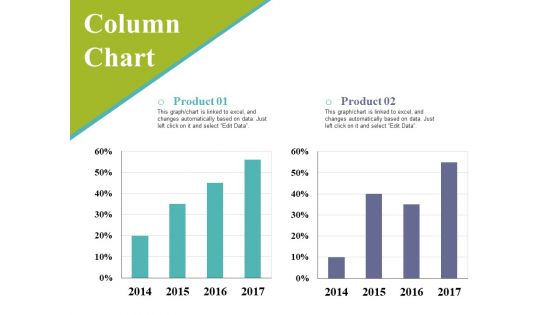
Column Chart Ppt PowerPoint Presentation Styles Background Image
This is a column chart ppt powerpoint presentation styles background image. This is a two stage process. The stages in this process are business, graph, percentage, marketing, strategy.
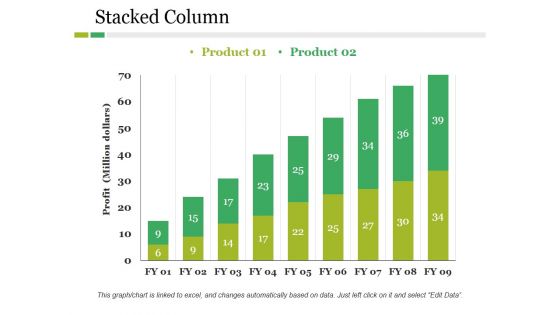
Stacked Column Ppt PowerPoint Presentation Pictures Outfit
This is a stacked column ppt powerpoint presentation pictures outfit. This is a two stage process. The stages in this process are product, profit, growth, bar graph, success.
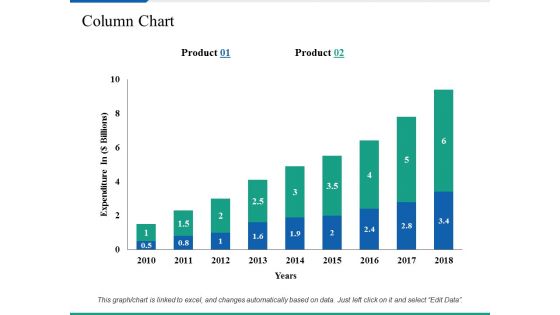
Column Chart Ppt PowerPoint Presentation Ideas Demonstration
This is a column chart ppt powerpoint presentation ideas demonstration. This is a two stage process. The stages in this process are business, marketing, expenditure in, strategy, graph.
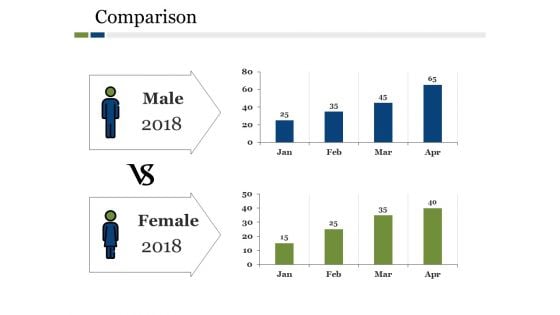
Comparison Ppt PowerPoint Presentation Ideas Show
This is a comparison ppt powerpoint presentation ideas show. This is a two stage process. The stages in this process are comparison, bar graph, growth, management, business.
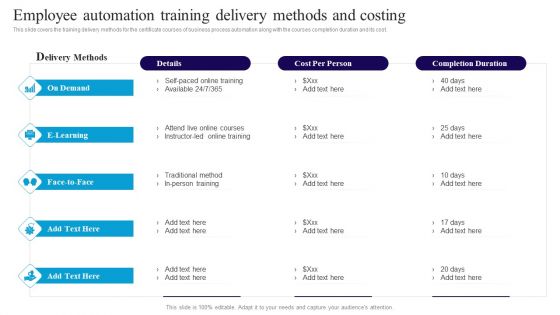
Deploying Automation In Logistics To Improve Employee Automation Training Delivery Template PDF
This slide covers the training delivery methods for the certificate courses of business process automation along with the courses completion duration and its cost.If you are looking for a format to display your unique thoughts, then the professionally designed Deploying Automation In Logistics To Improve Employee Automation Training Delivery Template PDF is the one for you. You can use it as a Google Slides template or a PowerPoint template. Incorporate impressive visuals, symbols, images, and other charts. Modify or reorganize the text boxes as you desire. Experiment with shade schemes and font pairings. Alter, share or cooperate with other people on your work. Download Deploying Automation In Logistics To Improve Employee Automation Training Delivery Template PDF and find out how to give a successful presentation. Present a perfect display to your team and make your presentation unforgettable.
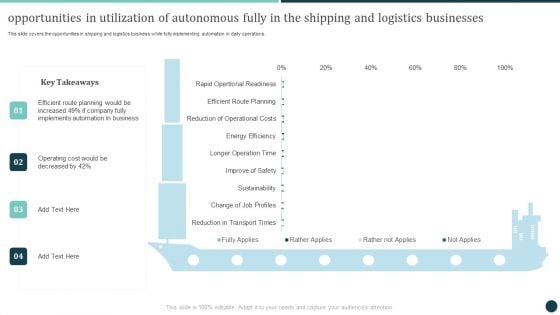
Opportunities In Utilization Of Autonomous Fully In The Shipping And Logistics Businesses Portrait PDF
If you are looking for a format to display your unique thoughts, then the professionally designed Opportunities In Utilization Of Autonomous Fully In The Shipping And Logistics Businesses Portrait PDF is the one for you. You can use it as a Google Slides template or a PowerPoint template. Incorporate impressive visuals, symbols, images, and other charts. Modify or reorganize the text boxes as you desire. Experiment with shade schemes and font pairings. Alter, share or cooperate with other people on your work. Download Opportunities In Utilization Of Autonomous Fully In The Shipping And Logistics Businesses Portrait PDF and find out how to give a successful presentation. Present a perfect display to your team and make your presentation unforgettable.
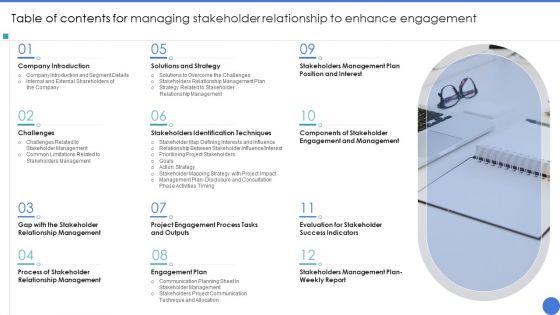
Table Of Contents For Managing Stakeholder Relationship To Enhance Engagement Graphics PDF
If you are looking for a format to display your unique thoughts, then the professionally designed Table Of Contents For Managing Stakeholder Relationship To Enhance Engagement Graphics PDF is the one for you. You can use it as a Google Slides template or a PowerPoint template. Incorporate impressive visuals, symbols, images, and other charts. Modify or reorganize the text boxes as you desire. Experiment with shade schemes and font pairings. Alter, share or cooperate with other people on your work. Download Table Of Contents For Managing Stakeholder Relationship To Enhance Engagement Graphics PDF and find out how to give a successful presentation. Present a perfect display to your team and make your presentation unforgettable.
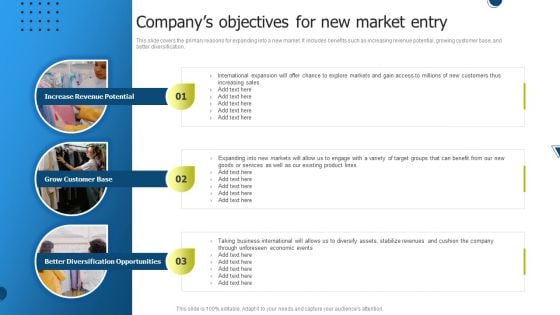
International Market Entry Strategies Companys Objectives For New Market Entry Pictures PDF
This slide covers the. primary reasons for expanding into a new market. It includes benefits such as increasing revenue potential, growing customer base, and better diversification. If you are looking for a format to display your unique thoughts, then the professionally designed International Market Entry Strategies Companys Objectives For New Market Entry Pictures PDF is the one for you. You can use it as a Google Slides template or a PowerPoint template. Incorporate impressive visuals, symbols, images, and other charts. Modify or reorganize the text boxes as you desire. Experiment with shade schemes and font pairings. Alter, share or cooperate with other people on your work. Download International Market Entry Strategies Companys Objectives For New Market Entry Pictures PDF and find out how to give a successful presentation. Present a perfect display to your team and make your presentation unforgettable.
Data Monetization Approach To Drive Business Growth Determine Firm Capability For Direct Monetization Of Data Icons PDF
This slide covers details about capability of firm for direct monetization of data by analyzing it on certain parameters in terms of volume of data, data usability and reliability. If you are looking for a format to display your unique thoughts, then the professionally designed Data Monetization Approach To Drive Business Growth Determine Firm Capability For Direct Monetization Of Data Icons PDF is the one for you. You can use it as a Google Slides template or a PowerPoint template. Incorporate impressive visuals, symbols, images, and other charts. Modify or reorganize the text boxes as you desire. Experiment with shade schemes and font pairings. Alter, share or cooperate with other people on your work. Download Data Monetization Approach To Drive Business Growth Determine Firm Capability For Direct Monetization Of Data Icons PDF and find out how to give a successful presentation. Present a perfect display to your team and make your presentation unforgettable.
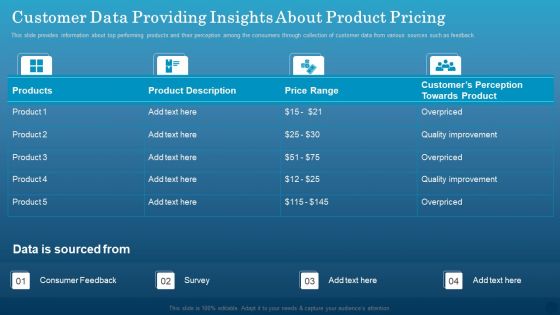
Data Monetization Approach To Drive Business Growth Customer Data Providing Insights About Product Pricing Template PDF
This slide provides information about top performing products and their perception among the consumers through collection of customer data from various sources such as feedback. If you are looking for a format to display your unique thoughts, then the professionally designed Data Monetization Approach To Drive Business Growth Customer Data Providing Insights About Product Pricing Template PDF is the one for you. You can use it as a Google Slides template or a PowerPoint template. Incorporate impressive visuals, symbols, images, and other charts. Modify or reorganize the text boxes as you desire. Experiment with shade schemes and font pairings. Alter, share or cooperate with other people on your work. Download Data Monetization Approach To Drive Business Growth Customer Data Providing Insights About Product Pricing Template PDF and find out how to give a successful presentation. Present a perfect display to your team and make your presentation unforgettable.
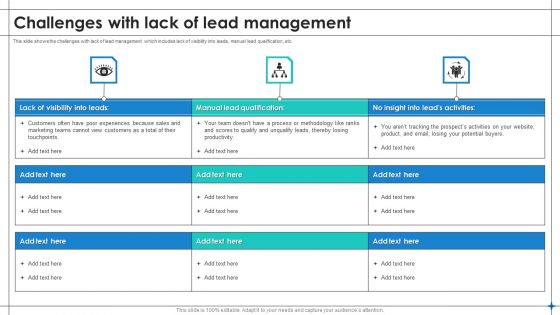
Increase Sales By Lead Generation Challenges With Lack Of Lead Management Mockup PDF
This slide shows the challenges with lack of lead management which includes lack of visibility into leads, manual lead qualification, etc. If you are looking for a format to display your unique thoughts, then the professionally designed Increase Sales By Lead Generation Challenges With Lack Of Lead Management Mockup PDF is the one for you. You can use it as a Google Slides template or a PowerPoint template. Incorporate impressive visuals, symbols, images, and other charts. Modify or reorganize the text boxes as you desire. Experiment with shade schemes and font pairings. Alter, share or cooperate with other people on your work. Download Increase Sales By Lead Generation Challenges With Lack Of Lead Management Mockup PDF and find out how to give a successful presentation. Present a perfect display to your team and make your presentation unforgettable.
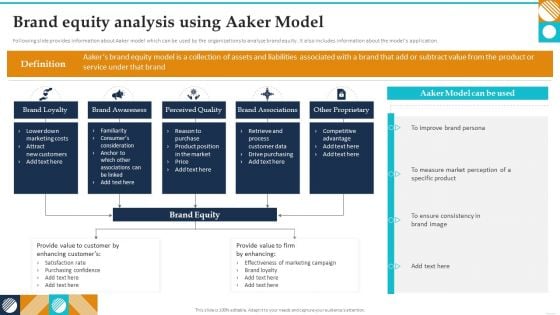
Brand Equity Analysis Using Aaker Model Guide To Brand Value Information PDF
Following slide provides information about Aaker model which can be used by the organizations to analyze brand equity. It also includes information about the models application.If you are looking for a format to display your unique thoughts, then the professionally designed Brand Equity Analysis Using Aaker Model Guide To Brand Value Information PDF is the one for you. You can use it as a Google Slides template or a PowerPoint template. Incorporate impressive visuals, symbols, images, and other charts. Modify or reorganize the text boxes as you desire. Experiment with shade schemes and font pairings. Alter, share or cooperate with other people on your work. Download Brand Equity Analysis Using Aaker Model Guide To Brand Value Information PDF and find out how to give a successful presentation. Present a perfect display to your team and make your presentation unforgettable.
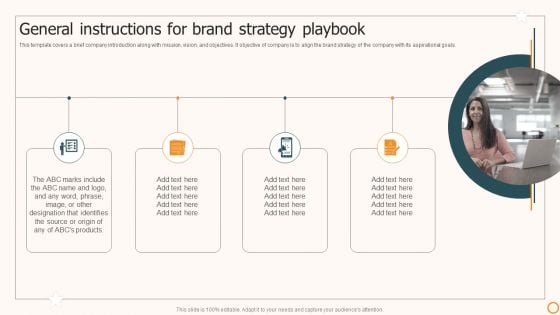
Strategic Brand Playbook General Instructions For Brand Strategy Playbook Themes PDF
This template covers a brief company introduction along with mission, vision, and objectives. It objective of company is to align the brand strategy of the company with its aspirational goals.If you are looking for a format to display your unique thoughts, then the professionally designed Strategic Brand Playbook General Instructions For Brand Strategy Playbook Themes PDF is the one for you. You can use it as a Google Slides template or a PowerPoint template. Incorporate impressive visuals, symbols, images, and other charts. Modify or reorganize the text boxes as you desire. Experiment with shade schemes and font pairings. Alter, share or cooperate with other people on your work. Download Strategic Brand Playbook General Instructions For Brand Strategy Playbook Themes PDF and find out how to give a successful presentation. Present a perfect display to your team and make your presentation unforgettable.
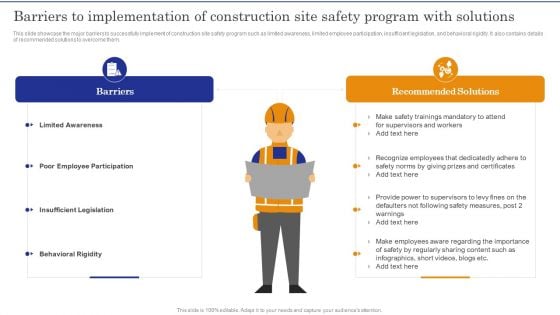
Barriers To Implementation Of Construction Site Safety Program With Solutions Clipart PDF
This slide showcase the major barriers to successfully implement of construction site safety program such as limited awareness, limited employee participation, insufficient legislation, and behavioral rigidity. It also contains details of recommended solutions to overcome them.If you are looking for a format to display your unique thoughts, then the professionally designed Barriers To Implementation Of Construction Site Safety Program With Solutions Clipart PDF is the one for you. You can use it as a Google Slides template or a PowerPoint template. Incorporate impressive visuals, symbols, images, and other charts. Modify or reorganize the text boxes as you desire. Experiment with shade schemes and font pairings. Alter, share or cooperate with other people on your work. Download Barriers To Implementation Of Construction Site Safety Program With Solutions Clipart PDF and find out how to give a successful presentation. Present a perfect display to your team and make your presentation unforgettable.
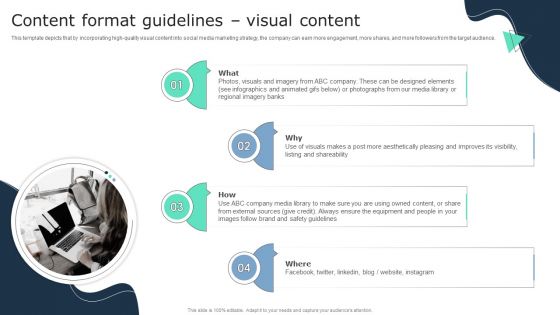
Content Format Guidelines Visual Content Business Social Strategy Guide Demonstration PDF
This template depicts that by incorporating high-quality visual content into social media marketing strategy, the company can earn more engagement, more shares, and more followers from the target audience. If you are looking for a format to display your unique thoughts, then the professionally designed Content Format Guidelines Visual Content Business Social Strategy Guide Demonstration PDF is the one for you. You can use it as a Google Slides template or a PowerPoint template. Incorporate impressive visuals, symbols, images, and other charts. Modify or reorganize the text boxes as you desire. Experiment with shade schemes and font pairings. Alter, share or cooperate with other people on your work. Download Content Format Guidelines Visual Content Business Social Strategy Guide Demonstration PDF and find out how to give a successful presentation. Present a perfect display to your team and make your presentation unforgettable.


 Continue with Email

 Home
Home


