Coordination
Competitive Analysis Template 1 Ppt PowerPoint Presentation Icon Show
This is a competitive analysis template 1 ppt powerpoint presentation icon show. This is a six stage process. The stages in this process are competitive, analysis, business, marketing, bar graph.
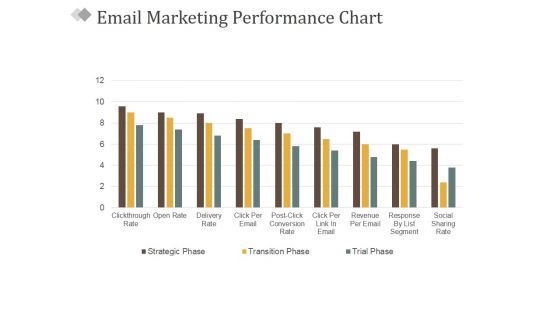
Email Marketing Performance Chart Ppt PowerPoint Presentation Gallery Elements
This is a email marketing performance chart ppt powerpoint presentation gallery elements. This is a nine stage process. The stages in this process are business, marketing, success, management, bar graph.
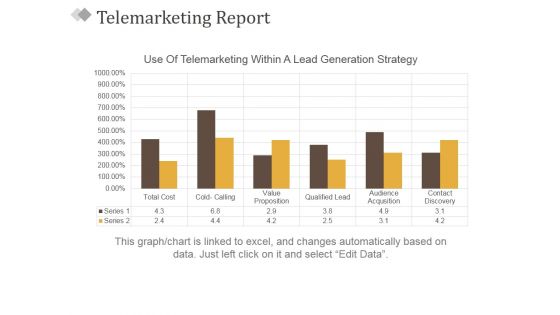
Telemarketing Report Template 2 Ppt PowerPoint Presentation Styles Model
This is a telemarketing report template 2 ppt powerpoint presentation styles model. This is a six stage process. The stages in this process are use of telemarketing within a lead generation strategy, business, bar graph, marketing, success.
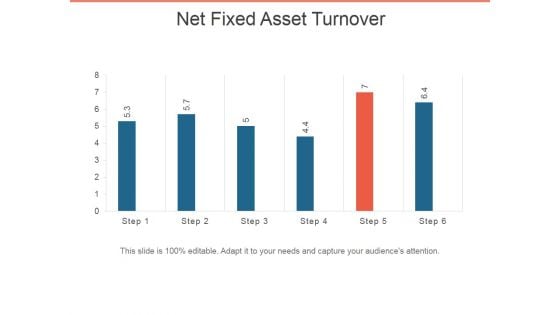
Net Fixed Asset Turnover Ppt PowerPoint Presentation Infographic Template Pictures
This is a net fixed asset turnover ppt powerpoint presentation infographic template pictures. This is a six stage process. The stages in this process are bar graph, business, marketing, presentation, success.
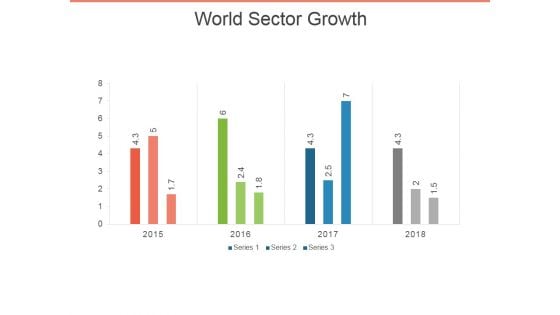
World Sector Growth Ppt PowerPoint Presentation Infographics Objects
This is a world sector growth ppt powerpoint presentation infographics objects. This is a four stage process. The stages in this process are bar graph, business, marketing, success, presentation.
Distribution Growth Ppt PowerPoint Presentation Slides Icons
This is a distribution growth ppt powerpoint presentation slides icons. This is a six stage process. The stages in this process are business, bar graph, finance, marketing, strategy, growth.
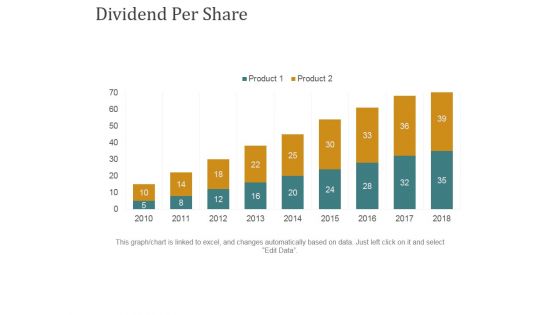
Dividend Per Share Ppt PowerPoint Presentation Summary Rules
This is a dividend per share ppt powerpoint presentation summary rules. This is a nine stage process. The stages in this process are business, bar graph, finance, marketing, strategy, growth.
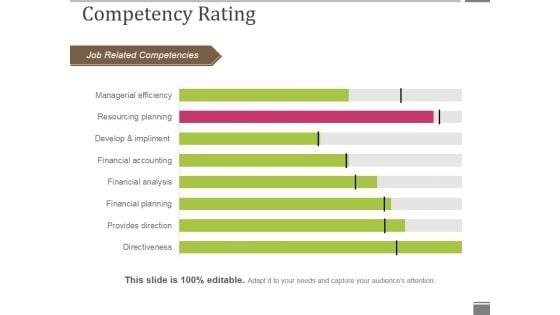
Competency Rating Template 1 Ppt PowerPoint Presentation Outline Smartart
This is a competency rating template 1 ppt powerpoint presentation outline smartart. This is a eight stage process. The stages in this process are job related competencies, competency rating, bar graph, business, marketing.
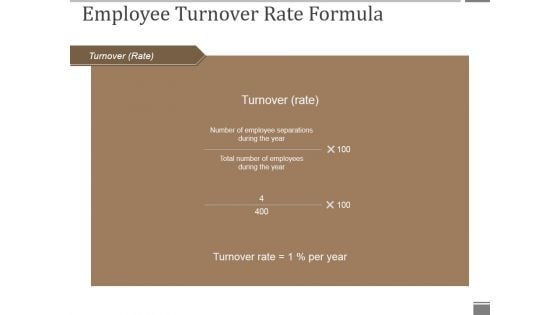
Employee Turnover Rate Formula Ppt PowerPoint Presentation Pictures Aids
This is a employee turnover rate formula ppt powerpoint presentation pictures aids. This is a five stage process. The stages in this process are employee turnover, rate of tune over, business, marketing, bar graph.

Staff Acquisition Cost Cost Per Hire Ppt PowerPoint Presentation Styles Guidelines
This is a staff acquisition cost cost per hire ppt powerpoint presentation styles guidelines. This is a seven stage process. The stages in this process are cost per hire, bar graph, business, marketing, planning.

Staff With Professional Qualification Ppt PowerPoint Presentation Gallery Graphics Pictures
This is a staff with professional qualification ppt powerpoint presentation gallery graphics pictures. This is a five stage process. The stages in this process are qualification, bar graph, business, marketing, success.
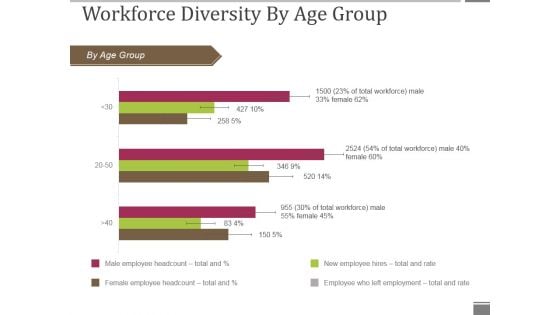
Workforce Diversity By Age Group Ppt PowerPoint Presentation Visual Aids Gallery
This is a workforce diversity by age group ppt powerpoint presentation visual aids gallery. This is a three stage process. The stages in this process are by age group, bar graph, business, marketing, presentation.
Workforce Diversity By Region Ppt PowerPoint Presentation Icon Graphics Pictures
This is a workforce diversity by region ppt powerpoint presentation icon graphics pictures. This is a four stage process. The stages in this process are by region, bar graph, business, presentation, marketing.
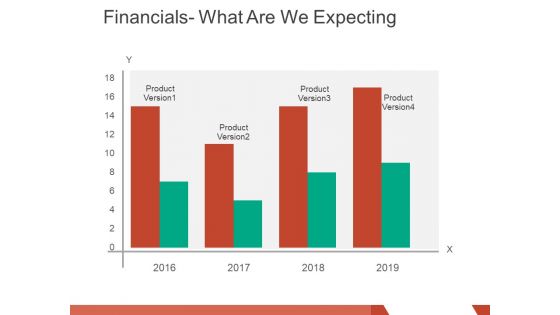
financials what are we expecting ppt powerpoint presentation layouts graphics pictures
This is a financials what are we expecting ppt powerpoint presentation layouts graphics pictures. This is a four stage process. The stages in this process are product version, business, marketing, finance, graph.
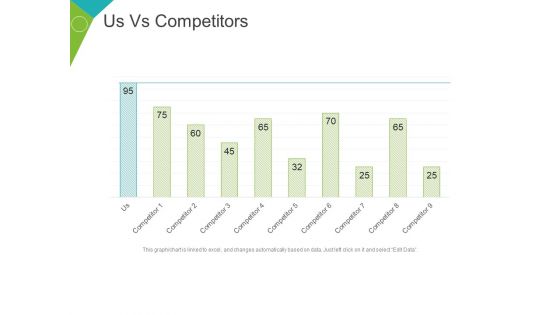
Us Vs Competitors Template 2 Ppt PowerPoint Presentation File Show
This is a us vs competitors template 2 ppt powerpoint presentation file show. This is a nine stage process. The stages in this process are competitor, graph, business, marketing, finance.
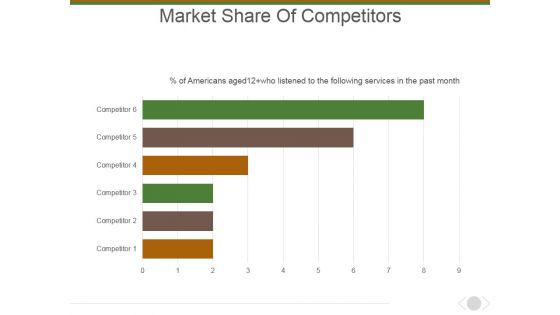
Market Share Of Competitors Ppt PowerPoint Presentation Layouts Picture
This is a market share of competitors ppt powerpoint presentation layouts picture. This is a six stage process. The stages in this process are marketing, business, management, bar graph, presentation.
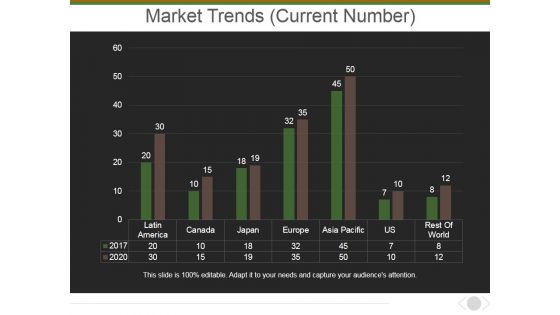
Market Trends Current Number Ppt PowerPoint Presentation Outline Rules
This is a market trends current number ppt powerpoint presentation outline rules. This is a seven stage process. The stages in this process are market, bar graph, business, country, planning.
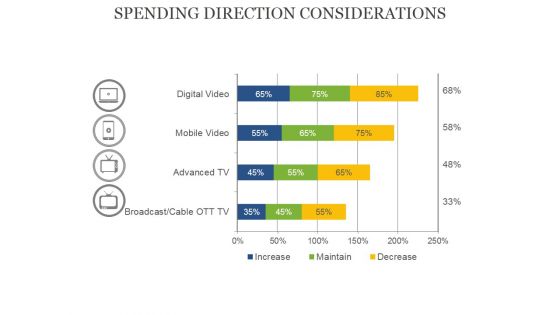
Spending Direction Considerations Ppt PowerPoint Presentation Portfolio Graphics Template
This is a spending direction considerations ppt powerpoint presentation portfolio graphics template. This is a four stage process. The stages in this process are bar graph, business, presentation, percentage, finance.
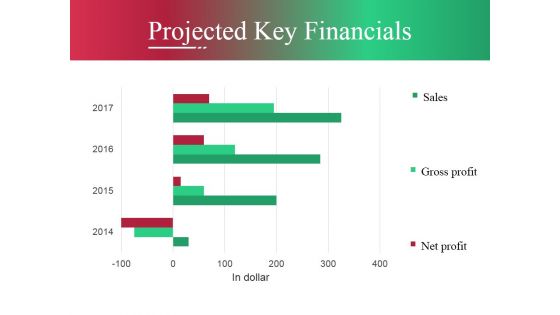
Projected Key Financials Ppt PowerPoint Presentation Pictures Master Slide
This is a projected key financials ppt powerpoint presentation pictures master slide. This is a three stage process. The stages in this process are business, marketing, line, graph, success.
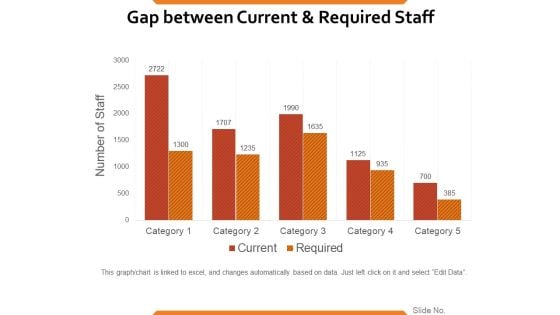
Gap Between Current And Required Staff Ppt PowerPoint Presentation Ideas Format Ideas
This is a gap between current and required staff ppt powerpoint presentation ideas format ideas. This is a five stage process. The stages in this process are number of staff, category, current, graph, finance.
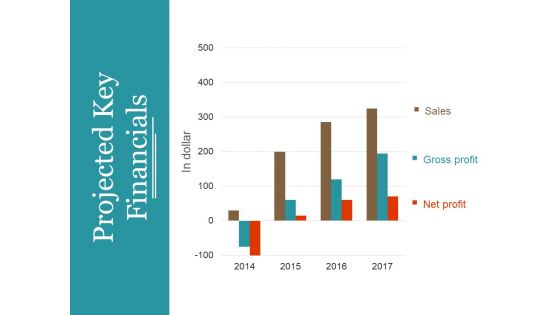
Projected Key Financials Template 1 Ppt PowerPoint Presentation Summary Professional
This is a projected key financials template 1 ppt powerpoint presentation summary professional. This is a three stage process. The stages in this process are in dollar, sales, gross profit, net profit, graph, year.
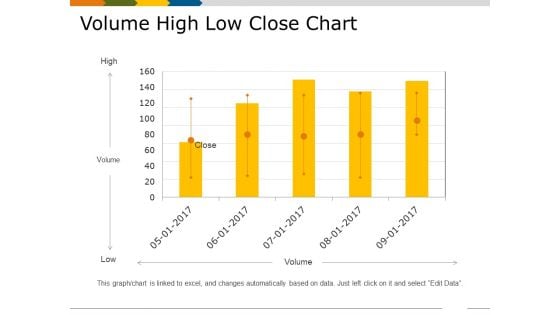
Volume High Low Close Chart Ppt PowerPoint Presentation Gallery Ideas
This is a volume high low close chart ppt powerpoint presentation gallery ideas. This is a five stage process. The stages in this process are high, volume, low, graph, business.
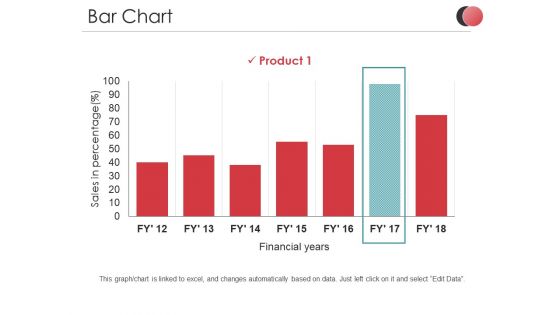
Bar Chart Ppt PowerPoint Presentation Outline Introduction
This is a bar chart ppt powerpoint presentation outline introduction. This is a one stage process. The stages in this process are sales in percentage, product, business, financial years, graph.
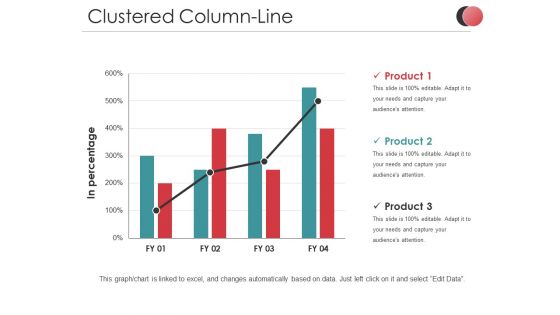
Clustered Column Line Ppt PowerPoint Presentation Infographics Templates
This is a clustered column line ppt powerpoint presentation infographics templates. This is a three stage process. The stages in this process are in percentage, business, marketing, product, finance, graph.
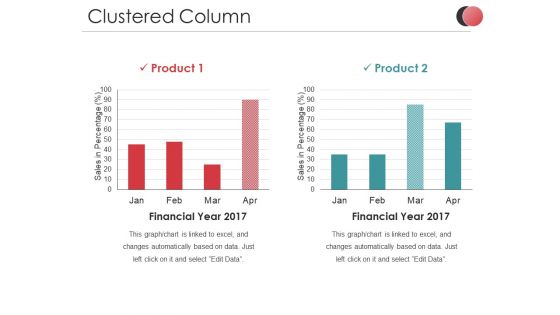
Clustered Column Ppt PowerPoint Presentation Slides Ideas
This is a clustered column ppt powerpoint presentation slides ideas. This is a two stage process. The stages in this process are sales in percentage, business, marketing, finance, graph.
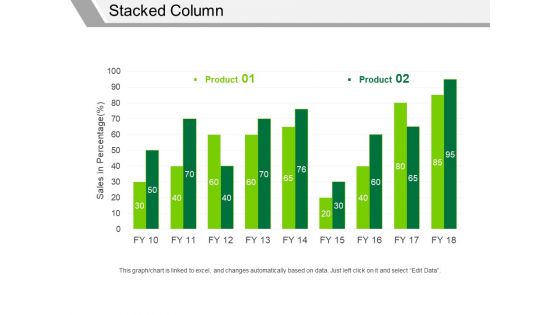
Stacked Column Ppt PowerPoint Presentation Infographics Samples
This is a stacked column ppt powerpoint presentation infographics samples. This is a two stage process. The stages in this process are product, sales in percentage, business, marketing, graph.
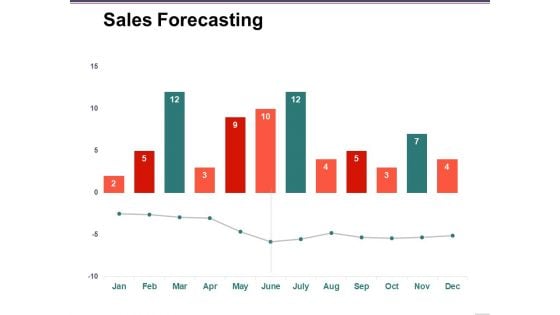
Sales Forecasting Template 2 Ppt PowerPoint Presentation Infographic Template Examples
This is a sales forecasting template 2 ppt powerpoint presentation infographic template examples. This is a two stage process. The stages in this process are forecasting, business, marketing, finance, graph.
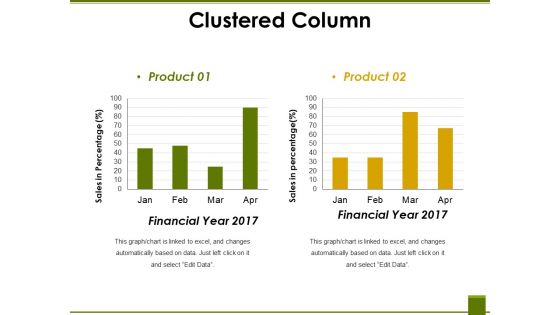
Clustered Column Ppt PowerPoint Presentation Ideas Graphic Tips
This is a clustered column ppt powerpoint presentation ideas graphic tips. This is a two stage process. The stages in this process are financial year, sales in percentage, product, graph, business.

Column Chart Ppt PowerPoint Presentation Layouts Ideas
This is a column chart ppt powerpoint presentation layouts ideas. This is a two stage process. The stages in this process are dollars in thousands, strategy, business, graph, product.
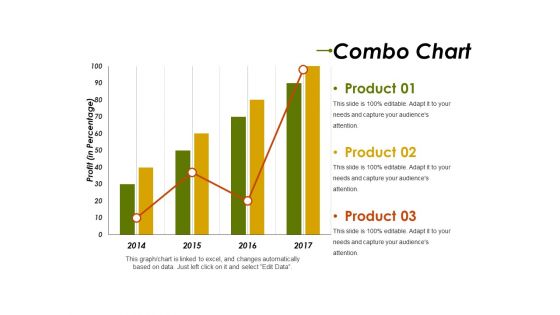
Combo Chart Ppt PowerPoint Presentation Infographics Introduction
This is a combo chart ppt powerpoint presentation infographics introduction. This is a three stage process. The stages in this process are profit in percentage, business, graph, strategy, product.
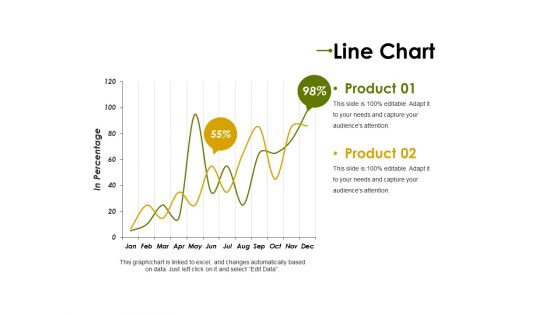
Line Chart Ppt PowerPoint Presentation Professional Clipart Images
This is a line chart ppt powerpoint presentation professional clipart images. This is a two stage process. The stages in this process are product, in percentage, graph, percentage, finance, business.
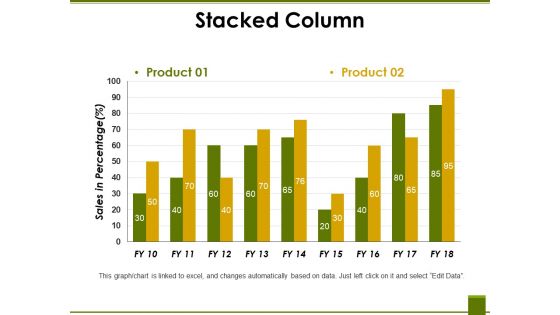
Stacked Column Ppt PowerPoint Presentation Professional Vector
This is a stacked column ppt powerpoint presentation professional vector. This is a two stage process. The stages in this process are product, sales in percentage, business, marketing, graph.
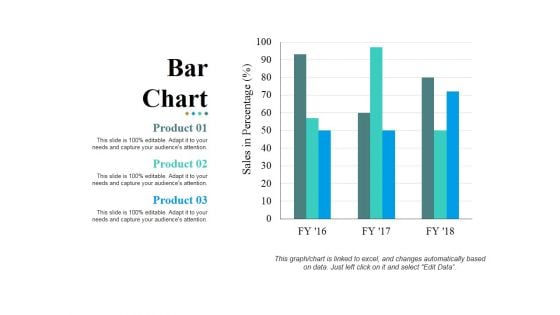
Bar Chart Ppt PowerPoint Presentation Layouts Pictures
This is a bar chart ppt powerpoint presentation layouts pictures. This is a three stage process. The stages in this process are bar graph, product, sales in percentage, business, marketing.
Scatter Chart Ppt PowerPoint Presentation Professional Icons
This is a scatter chart ppt powerpoint presentation professional icons. This is a six stage process. The stages in this process are in dollars, in percentage, graph, business, marketing.
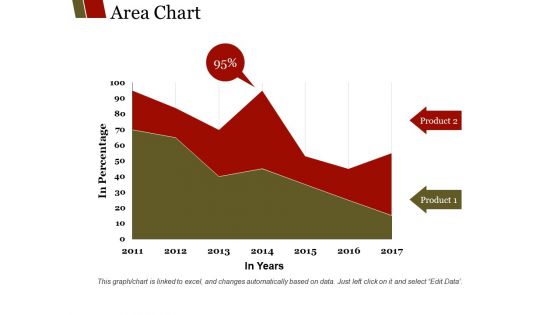
Area Chart Ppt PowerPoint Presentation Show Templates
This is a area chart ppt powerpoint presentation show templates. This is a two stage process. The stages in this process are product, in percentage, in years, finance, graph.
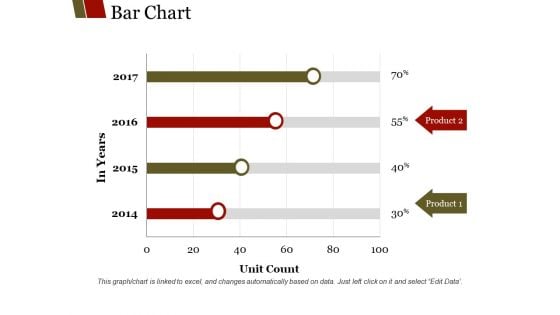
Bar Chart Ppt PowerPoint Presentation Outline Guidelines
This is a bar chart ppt powerpoint presentation outline guidelines. This is a four stage process. The stages in this process are product, unit count, in years, graph, finance, business.
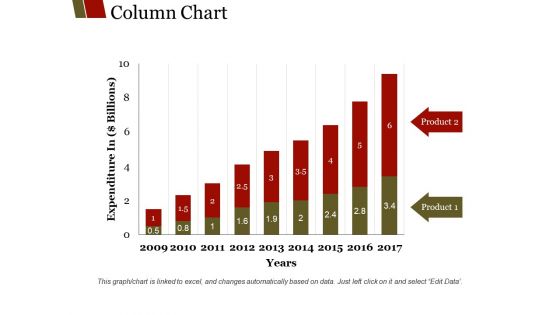
Column Chart Ppt PowerPoint Presentation Summary Graphics
This is a column chart ppt powerpoint presentation summary graphics. This is a nine stage process. The stages in this process are product, years, expenditure in billions, graph, business.
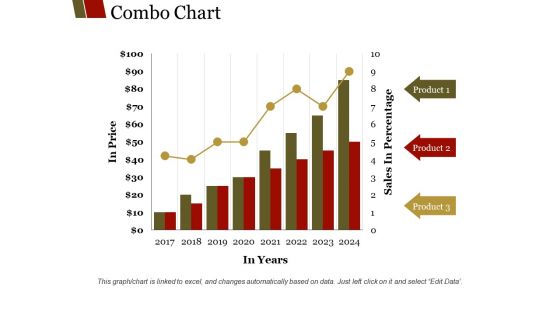
Combo Chart Ppt PowerPoint Presentation Summary Layouts
This is a combo chart ppt powerpoint presentation summary layouts. This is a eight stage process. The stages in this process are product, sales in percentage, in years, in price, graph.
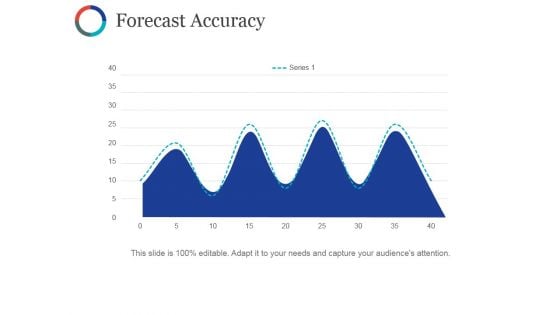
Forecast Accuracy Template Ppt PowerPoint Presentation Styles Format Ideas
This is a forecast accuracy template ppt powerpoint presentation styles format ideas. This is a four stage process. The stages in this process are business, marketing, strategy, graph, planning.
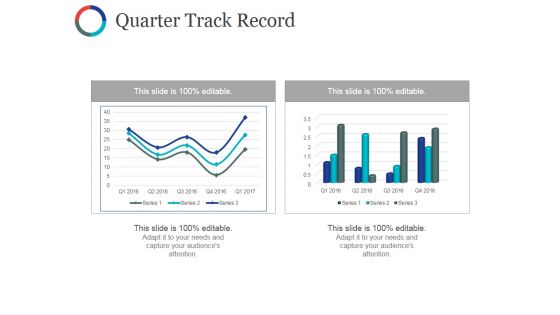
Quarter Track Record Ppt PowerPoint Presentation Professional Layout Ideas
This is a quarter track record ppt powerpoint presentation professional layout ideas. This is a two stage process. The stages in this process are business, marketing, finance, graph, plan.
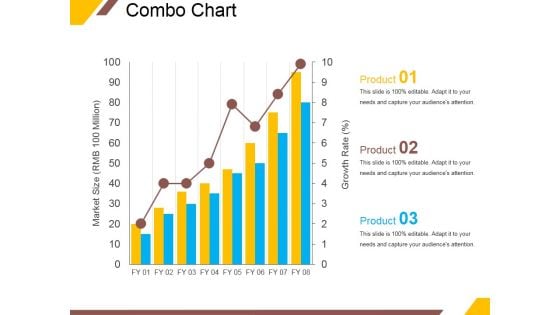
Combo Chart Ppt PowerPoint Presentation Professional Slide Download
This is a combo chart ppt powerpoint presentation professional slide download. This is a three stage process. The stages in this process are market size, growth rate, product, graph, growth.
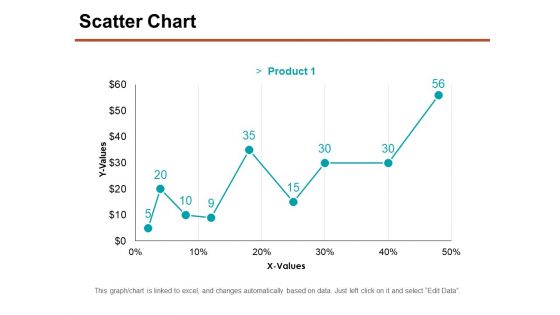
Scatter Chart Ppt PowerPoint Presentation Ideas Templates
This is a scatter chart ppt powerpoint presentation ideas templates. This is a nine stage process. The stages in this process are y values, x values, product, graph, business.
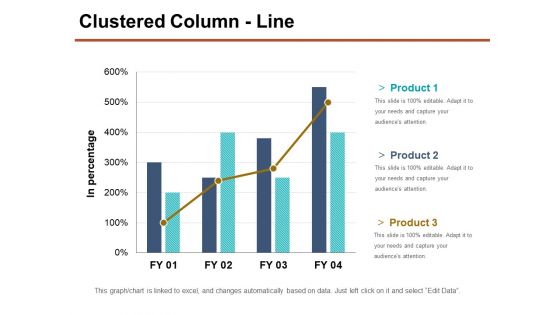
Clustered Column Line Ppt PowerPoint Presentation Inspiration Layouts
This is a clustered column line ppt powerpoint presentation inspiration layouts. This is a four stage process. The stages in this process are in percentage, product, business, strategy, graph.
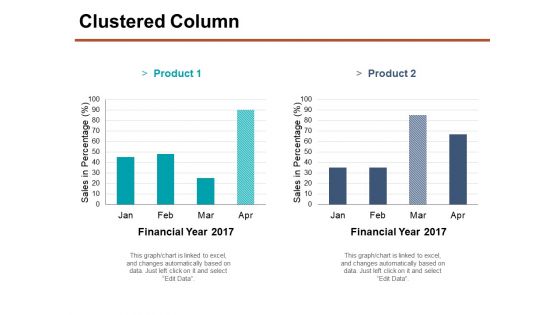
Clustered Column Ppt PowerPoint Presentation Portfolio Smartart
This is a clustered column ppt powerpoint presentation portfolio smartart. This is a two stage process. The stages in this process are financial year, product, sales in percentage, finance, business, graph.
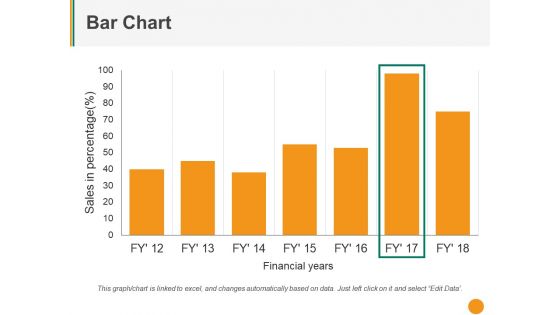
Bar Chart Ppt PowerPoint Presentation Styles Outfit
This is a bar chart ppt powerpoint presentation styles outfit. This is a Seven stage process. The stages in this process are sales in percentage, financial years, graph, business.
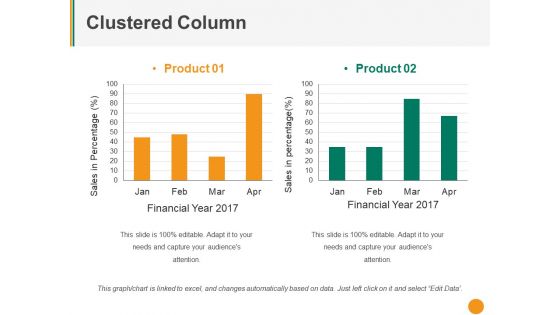
Clustered Column Ppt PowerPoint Presentation Pictures Mockup
This is a clustered column ppt powerpoint presentation pictures mockup. This is a two stage process. The stages in this process are product, sales in percentage, financial year, graph, business.
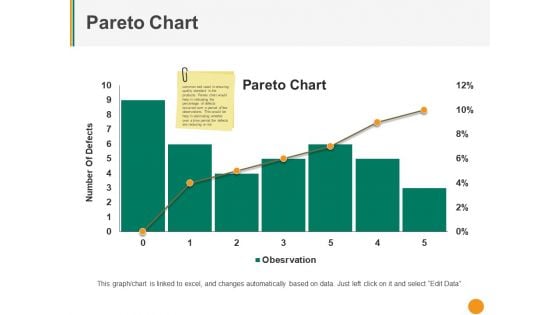
Pareto Chart Ppt PowerPoint Presentation Inspiration Master Slide
This is a pareto chart ppt powerpoint presentation inspiration master slide. This is a six stage process. The stages in this process are number of defects, pareto chart, finance, business, graph.
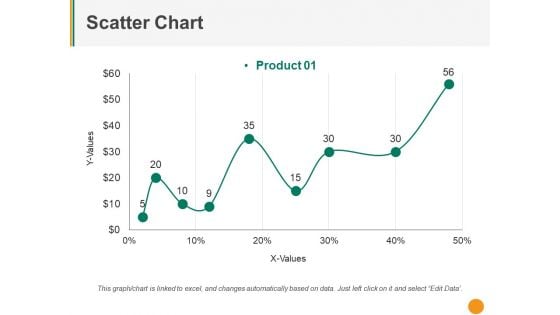
Scatter Chart Ppt PowerPoint Presentation Summary Smartart
This is a scatter chart ppt powerpoint presentation summary smartart. This is a nine stage process. The stages in this process are y values, x values, product, business, graph.
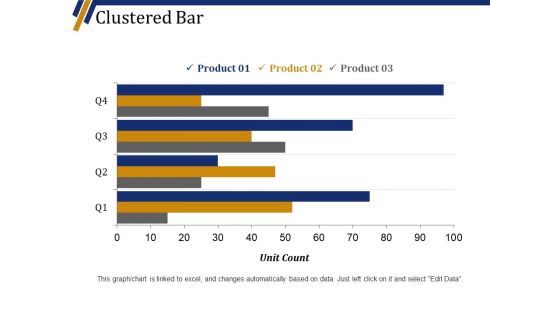
Clustered Bar Ppt PowerPoint Presentation Show Slide Portrait
This is a clustered bar ppt powerpoint presentation show slide portrait. This is a four stage process. The stages in this process are product, unit count, graph, business, marketing.
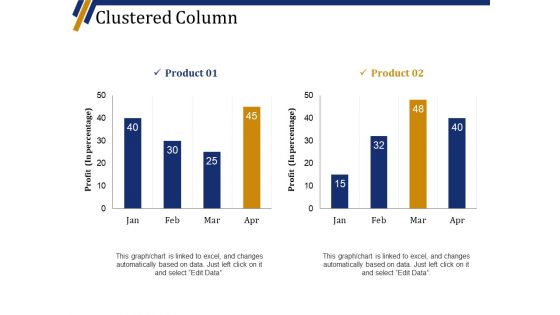
Clustered Column Ppt PowerPoint Presentation Professional Graphic Tips
This is a clustered column ppt powerpoint presentation professional graphic tips. This is a two stage process. The stages in this process are product, profit in percentage, graph, business, marketing.
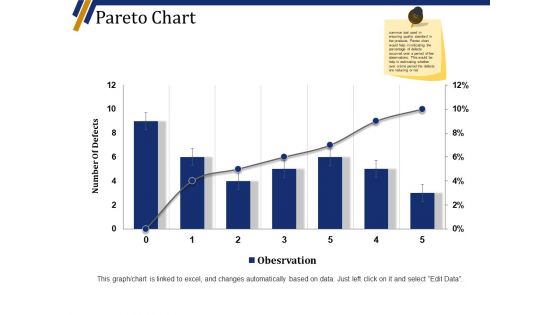
Pareto Chart Ppt PowerPoint Presentation File Infographic Template
This is a pareto chart ppt powerpoint presentation file infographic template. This is a six stage process. The stages in this process are number of defects, business, marketing, graph.
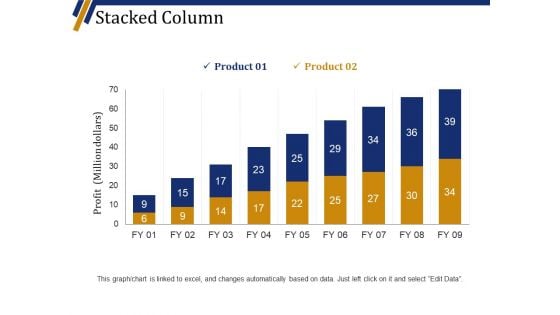
Stacked Column Ppt PowerPoint Presentation Professional Template
This is a stacked column ppt powerpoint presentation professional template. This is a nine stage process. The stages in this process are product, profit million dollars, business, marketing, graph.
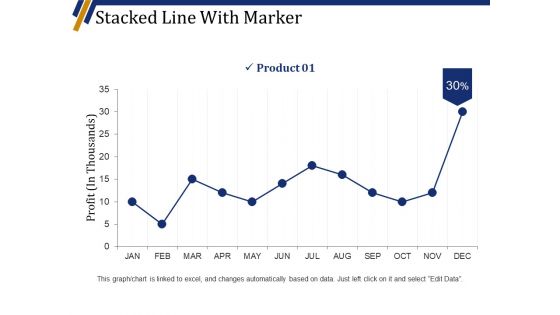
Stacked Line With Marker Ppt PowerPoint Presentation Professional Pictures
This is a stacked line with marker ppt powerpoint presentation professional pictures. This is a twelve stage process. The stages in this process are product, profit in thousands, business, graph, marketing.
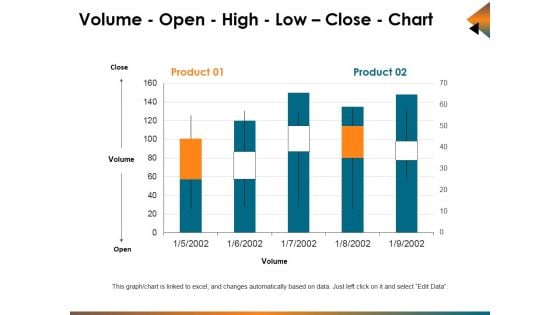
Volume Open High Low Close Chart Ppt PowerPoint Presentation Ideas Graphics Example
This is a volume open high low close chart ppt powerpoint presentation ideas graphics example. This is a five stage process. The stages in this process are business, bar graph, stock, cost, market.
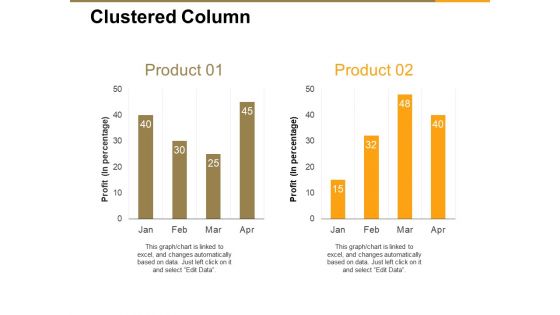
Clustered Column Ppt PowerPoint Presentation Inspiration Shapes
This is a clustered column ppt powerpoint presentation inspiration shapes. This is a two stage process. The stages in this process are profit in percentage, business, marketing, graph, finance.
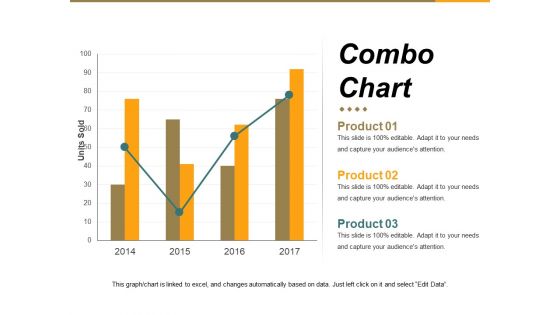
Combo Chart Ppt PowerPoint Presentation Infographics Example Introduction
This is a combo chart ppt powerpoint presentation infographics example introduction. This is a four stage process. The stages in this process are units sold, business, marketing, graph, growth.
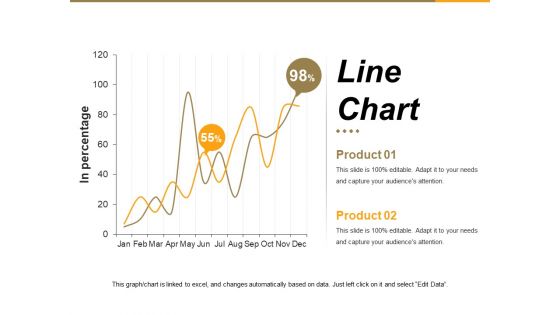
Line Chart Ppt PowerPoint Presentation Summary File Formats
This is a line chart ppt powerpoint presentation summary file formats. This is a two stage process. The stages in this process are in percentage, graph, business, marketing, growth.
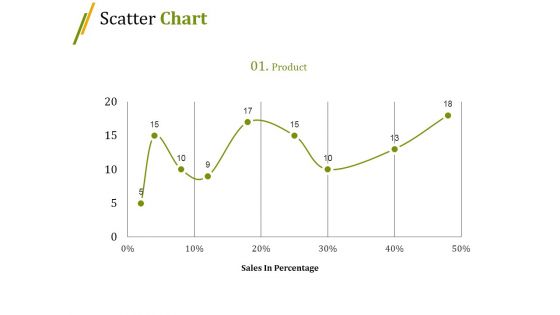
Scatter Chart Ppt PowerPoint Presentation Slides Summary
This is a scatter chart ppt powerpoint presentation slides summary. This is a nine stage process. The stages in this process are sales in percentage, growth, graph, business, marketing.
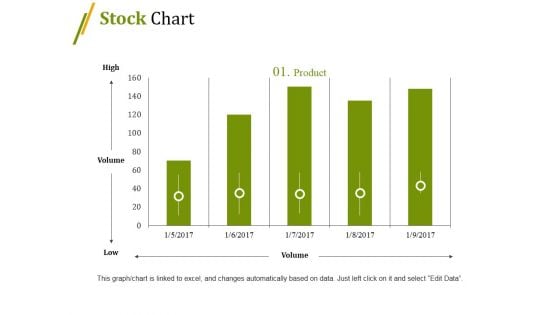
Stock Chart Ppt PowerPoint Presentation Summary File Formats
This is a stock chart ppt powerpoint presentation summary file formats. This is a five stage process. The stages in this process are high, volume, low, business, graph, finance.
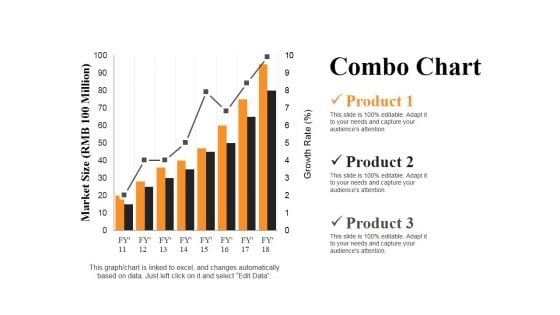
Combo Chart Ppt PowerPoint Presentation Summary Slides
This is a combo chart ppt powerpoint presentation summary slides. This is a three stage process. The stages in this process are market size, product, growth rate, bar graph, success.


 Continue with Email

 Home
Home


