Coordination
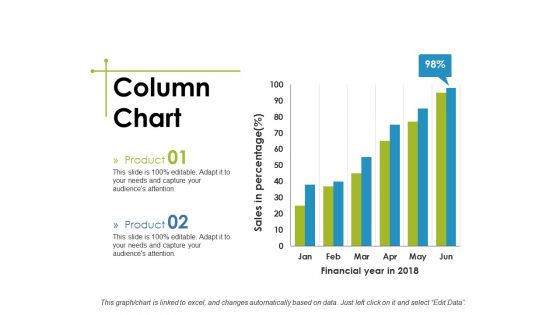
Column Chart Ppt PowerPoint Presentation Show Structure
This is a column chart ppt powerpoint presentation show structure. This is a two stage process. The stages in this process are business, financial year in, sales in percentage, marketing, graph.
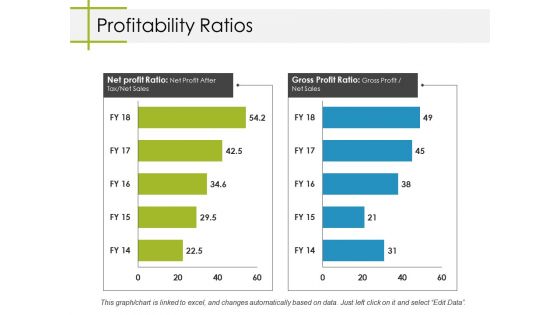
Profitability Ratios Ppt PowerPoint Presentation Inspiration Information
This is a profitability ratios ppt powerpoint presentation inspiration information. This is a two stage process. The stages in this process are business, net profit ratio, gross profit ratio, marketing, graph.
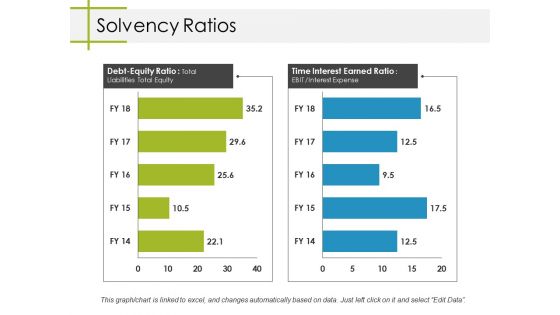
Solvency Ratios Ppt PowerPoint Presentation Professional Rules
This is a solvency ratios ppt powerpoint presentation professional rules. This is a two stage process. The stages in this process are business, marketing, debt equity ratio, time interest earned ratio, graph.
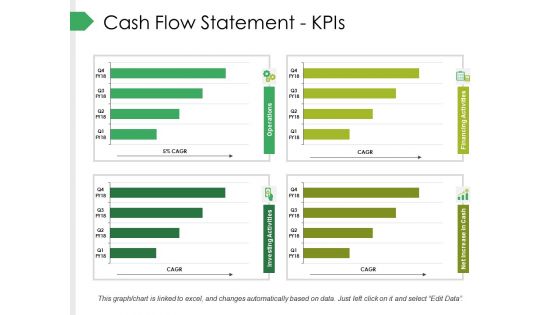
Cash Flow Statement Kpis Ppt PowerPoint Presentation Pictures Graphics
This is a cash flow statement kpis ppt powerpoint presentation pictures graphics. This is a four stage process. The stages in this process are business, marketing, graph, finance, strategy.
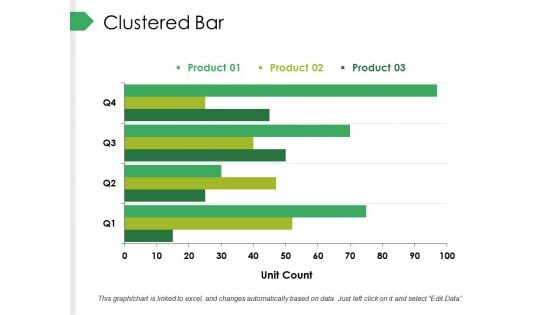
Clustered Bar Ppt PowerPoint Presentation Pictures Clipart Images
This is a clustered bar ppt powerpoint presentation pictures clipart images. This is a three stage process. The stages in this process are business, marketing, graph, finance, strategy, unit count.
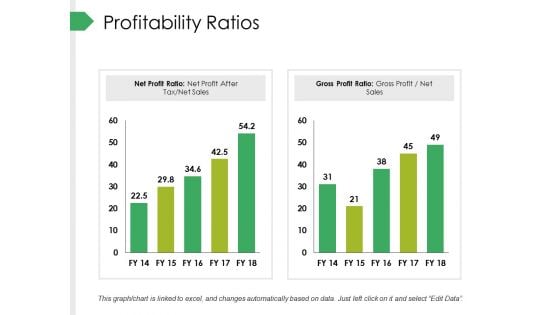
Profitability Ratios Ppt PowerPoint Presentation Summary Outline
This is a profitability ratios ppt powerpoint presentation summary outline. This is a two stage process. The stages in this process are business, net profit ratio, gross profit ratio, marketing, graph.
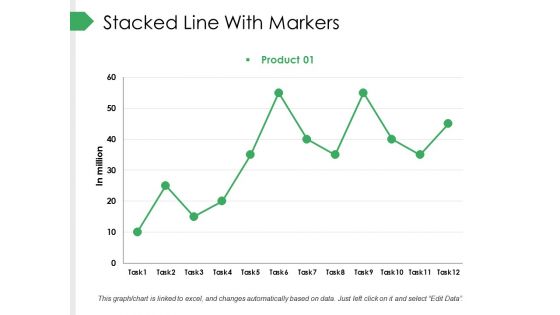
Stacked Line With Markers Ppt PowerPoint Presentation Pictures Design Templates
This is a stacked line with markers ppt powerpoint presentation pictures design templates. This is a one stage process. The stages in this process are business, marketing, finance, in million, graph.
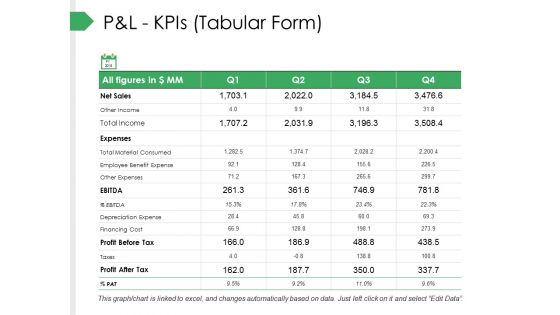
P And L Kpis Tabular Form Ppt PowerPoint Presentation Pictures Gallery
This is a p and l kpis tabular form ppt powerpoint presentation pictures gallery. This is a four stage process. The stages in this process are business, marketing, graph, strategy, finance.
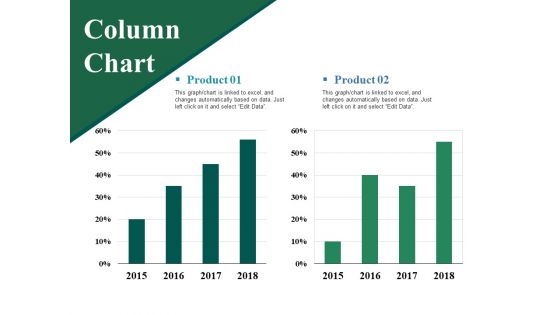
Column Chart Ppt PowerPoint Presentation Layouts Vector
This is a column chart ppt powerpoint presentation layouts vector. This is a two stage process. The stages in this process are product, column chart, bar graph, percentage, finance.
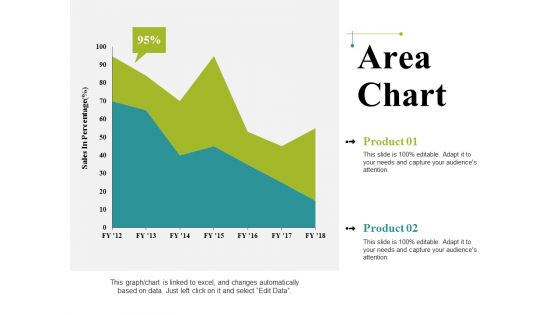
Area Chart Ppt PowerPoint Presentation Infographics Graphics Pictures
This is a area chart ppt powerpoint presentation infographics graphics pictures. This is a two stage process. The stages in this process are business, sales in percentage, area chart, marketing, graph.
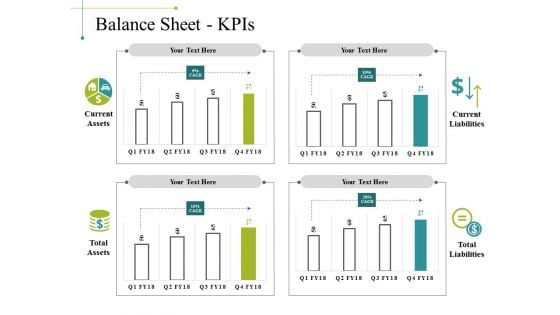
Balance Sheet Kpis Template 1 Ppt PowerPoint Presentation Show Inspiration
This is a balance sheet kpis template 1 ppt powerpoint presentation show inspiration. This is a four stage process. The stages in this process are business, marketing, graph, current liabilities, total liabilities.
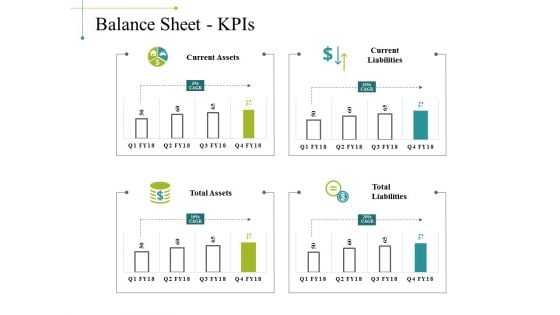
Balance Sheet Kpis Template 2 Ppt PowerPoint Presentation Gallery Example
This is a balance sheet kpis template 2 ppt powerpoint presentation gallery example. This is a four stage process. The stages in this process are business, marketing, graph, current liabilities, total liabilities.
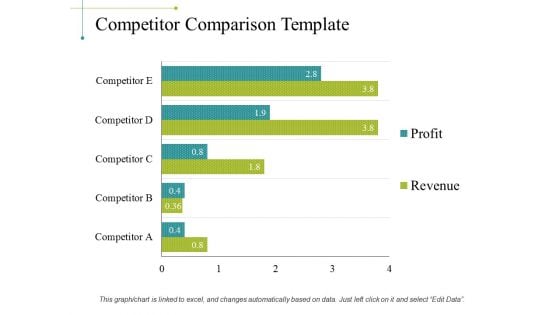
Competitor Comparison Template 1 Ppt PowerPoint Presentation Infographic Template Mockup
This is a competitor comparison template 1 ppt powerpoint presentation infographic template mockup. This is a five stage process. The stages in this process are business, marketing, graph, finance, strategy.
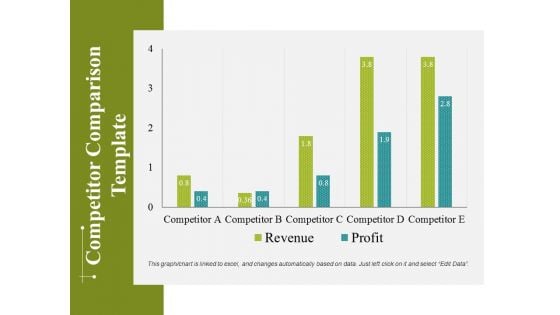
Competitor Comparison Template 2 Ppt PowerPoint Presentation Infographics Objects
This is a competitor comparison template 2 ppt powerpoint presentation infographics objects. This is a five stage process. The stages in this process are business, marketing, graph, finance, strategy.

Competitor Market Share And Sales Revenues Ppt PowerPoint Presentation Summary Influencers
This is a competitor market share and sales revenues ppt powerpoint presentation summary influencers. This is a four stage process. The stages in this process are business, marketing, graph, finance, strategy.
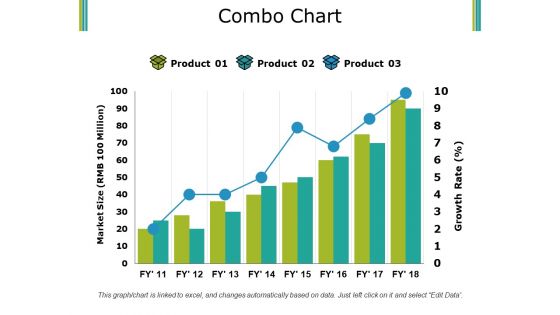
Combo Chart Ppt PowerPoint Presentation Pictures Summary
This is a combo chart ppt powerpoint presentation pictures summary. This is a three stage process. The stages in this process are product, market size, growth rate, bar graph, success.
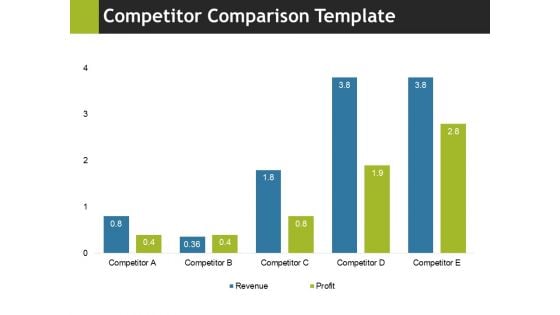
Competitor Comparison Template 1 Ppt PowerPoint Presentation Layouts Slide Portrait
This is a competitor comparison template 1 ppt powerpoint presentation layouts slide portrait. This is a four stage process. The stages in this process are business, marketing, graph, finance, strategy.
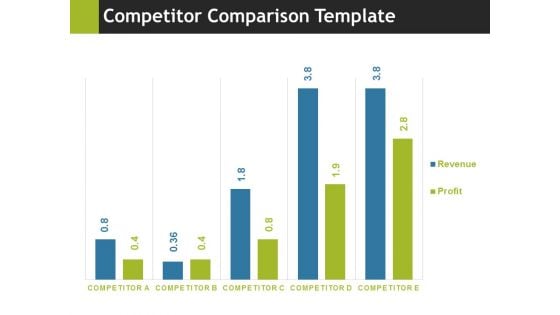
Competitor Comparison Template 2 Ppt PowerPoint Presentation Inspiration Images
This is a competitor comparison template 2 ppt powerpoint presentation inspiration images. This is a five stage process. The stages in this process are business, marketing, graph, finance, strategy.
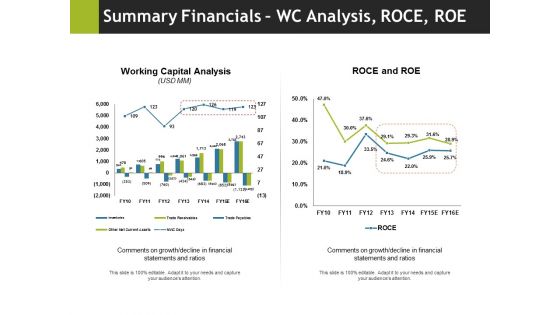
Summary Financials Wc Analysis Roce Roe Ppt PowerPoint Presentation Ideas Rules
This is a summary financials wc analysis roce roe ppt powerpoint presentation ideas rules. This is a two stage process. The stages in this process are business, marketing, working capital analysis, roce and roe, graph.
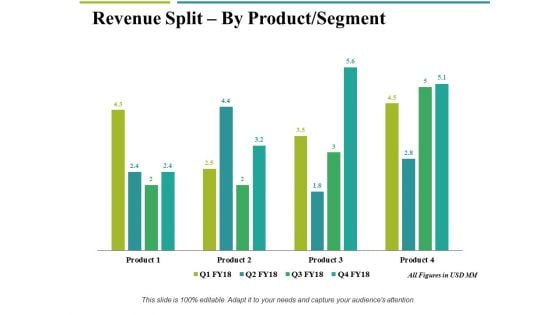
Revenue Split By Product Segment Template 2 Ppt PowerPoint Presentation Gallery Example File
This is a revenue split by product segment template 2 ppt powerpoint presentation gallery example file. This is a four stage process. The stages in this process are business, marketing, graph, finance, revenue split.
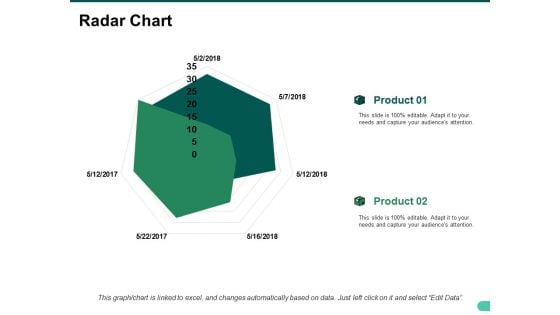
Radar Chart Ppt PowerPoint Presentation Show Graphic Images
This is a radar chart ppt powerpoint presentation show graphic images. This is a two stage process. The stages in this process are business, radar chart, marketing, graph, strategy.
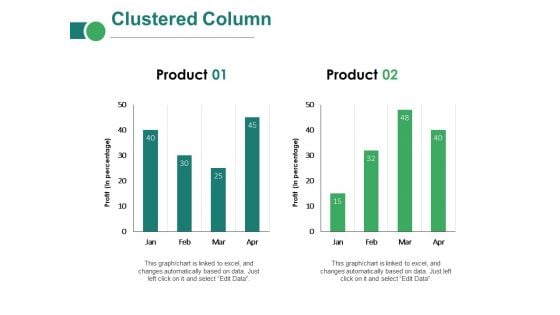
Clustered Column Ppt PowerPoint Presentation Inspiration Introduction
This is a clustered column ppt powerpoint presentation inspiration introduction. This is a two stage process. The stages in this process are business, marketing, in percentage, finance, graph, strategy.
Area Chart Ppt PowerPoint Presentation Icon Aids
This is a area chart ppt powerpoint presentation icon aids. This is a three stage process. The stages in this process are financial years, sales in percentage, business, marketing, graph.
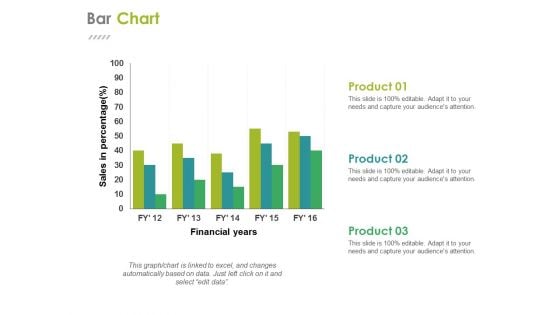
Bar Chart Ppt PowerPoint Presentation Summary Themes
This is a bar chart ppt powerpoint presentation summary themes. This is a three stage process. The stages in this process are financial years, sales in percentage, business, marketing, graph.
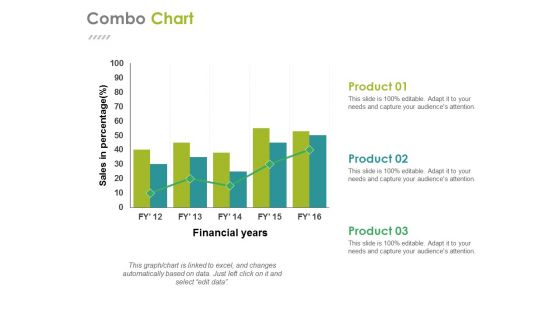
Combo Chart Ppt PowerPoint Presentation Gallery Design Ideas
This is a combo chart ppt powerpoint presentation gallery design ideas. This is a three stage process. The stages in this process are business, financial years, sales in percentage, finance, graph.
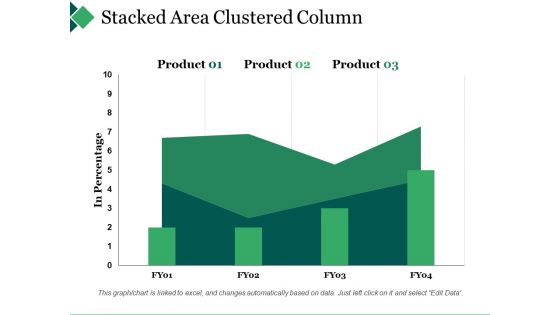
Stacked Area Clustered Column Ppt PowerPoint Presentation Gallery Gridlines
This is a stacked area clustered column ppt powerpoint presentation gallery gridlines. This is a three stage process. The stages in this process are bar graph, product, in percentage.
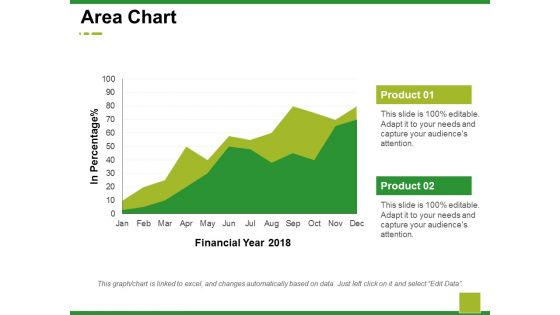
Area Chart Ppt PowerPoint Presentation Model Demonstration
This is a area chart ppt powerpoint presentation model demonstration. This is a two stage process. The stages in this process are business, marketing, financial year, in percentage, graph.
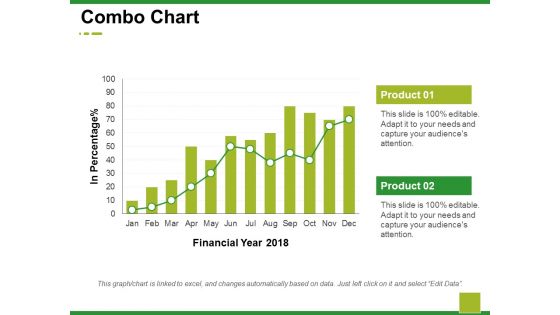
Combo Chart Ppt PowerPoint Presentation Summary Background Images
This is a combo chart ppt powerpoint presentation summary background images. This is a two stage process. The stages in this process are business, marketing, financial year, in percentage, graph.
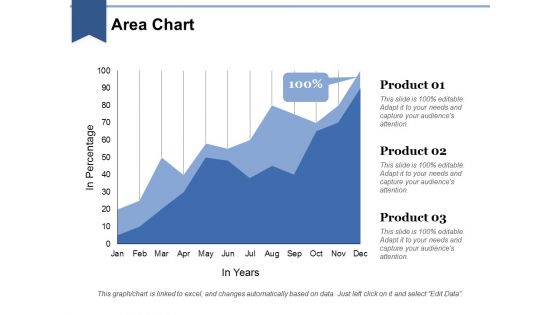
Area Chart Ppt PowerPoint Presentation Layouts Graphic Images
This is a area chart ppt powerpoint presentation layouts graphic images. This is a three stage process. The stages in this process are business, in years, marketing, in percentage, finance, graph.
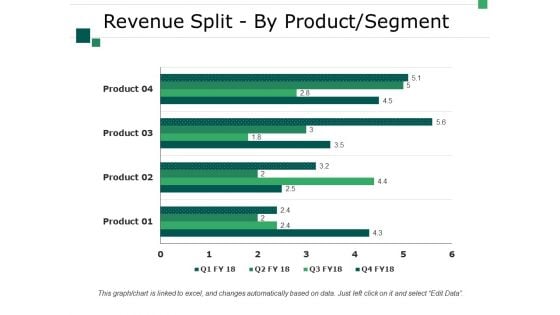
Revenue Split By Product Segment Template 2 Ppt PowerPoint Presentation Summary Good
This is a revenue split by product segment template 2 ppt powerpoint presentation summary good. This is a four stage process. The stages in this process are business, marketing, finance, strategy, graph.
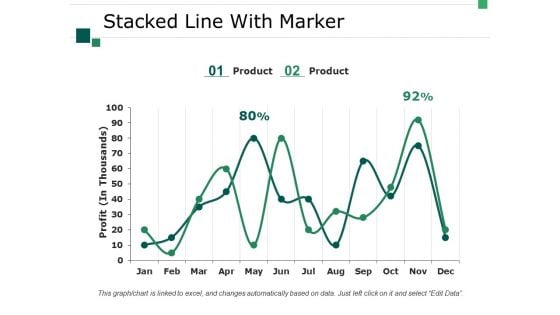
Stacked Line With Marker Ppt PowerPoint Presentation Professional Designs Download
This is a stacked line with marker ppt powerpoint presentation professional designs download. This is a two stage process. The stages in this process are business, marketing, strategy, graph, profit.
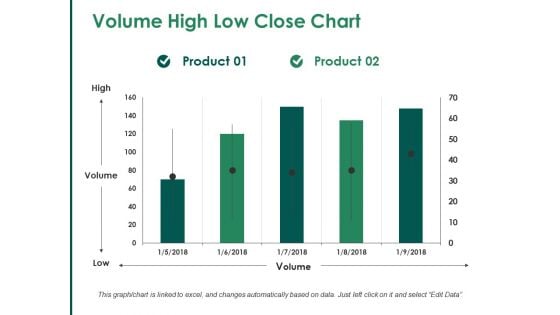
Volume High Low Close Chart Ppt PowerPoint Presentation Visual Aids Slides
This is a volume high low close chart ppt powerpoint presentation visual aids slides. This is a two stage process. The stages in this process are bar graph, marketing, strategy, finance, planning.
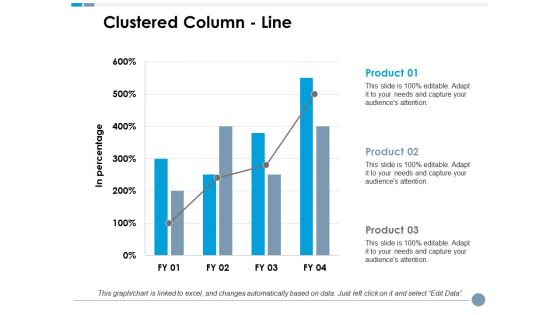
Clustered Column Line Ppt PowerPoint Presentation Model Graphics Tutorials
This is a clustered column line ppt powerpoint presentation model graphics tutorials. This is a three stage process. The stages in this process are business, marketing, in percentage, finance, graph.
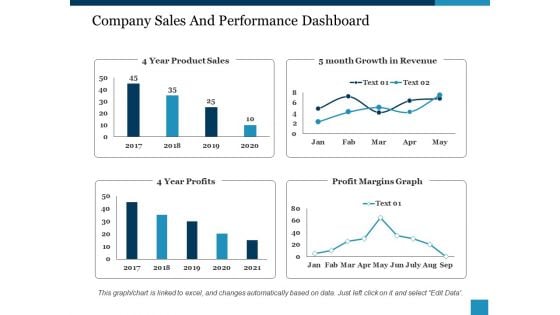
Company Sales And Performance Dashboard Ppt PowerPoint Presentation Show Structure
This is a company sales and performance dashboard ppt powerpoint presentation show structure. This is a four stage process. The stages in this process are year product sales, month growth in revenue, profit margins graph, year profits.
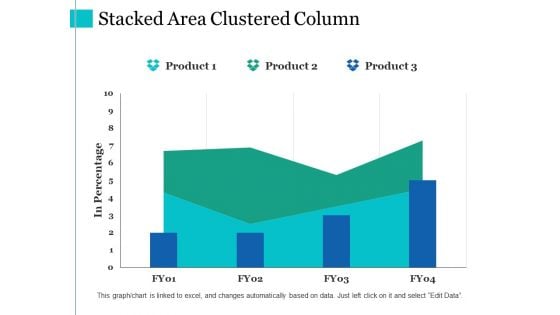
Stacked Area Clustered Column Ppt PowerPoint Presentation Summary Slides
This is a stacked area clustered column ppt powerpoint presentation summary slides. This is a three stage process. The stages in this process are product, in percentage, financial year, bar graph.
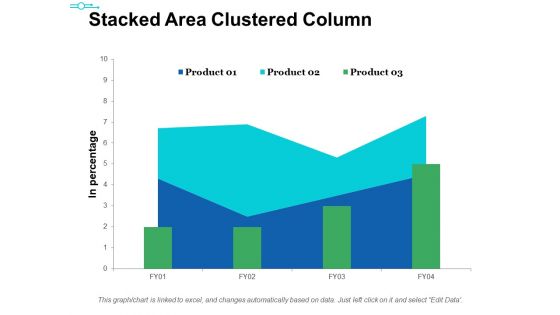
Stacked Area Clustered Column Ppt PowerPoint Presentation Ideas Themes
This is a stacked area clustered column ppt powerpoint presentation ideas themes. This is a three stage process. The stages in this process are product, in percentage, bar graph, area chart, growth.
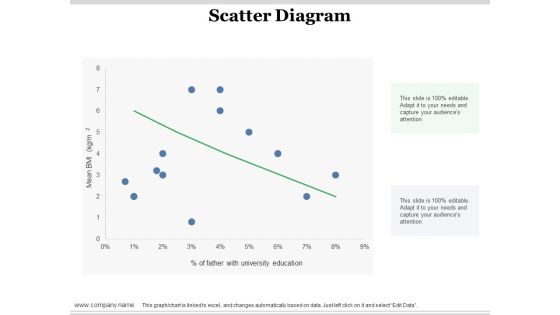
Scatter Diagram Ppt PowerPoint Presentation Infographic Template Design Ideas
This is a scatter diagram ppt powerpoint presentation infographic template design ideas. This is a one stage process. The stages in this process are scatter diagram, finance, in percentage, business, bar graph.
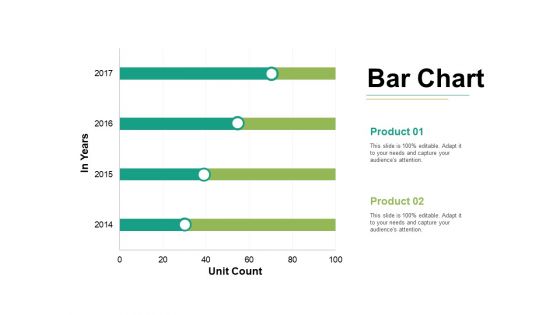
Bar Chart Ppt PowerPoint Presentation Styles Graphics Tutorials Ppt PowerPoint Presentation Slides Gallery
This is a bar chart ppt powerpoint presentation styles graphics tutorials ppt powerpoint presentation slides gallery. This is a two stage process. The stages in this process are bar graph, growth, success, business, marketing.
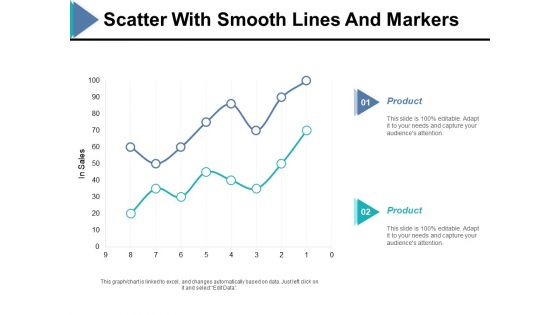
Scatter With Smooth Lines And Markers Ppt PowerPoint Presentation Ideas Example
This is a scatter with smooth lines and markers ppt powerpoint presentation ideas example. This is a two stage process. The stages in this process are in sales, finance, bar graph, product, business.
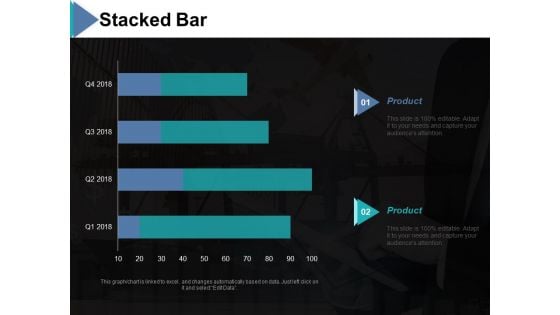
Stacked Bar Ppt PowerPoint Presentation Model Graphics
This is a stacked bar ppt powerpoint presentation model graphics. This is a two stage process. The stages in this process are stacked bar, product, chart and graph, finance, business.
Scatter Bubble Chart Ppt PowerPoint Presentation Model Icon
This is a scatter bubble chart ppt powerpoint presentation model icon. This is a three stage process. The stages in this process are finance, business, management, marketing, chart and graph.
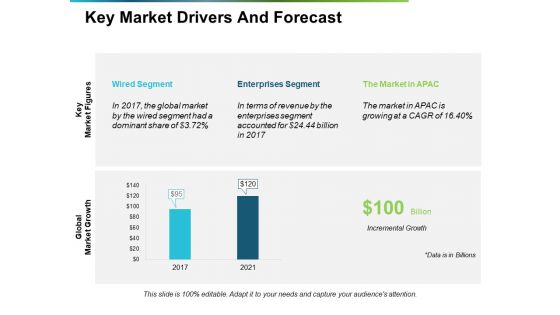
Key Market Drivers And Forecast Ppt PowerPoint Presentation Summary Templates
This is a key market drivers and forecast ppt powerpoint presentation summary templates. This is a two stage process. The stages in this process are key market drivers, forecast, growth, bar graph, business.
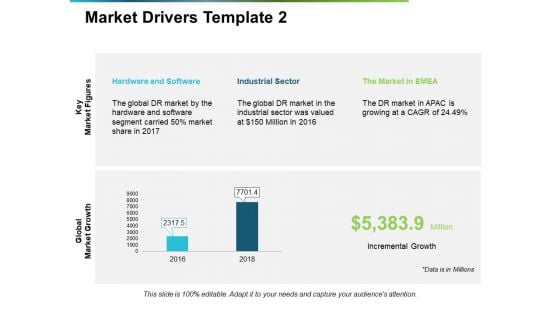
Market Drivers Hardware And Software Ppt PowerPoint Presentation Inspiration Graphics Design
This is a market drivers hardware and software ppt powerpoint presentation inspiration graphics design. This is a two stage process. The stages in this process are key market drivers, forecast, growth, bar graph, business.
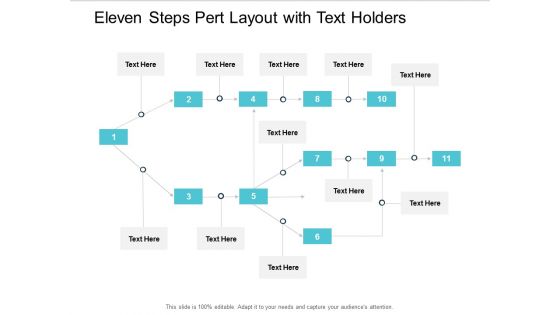
Eleven Steps Pert Layout With Text Holders Ppt Powerpoint Presentation Ideas Background Image
This is a eleven steps pert layout with text holders ppt powerpoint presentation ideas background image. This is a eleven stage process. The stages in this process are pert chart, program evaluation and review technique, pert graph.
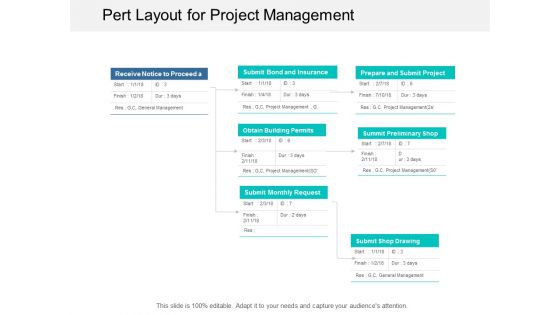
Pert Layout For Project Management Ppt Powerpoint Presentation Professional Smartart
This is a pert layout for project management ppt powerpoint presentation professional smartart. This is a three stage process. The stages in this process are pert chart, program evaluation and review technique, pert graph.
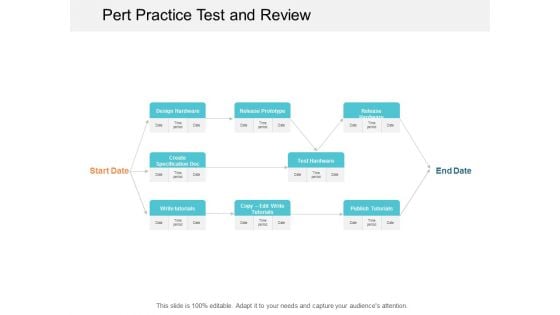
Pert Practice Test And Review Ppt Powerpoint Presentation Layouts Template
This is a pert practice test and review ppt powerpoint presentation layouts template. This is a two stage process. The stages in this process are pert chart, program evaluation and review technique, pert graph.
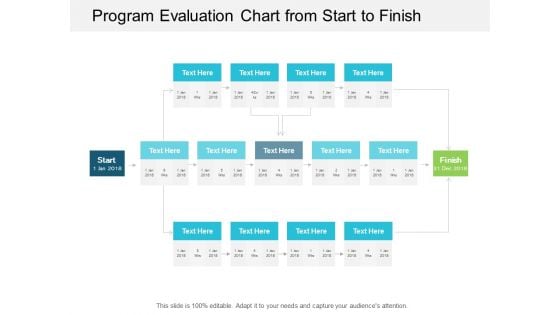
Program Evaluation Chart From Start To Finish Ppt Powerpoint Presentation Professional Examples
This is a program evaluation chart from start to finish ppt powerpoint presentation professional examples. This is a three stage process. The stages in this process are pert chart, program evaluation and review technique, pert graph.
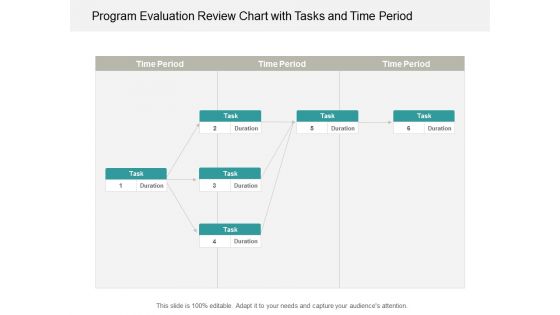
Program Evaluation Review Chart With Tasks And Time Period Ppt Powerpoint Presentation Portfolio Infographic Template
This is a program evaluation review chart with tasks and time period ppt powerpoint presentation portfolio infographic template. This is a six stage process. The stages in this process are pert chart, program evaluation and review technique, pert graph.
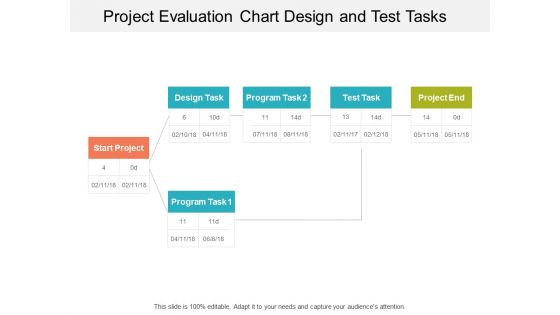
Project Evaluation Chart Design And Test Tasks Ppt Powerpoint Presentation Show Graphics Design
This is a project evaluation chart design and test tasks ppt powerpoint presentation show graphics design. This is a three stage process. The stages in this process are pert chart, program evaluation and review technique, pert graph.
Project Task Planning And Evaluation Chart Ppt Powerpoint Presentation Icon Slide
This is a project task planning and evaluation chart ppt powerpoint presentation icon slide. This is a nine stage process. The stages in this process are pert chart, program evaluation and review technique, pert graph.
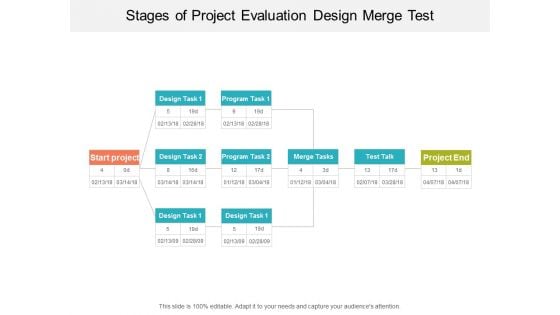
Stages Of Project Evaluation Design Merge Test Ppt Powerpoint Presentation Outline Example Introduction
This is a stages of project evaluation design merge test ppt powerpoint presentation outline example introduction. This is a three stage process. The stages in this process are pert chart, program evaluation and review technique, pert graph.
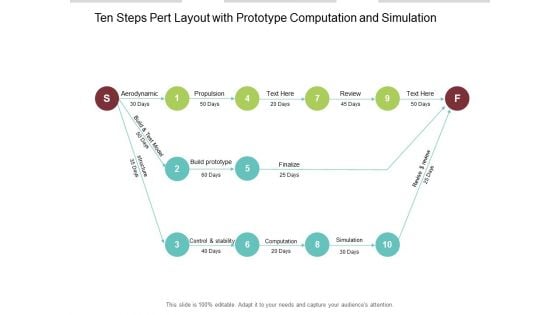
Ten Steps Pert Layout With Prototype Computation And Simulation Ppt Powerpoint Presentation Inspiration Picture
This is a ten steps pert layout with prototype computation and simulation ppt powerpoint presentation inspiration picture. This is a ten stage process. The stages in this process are pert chart, program evaluation and review technique, pert graph.
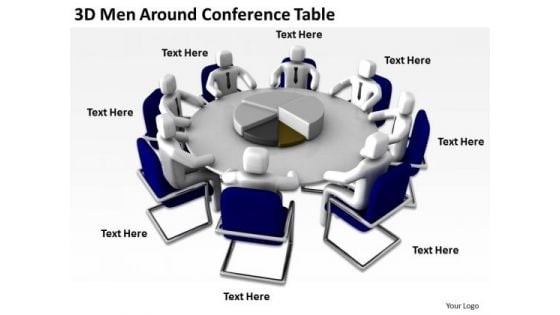
Business People Clip Art Around Conference Table PowerPoint Templates Ppt Backgrounds For Slides
We present our business people clip art around conference table PowerPoint templates PPT backgrounds for slides.Download our People PowerPoint Templates because You can Score a slam dunk with our PowerPoint Templates and Slides. Watch your audience hang onto your every word. Use our Business PowerPoint Templates because Our PowerPoint Templates and Slides team portray an attitude of elegance. Personify this quality by using them regularly. Download and present our Pie charts PowerPoint Templates because You can Stir your ideas in the cauldron of our PowerPoint Templates and Slides. Cast a magic spell on your audience. Present our Marketing PowerPoint Templates because You can Create a matrix with our PowerPoint Templates and Slides. Feel the strength of your ideas click into place. Present our Future PowerPoint Templates because Your audience will believe you are the cats whiskers.Use these PowerPoint slides for presentations relating to 3d, arrow, boss, business, businessmen, chart, communication, company,concept, conference, cooperation, corporate, diagram, director, economy,executive, finance, financial, firm, graph, group, growth, illustration, improvement,increase, job, leader, manager, market, meeting, men, money, office, people,pie,presentation, professional, project, render, report, rise, sales, success,successful, symbol, table, team, teamwork, up, work. The prominent colors used in the PowerPoint template are Blue navy, White, Black. Professionals tell us our business people clip art around conference table PowerPoint templates PPT backgrounds for slides will get their audience's attention. People tell us our concept PowerPoint templates and PPT Slides are topically designed to provide an attractive backdrop to any subject. We assure you our business people clip art around conference table PowerPoint templates PPT backgrounds for slides are the best it can get when it comes to presenting. Presenters tell us our concept PowerPoint templates and PPT Slides are designed by professionals We assure you our business people clip art around conference table PowerPoint templates PPT backgrounds for slides are aesthetically designed to attract attention. We guarantee that they will grab all the eyeballs you need. PowerPoint presentation experts tell us our business PowerPoint templates and PPT Slides will make you look like a winner. Discipline is the bedrock of achievement. Advocate adherence with our Business People Clip Art Around Conference Table PowerPoint Templates Ppt Backgrounds For Slides.
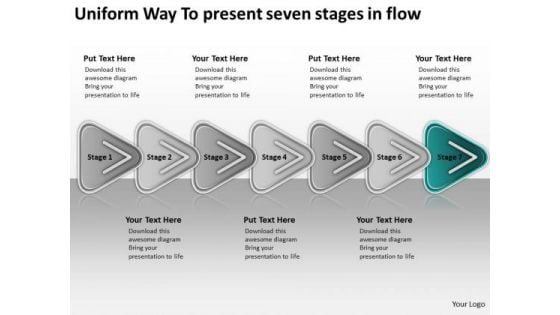
Way To Present Seven Stages In Flow Financial Business Plan Template PowerPoint Slides
We present our way to present seven stages in flow financial business plan template PowerPoint Slides.Present our Arrows PowerPoint Templates because a healthy person is the esence of a sense of happiness. Download and present our Shapes PowerPoint Templates because this Diagram emphasizes on any critical or key factors within them. Use our Process and Flows PowerPoint Templates because health of the determines the quality of our lives. Download and present our Flow charts PowerPoint Templates because they will Amplify your plans to have dedicated sub groups working on related but distinct tasks. Use our Business PowerPoint Templates because you have had a great year or so business wise. It is time to celebrate the efforts of your team.Use these PowerPoint slides for presentations relating to Abstract, algorithm, arrows, arrows chart, block, block diagram, business, chart, color, connection, design, development, diagram, direction, element, flow, flow chart, flow diagram, flowchart, graph, kind of diagram, linear, linear diagram, management, model, module, motion, organization, plan, process, process arrows. The prominent colors used in the PowerPoint template are Green dark , White, Black. The feedback we get is that our way to present seven stages in flow financial business plan template PowerPoint Slides are Bold. The feedback we get is that our arrows PowerPoint templates and PPT Slides are Playful. People tell us our way to present seven stages in flow financial business plan template PowerPoint Slides are Elegant. We assure you our arrows PowerPoint templates and PPT Slides are Upbeat. We assure you our way to present seven stages in flow financial business plan template PowerPoint Slides are aesthetically designed to attract attention. We guarantee that they will grab all the eyeballs you need. The feedback we get is that our chart PowerPoint templates and PPT Slides provide you with a vast range of viable options. Select the appropriate ones and just fill in your text. Encourage creativity with our Way To Present Seven Stages In Flow Financial Business Plan Template PowerPoint Slides. You will come out on top.
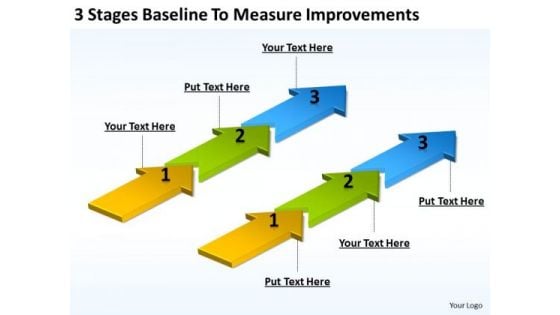
Arrows For Ppt Baseline To Measure Improvements PowerPoint Templates Backgrounds Slides
We present our arrows for ppt baseline to measure improvements PowerPoint templates backgrounds slides.Download our Flow charts PowerPoint Templates because Our PowerPoint Templates and Slides will let you Hit the target. Go the full distance with ease and elan. Use our Marketing PowerPoint Templates because It will mark the footprints of your journey. Illustrate how they will lead you to your desired destination. Present our Shapes PowerPoint Templates because They will Put your wonderful verbal artistry on display. Our PowerPoint Templates and Slides will provide you the necessary glam and glitter. Present our Arrows PowerPoint Templates because Our PowerPoint Templates and Slides will help you be quick off the draw. Just enter your specific text and see your points hit home. Download and present our Process and Flows PowerPoint Templates because Our PowerPoint Templates and Slides will embellish your thoughts. See them provide the desired motivation to your team.Use these PowerPoint slides for presentations relating to Arrow, Banner, Bar, Collection, Completion, Concept, Confirmation, Design, Flow, Graph, Graphic, Illustration, Indication, Information, Instruction, Interface, Internet, Layout, Measurement, Modern, Number, Order, Phase, Pointer, Process, Progress, Reflection, Scale, Shape, Stage, Status, Step, Template, Two, Vector, Web, Web Design, Web Design Elements, Websites, Work Flow. The prominent colors used in the PowerPoint template are Green, Blue, Yellow. Customers tell us our arrows for ppt baseline to measure improvements PowerPoint templates backgrounds slides are the best it can get when it comes to presenting. We assure you our Collection PowerPoint templates and PPT Slides are visually appealing. Use our arrows for ppt baseline to measure improvements PowerPoint templates backgrounds slides look good visually. You can be sure our Flow PowerPoint templates and PPT Slides are second to none. PowerPoint presentation experts tell us our arrows for ppt baseline to measure improvements PowerPoint templates backgrounds slides are readymade to fit into any presentation structure. The feedback we get is that our Design PowerPoint templates and PPT Slides effectively help you save your valuable time. Create an engaging ambience with our Arrows For Ppt Baseline To Measure Improvements PowerPoint Templates Backgrounds Slides. Their content will appeal to all the brains.
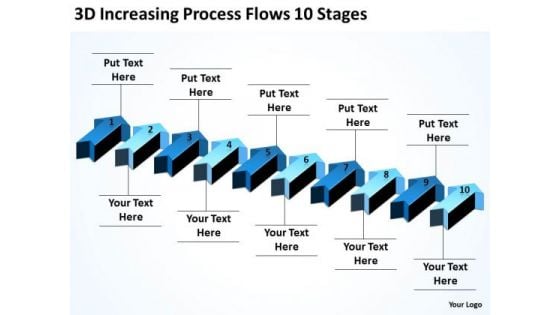
Arrows For Ppt Increasing Process Flows 10 Stages PowerPoint Templates Backgrounds Slides
We present our arrows for ppt increasing process flows 10 stages PowerPoint templates backgrounds slides.Use our Marketing PowerPoint Templates because you can Add colour to your speech with our PowerPoint Templates and Slides. Your presentation will leave your audience speechless. Download and present our Flow charts PowerPoint Templates because It will mark the footprints of your journey. Illustrate how they will lead you to your desired destination. Use our Shapes PowerPoint Templates because you should Whip up a frenzy with our PowerPoint Templates and Slides. They will fuel the excitement of your team. Download and present our Arrows PowerPoint Templates because Our PowerPoint Templates and Slides are focused like a searchlight beam. They highlight your ideas for your target audience. Download and present our Process and Flows PowerPoint Templates because You can Be the star of the show with our PowerPoint Templates and Slides. Rock the stage with your ideas.Use these PowerPoint slides for presentations relating to Arrow, Banner, Bar, Collection, Completion, Concept, Confirmation, Design, Flow, Graph, Graphic, Illustration, Indication, Information, Instruction, Interface, Internet, Layout, Measurement, Modern, Number, Order, Phase, Pointer, Process, Progress, Reflection, Scale, Shape, Stage, Status, Step, Template, Two, Vector, Web, Web Design, Web Design Elements, Websites, Work Flow. The prominent colors used in the PowerPoint template are Blue navy, Blue, Black. Customers tell us our arrows for ppt increasing process flows 10 stages PowerPoint templates backgrounds slides will help them to explain complicated concepts. We assure you our Flow PowerPoint templates and PPT Slides are readymade to fit into any presentation structure. Use our arrows for ppt increasing process flows 10 stages PowerPoint templates backgrounds slides are incredible easy to use. You can be sure our Confirmation PowerPoint templates and PPT Slides will help them to explain complicated concepts. PowerPoint presentation experts tell us our arrows for ppt increasing process flows 10 stages PowerPoint templates backgrounds slides will make the presenter look like a pro even if they are not computer savvy. The feedback we get is that our Confirmation PowerPoint templates and PPT Slides will help them to explain complicated concepts. Cast our Arrows For Ppt Increasing Process Flows 10 Stages PowerPoint Templates Backgrounds Slides in your act. The audience will call for an encore.
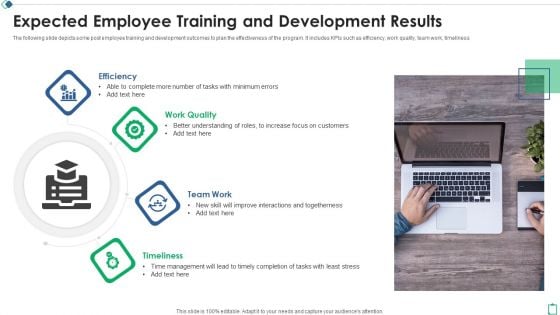
Expected Employee Training And Development Results Ppt Ideas Guidelines PDF
The following slide depicts some post employee training and development outcomes to plan the effectiveness of the program. It includes KPIs such as efficiency, work quality, team work, timeliness. Presenting Expected Employee Training And Development Results Ppt Ideas Guidelines PDF to dispense important information. This template comprises four stages. It also presents valuable insights into the topics including Efficiency Work Quality, Team Work Timeliness, Timely Completion Tasks. This is a completely customizable PowerPoint theme that can be put to use immediately. So, download it and address the topic impactfully.
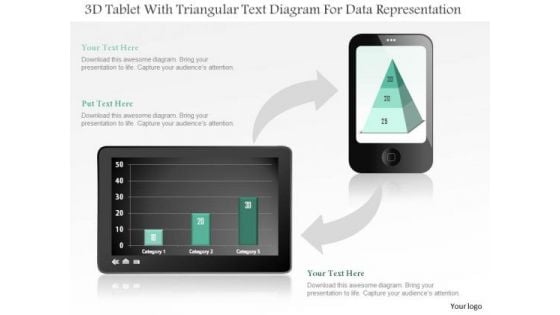
Business Diagram 3d Tablet With Triangular Text Diagram For Data Representation PowerPoint Slide
This business diagram displays bar graph on tablet and pyramid chart on mobile phone. Use this diagram, to make reports for interactive business presentations. Create professional presentations using this diagram.

Business Diagram Data Driven Pie Chart Inside The Magnifier PowerPoint Slide
This business slide displays 3d colorful pie graph with magnifier. This diagram is a data visualization tool that gives you a simple way to present statistical information. This slide helps your audience examine and interpret the data you present.
Business Diagram Human Icons With Bubbles And Different Icons Inside PowerPoint Slide
This diagram displays graph with percentage value growth. This business slide is suitable to present and compare business data. Use this diagram to build professional presentations for your viewers.


 Continue with Email

 Home
Home


