Coordination
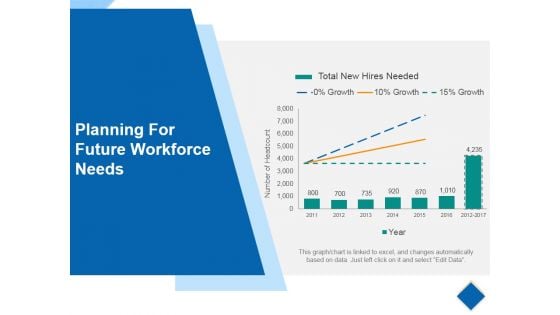
Planning For Future Workforce Needs Ppt PowerPoint Presentation Professional Slide
This is a planning for future workforce needs ppt powerpoint presentation professional slide. This is a seven stage process. The stages in this process are total new hires needed, business, graph, success, growth.
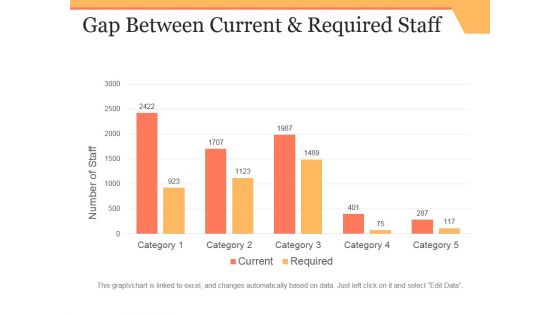
Gap Between Current And Required Staff Ppt PowerPoint Presentation Infographic Template Microsoft
This is a gap between current and required staff ppt powerpoint presentation infographic template microsoft. This is a five stage process. The stages in this process are business, bar graph, finance, marketing, strategy, analysis.
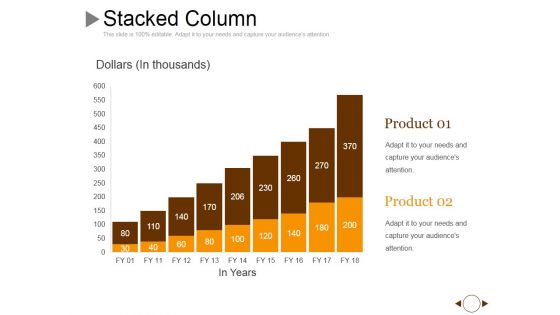
Stacked Column Ppt PowerPoint Presentation Infographic Template Master Slide
This is a stacked column ppt powerpoint presentation infographic template master slide. This is a nine stage process. The stages in this process are product, dollar, growth, success, graph.
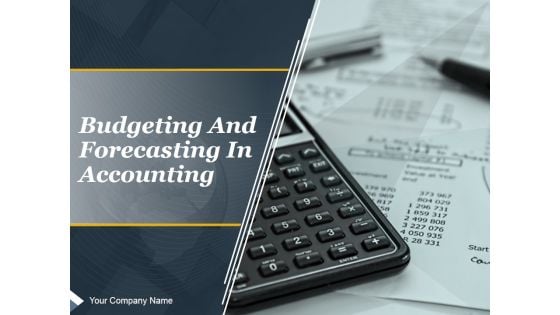
Budgeting And Forecasting In Accounting Ppt PowerPoint Presentation Complete Deck With Slides
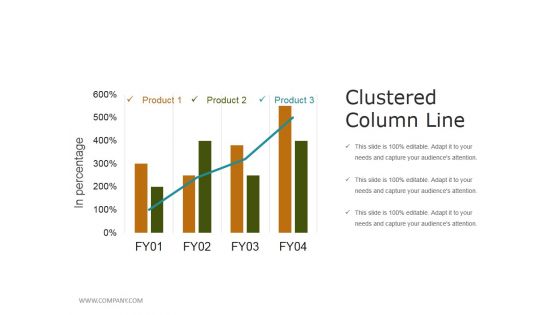
Clustered Column Line Ppt PowerPoint Presentation Summary Slides
This is a clustered column line ppt powerpoint presentation summary slides. This is a four stage process. The stages in this process are bar graph, growth, success, business, marketing.
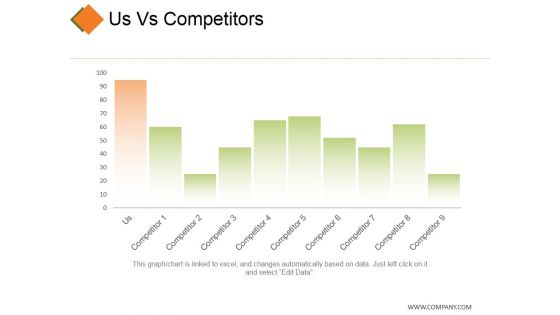
Us Vs Competitors Template 1 Ppt PowerPoint Presentation Outline Example
This is a us vs competitors template 1 ppt powerpoint presentation outline example. This is a ten stage process. The stages in this process are business, decline, graph, marketing.

New Product Management Ppt PowerPoint Presentation Complete Deck With Slides
Data Analytics Ppt PowerPoint Presentation Icon Master Slide
This is a data analytics ppt powerpoint presentation icon master slide. This is a five stage process. The stages in this process are bar graph, growth, success, business, marketing.
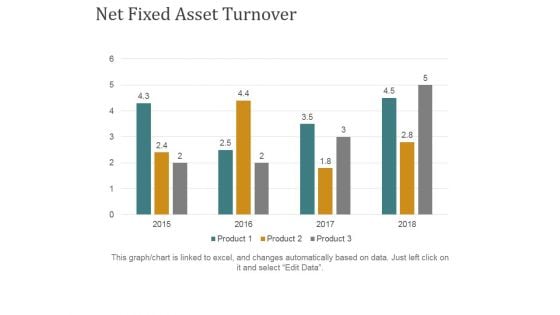
Net Fixed Asset Turnover Ppt PowerPoint Presentation Ideas Grid
This is a net fixed asset turnover ppt powerpoint presentation ideas grid. This is a four stage process. The stages in this process are business, finance, marketing, bar graph, strategy.
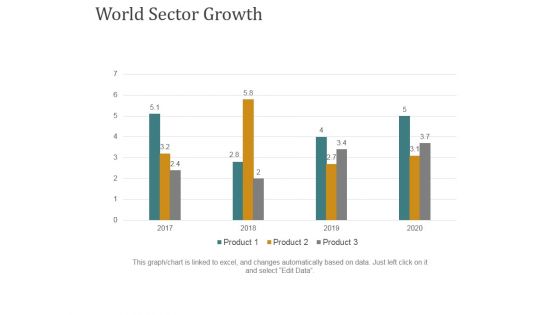
World Sector Growth Ppt PowerPoint Presentation Gallery Template
This is a world sector growth ppt powerpoint presentation gallery template. This is a four stage process. The stages in this process are business, bar graph, finance, marketing, strategy.
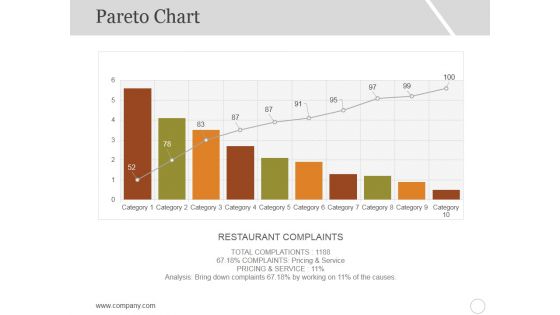
Pareto Chart Template 1 Ppt PowerPoint Presentation Ideas Graphics
This is a pareto chart template 1 ppt powerpoint presentation ideas graphics. This is a ten stage process. The stages in this process are restaurant complaints, category, business, graph.
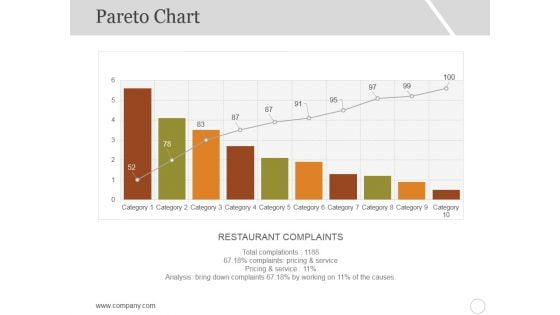
Pareto Chart Template 2 Ppt PowerPoint Presentation Portfolio Gallery
This is a pareto chart template 2 ppt powerpoint presentation portfolio gallery. This is a ten stage process. The stages in this process are restaurant complaints, category, business, graph.
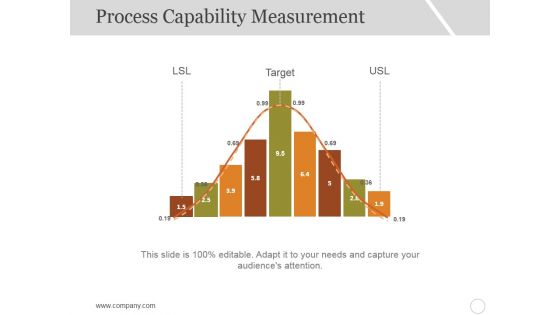
Process Capability Measurement Template 1 Ppt PowerPoint Presentation Portfolio Model
This is a process capability measurement template 1 ppt powerpoint presentation portfolio model. This is a nine stage process. The stages in this process are target, lsl, usl, graph, growth.

Xbar And R Chart Ppt PowerPoint Presentation Inspiration Styles
This is a xbar and r chart ppt powerpoint presentation inspiration styles. This is a two stage process. The stages in this process are subtitle, lcl, ucl, growth, graph.
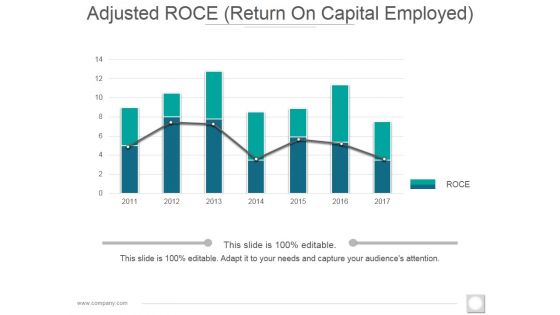
Adjusted Roce Template 1 Ppt PowerPoint Presentation Styles Background Designs
This is a adjusted roce template 1 ppt powerpoint presentation styles background designs. This is a seven stage process. The stages in this process are bar graph, finance, year, business, marketing.
Adjusted Roce Template 2 Ppt PowerPoint Presentation Icon Pictures
This is a adjusted roce template 2 ppt powerpoint presentation icon pictures. This is a five stage process. The stages in this process are bar graph, finance, percentage, business, marketing.
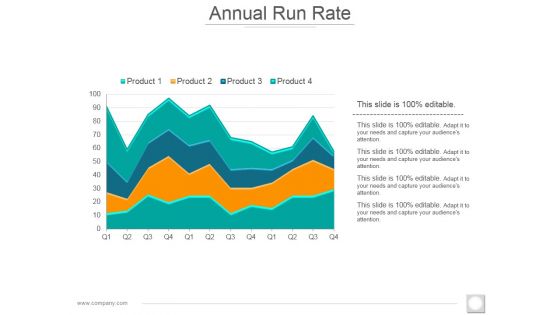
Annual Run Rate Ppt PowerPoint Presentation Gallery Mockup
This is a annual run rate ppt powerpoint presentation gallery mockup. This is a four stage process. The stages in this process are bar graph, growth, success, business, marketing.
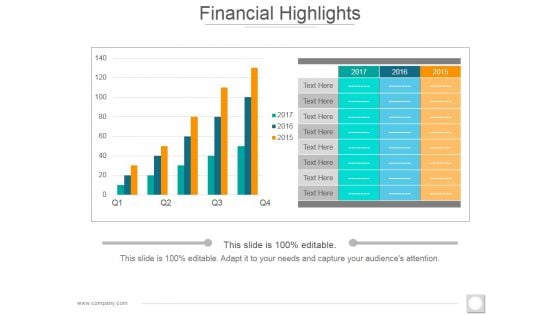
Financial Highlights Template 2 Ppt PowerPoint Presentation Slides Ideas
This is a financial highlights template 2 ppt powerpoint presentation slides ideas. This is a two stage process. The stages in this process are bar graph, growth, success, business, marketing.
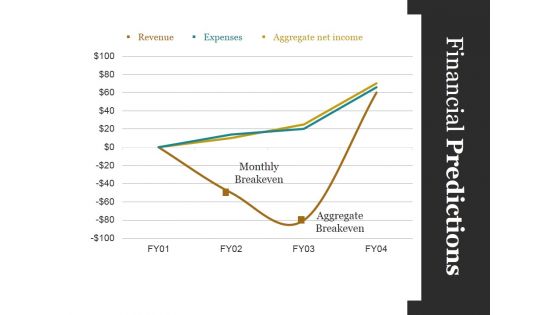
Financial Predictions Template Ppt PowerPoint Presentation Professional Objects
This is a financial predictions template ppt powerpoint presentation professional objects. This is a four stage process. The stages in this process are monthly breakeven, aggregate breakeven, graph, business, marketing.
Monthly Recurring Revenue Churn Template 1 Ppt PowerPoint Presentation Icon Microsoft
This is a monthly recurring revenue churn template 1 ppt powerpoint presentation icon microsoft. This is a four stage process. The stages in this process are bar graph, growth, success, business, marketing.
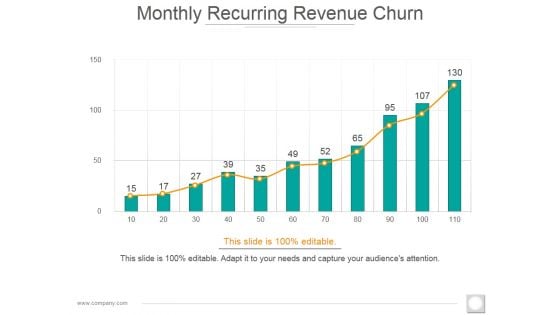
Monthly Recurring Revenue Churn Template 2 Ppt PowerPoint Presentation Diagram Images
This is a monthly recurring revenue churn template 2 ppt powerpoint presentation diagram images. This is a eleven stage process. The stages in this process are bar graph, growth, success, business, marketing.
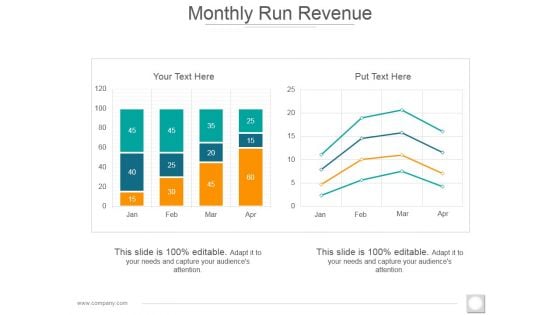
Monthly Run Revenue Ppt PowerPoint Presentation Ideas Graphics Template
This is a monthly run revenue ppt powerpoint presentation ideas graphics template. This is a two stage process. The stages in this process are business, finance, marketing, management, graph.
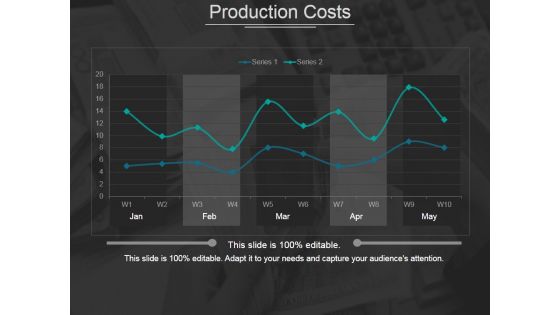
Production Costs Template 2 Ppt PowerPoint Presentation Summary Layout
This is a production costs template 2 ppt powerpoint presentation summary layout. This is a two stage process. The stages in this process are business, finance, marketing, management, graph.
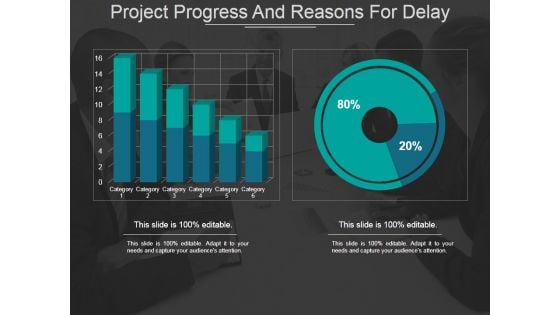
Project Progress And Reasons For Delay Ppt PowerPoint Presentation Pictures Influencers
This is a project progress and reasons for delay ppt powerpoint presentation pictures influencers. This is a two stage process. The stages in this process are graph, percentage, finance, business, marketing.
Service Design Document Template 2 Ppt PowerPoint Presentation Icon Designs Download
This is a service design document template 2 ppt powerpoint presentation icon designs download. This is a twelve stage process. The stages in this process are business, marketing, management, graph.
Area Chart Ppt PowerPoint Presentation Gallery Icons
This is a area chart ppt powerpoint presentation gallery icons. This is a two stage process. The stages in this process are financial year, sales in percentage, product, finance, graph.
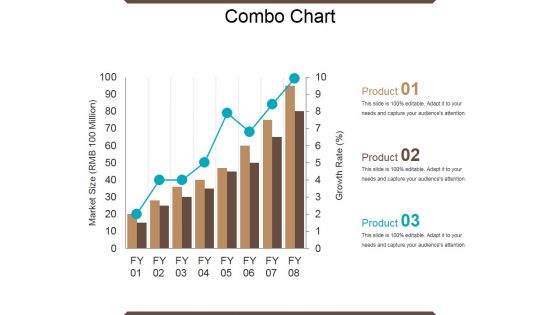
Combo Chart Ppt PowerPoint Presentation Outline Model
This is a combo chart ppt powerpoint presentation outline model. This is a eight stage process. The stages in this process are market size, growth rate, growth, success, graph.
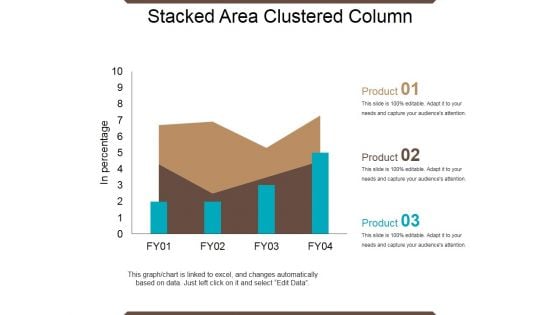
Stacked Area Clustered Column Ppt PowerPoint Presentation Show Guidelines
This is a stacked area clustered column ppt powerpoint presentation show guidelines. This is a four stage process. The stages in this process are in percentage, product, bar graph, growth, success.
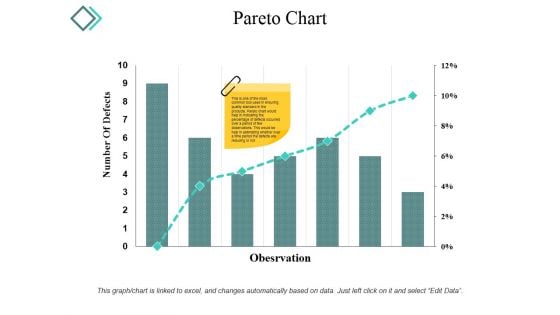
Pareto Chart Ppt PowerPoint Presentation Infographic Template Microsoft
This is a pareto chart ppt powerpoint presentation infographic template microsoft. This is a seven stage process. The stages in this process are number of defects, observation, graph, percentage, business.
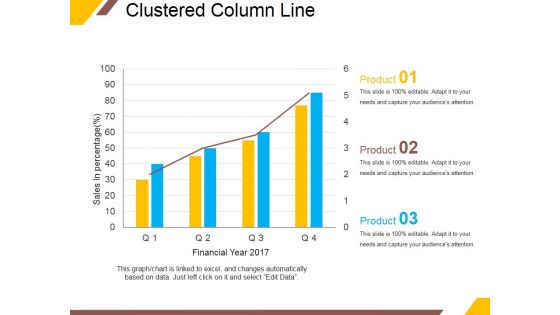
Clustered Column Line Ppt PowerPoint Presentation Portfolio Outline
This is a clustered column line ppt powerpoint presentation portfolio outline. This is a four stage process. The stages in this process are sales in percentage, financial year, product, graph, growth.
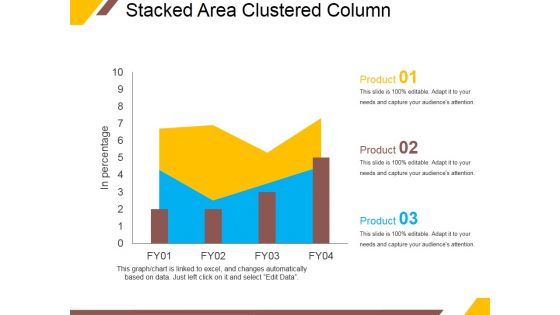
Stacked Area Clustered Column Ppt PowerPoint Presentation Inspiration Shapes
This is a stacked area clustered column ppt powerpoint presentation inspiration shapes. This is a four stage process. The stages in this process are in percentage, product, growth, success, graph.
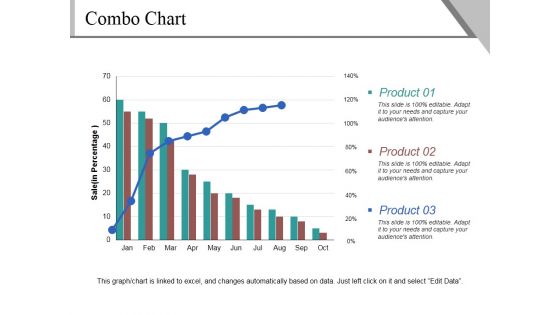
Combo Chart Ppt PowerPoint Presentation Ideas Visual Aids
This is a combo chart ppt powerpoint presentation ideas visual aids. This is a three stage process. The stages in this process are product, sales, bar graph, business, marketing.
Bar Chart Ppt PowerPoint Presentation Icon Demonstration
This is a bar chart ppt powerpoint presentation icon demonstration. This is a seven stage process. The stages in this process are product, sales in percentage, financial year, graph.
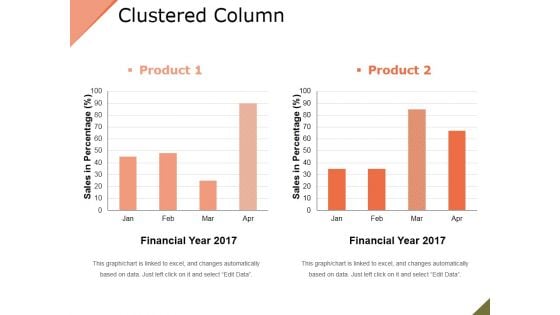
Clustered Column Ppt PowerPoint Presentation File Slide
This is a clustered column ppt powerpoint presentation file slide. This is a two stage process. The stages in this process are product, financial year, sales in percentage, bar graph.

Clustered Column Line Ppt PowerPoint Presentation Slide
This is a clustered column line ppt powerpoint presentation slide. This is a three stage process. The stages in this process are bar graph, growth, finance, product, sales in percentage.
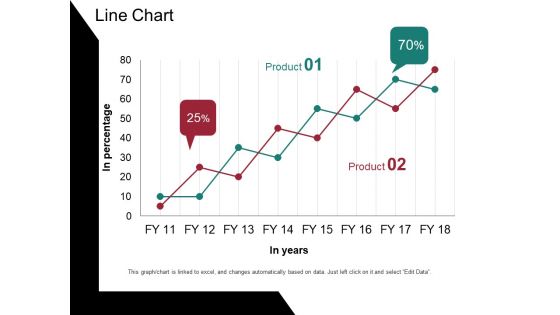
Line Chart Ppt PowerPoint Presentation Portfolio Design Templates
This is a line chart ppt powerpoint presentation portfolio design templates. This is a two stage process. The stages in this process are in percentage, in years, percentage, business, graph.
New Business Marketing Strategy Financing Expense Model Ppt PowerPoint Presentation Complete Deck With Slides
This is a new business marketing strategy financing expense model ppt powerpoint presentation complete deck with slides. This is a one stage process. The stages in this process are business, marketing, strategy, growth, graph.
Combo Chart Ppt PowerPoint Presentation Icon Slide
This is a combo chart ppt powerpoint presentation icon slide. This is a three stage process. The stages in this process are growth rate, market size, graph, business, marketing.
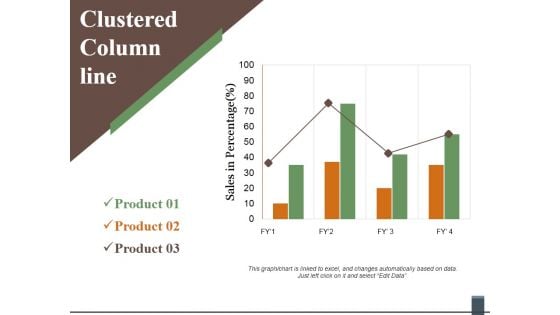
Clustered Column Line Ppt PowerPoint Presentation Inspiration Guidelines
This is a clustered column line ppt powerpoint presentation inspiration guidelines. This is a three stage process. The stages in this process are product, sales in percentage, graph, line, finance, business.
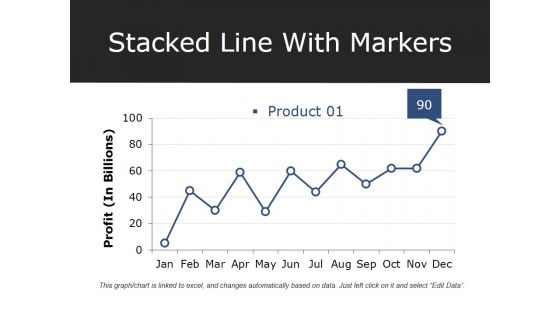
Stacked Line With Markers Ppt PowerPoint Presentation Professional Deck
This is a stacked line with markers ppt powerpoint presentation professional deck. This is a one stage process. The stages in this process are product, profit, growth, success, graph.
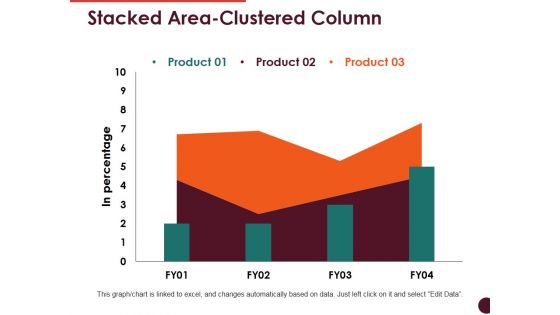
Stacked Area Clustered Column Ppt PowerPoint Presentation Summary Professional
This is a stacked area clustered column ppt powerpoint presentation summary professional. This is a three stage process. The stages in this process are product, bar graph, growth, success, in percentage.
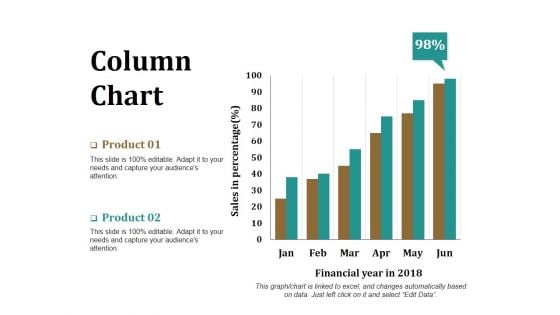
Column Chart Ppt PowerPoint Presentation Model Graphics Download
This is a column chart ppt powerpoint presentation model graphics download. This is a two stage process. The stages in this process are product, financial year, sales in percentage, bar graph, success.
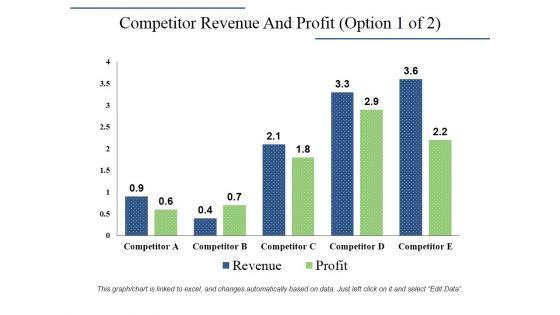
Competitor Revenue And Profit Template 1 Ppt PowerPoint Presentation Infographic Template Designs Download
This is a competitor revenue and profit template 1 ppt powerpoint presentation infographic template designs download. This is a five stage process. The stages in this process are revenue, profit, competitor, bar graph, growth.
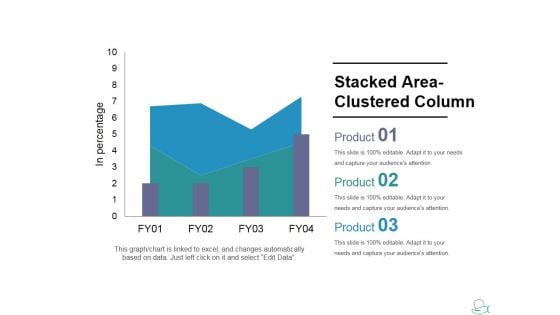
Stacked Area Clustered Column Ppt PowerPoint Presentation Slides Shapes
This is a stacked area clustered column ppt powerpoint presentation slides shapes. This is a three stage process. The stages in this process are product, growth, success graph, business.
Product Launch Budget Plan Ppt PowerPoint Presentation Icon Slide
This is a product launch budget plan ppt powerpoint presentation icon slide. This is a seven stage process. The stages in this process are bar graph, icons, percentage, finance, business.
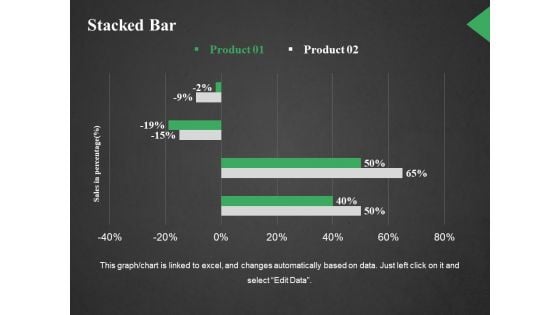
Stacked Bar Ppt PowerPoint Presentation Portfolio Background Image
This is a two stacked bar ppt powerpoint presentation portfolio background image. This is a two stage process. The stages in this process are sales in percentage, graph, business, marketing, strategy.
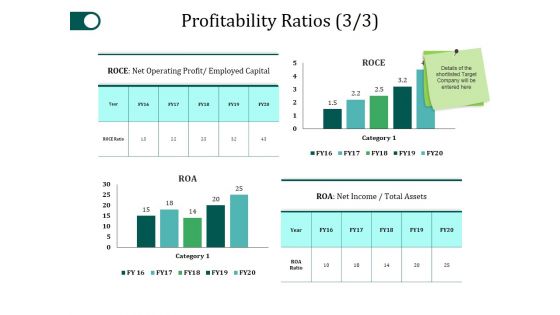
Profitability Ratios Template 3 Ppt PowerPoint Presentation Gallery Slide Portrait
This is a profitability ratios template 3 ppt powerpoint presentation gallery slide portrait. This is a four stage process. The stages in this process are category, roce, net income, business, bar graph.
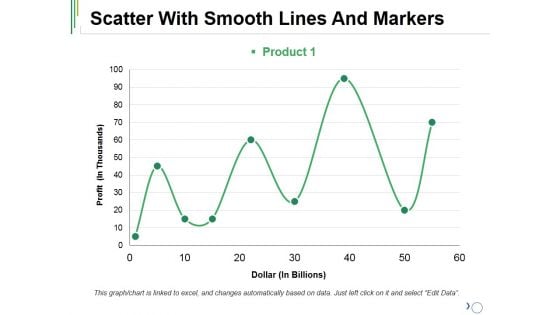
Scatter With Smooth Lines And Markers Ppt PowerPoint Presentation Outline Mockup
This is a scatter with smooth lines and markers ppt powerpoint presentation outline mockup. This is a one stage process. The stages in this process are product, finance, line graph, business, management.
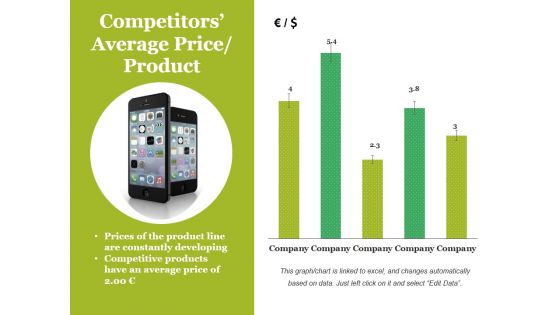
Competitors Average Price Product Ppt PowerPoint Presentation File Pictures
This is a competitors average price product ppt powerpoint presentation file pictures. This is a five stage process. The stages in this process are bar graph, business, marketing, finance, company.
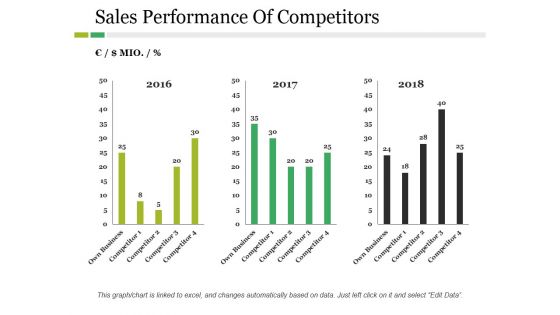
Sales Performance Of Competitors Ppt PowerPoint Presentation Inspiration Example
This is a sales performance of competitors ppt powerpoint presentation inspiration example. This is a three stage process. The stages in this process are business, marketing, year, bar graph, finance.
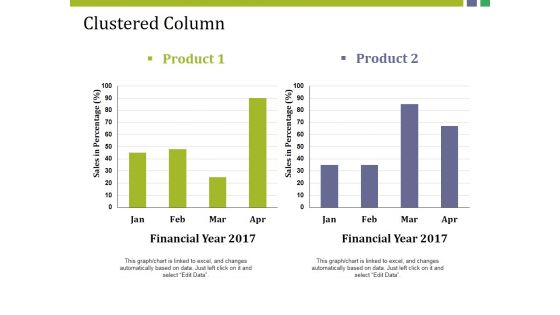
Clustered Column Ppt PowerPoint Presentation Gallery Structure
This is a clustered column ppt powerpoint presentation gallery structure. This is a two stage process. The stages in this process are product, sales in percentage, financial year, bar graph, finance.

Market Potential Ppt PowerPoint Presentation Complete Deck With Slides
This is a market potential ppt powerpoint presentation complete deck with slides. This is a one stage process. The stages in this process are market, potential, business, management, bar graph.
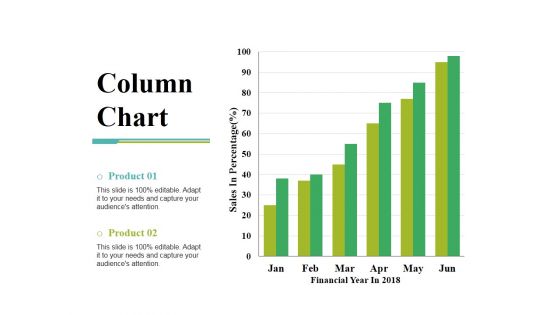
Column Chart Ppt PowerPoint Presentation Gallery Slide Portrait
This is a column chart ppt powerpoint presentation gallery slide portrait. This is a two stage process. The stages in this process are sales in percentage, financial year, product, bar graph, growth.
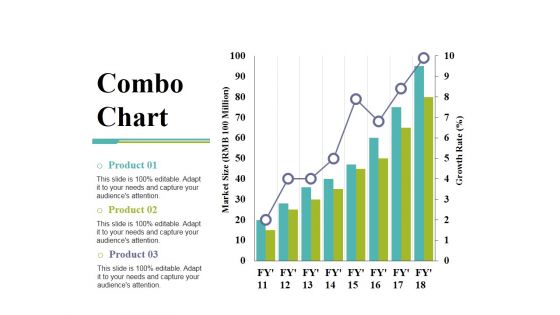
Combo Chart Ppt PowerPoint Presentation Show Deck
This is a combo chart ppt powerpoint presentation show deck. This is a three stage process. The stages in this process are growth rate, market size, product, bar graph, growth.
Competitors Average Price Product Ppt PowerPoint Presentation Icon Layout
This is a competitors average price product ppt powerpoint presentation icon layout. This is a five stage process. The stages in this process are company, bar graph, finance, business, marketing.
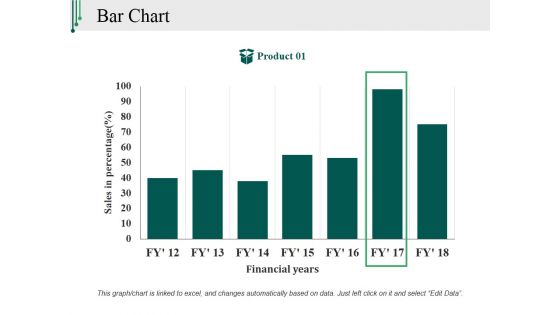
Bar Chart Ppt PowerPoint Presentation Outline Backgrounds
This is a bar chart ppt powerpoint presentation outline backgrounds. This is a one stage process. The stages in this process are sales in percentage, financial years, product, bar graph, finance.
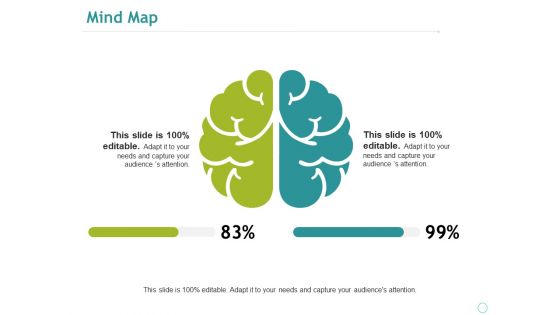
Mind Map Ppt PowerPoint Presentation Portfolio Show
This is a mind map ppt powerpoint presentation portfolio show. This is a two stage process. The stages in this process are business, percentage, graph, mind map, management, brain.
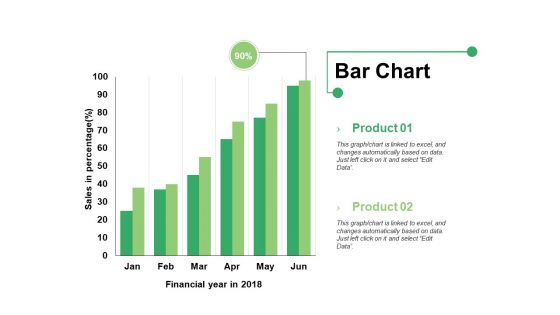
Bar Chart Ppt PowerPoint Presentation Infographics Format Ideas
This is a bar chart ppt powerpoint presentation infographics format ideas. This is a two stage process. The stages in this process are bar graph, product, financial year, sales in percentage.
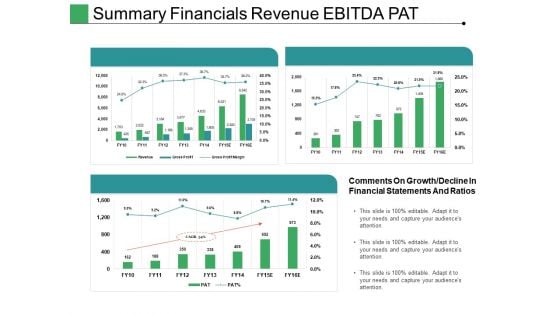
Summary Financials Revenue Ebitda Pat Ppt PowerPoint Presentation Ideas Tips
This is a summary financials revenue ebitda pat ppt powerpoint presentation ideas tips. This is a three stage process. The stages in this process are comments on growth, bar graph, growth, success, business.
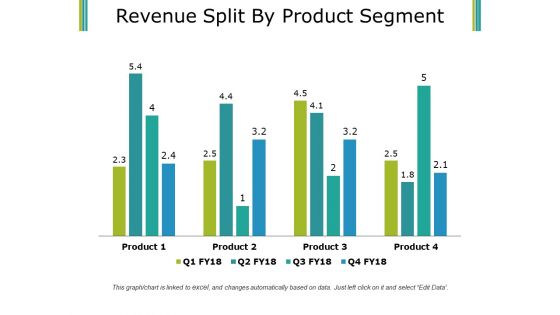
Revenue Split By Product Segment Template 1 Ppt PowerPoint Presentation Infographics Smartart
This is a revenue split by product segment template 1 ppt powerpoint presentation infographics smartart. This is a four stage process. The stages in this process are business, finance, marketing, bar graph, product.


 Continue with Email

 Home
Home


