Corporate Finance
Step 1 Perform Market Research To Evaluate Potential Formulating Global Marketing Strategy To Improve Icons PDF
This slide represents first step in international marketing plan i.e. performing marketing assessment and evaluation to find its potential and effectiveness. It includes market growth, competitive analysis, potential risk etc. Are you in need of a template that can accommodate all of your creative concepts This one is crafted professionally and can be altered to fit any style. Use it with Google Slides or PowerPoint. Include striking photographs, symbols, depictions, and other visuals. Fill, move around, or remove text boxes as desired. Test out color palettes and font mixtures. Edit and save your work, or work with colleagues. Download Step 1 Perform Market Research To Evaluate Potential Formulating Global Marketing Strategy To Improve Icons PDF and observe how to make your presentation outstanding. Give an impeccable presentation to your group and make your presentation unforgettable.
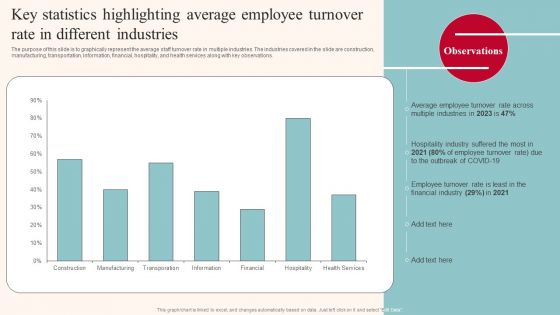
Key Statistics Highlighting Average Employee Turnover Rate In Different Industries Infographics PDF
The purpose of this slide is to graphically represent the average staff turnover rate in multiple industries. The industries covered in the slide are construction, manufacturing, transportation, information, financial, hospitality, and health services along with key observations. Want to ace your presentation in front of a live audience Our Key Statistics Highlighting Average Employee Turnover Rate In Different Industries Infographics PDF can help you do that by engaging all the users towards you. Slidegeeks experts have put their efforts and expertise into creating these impeccable powerpoint presentations so that you can communicate your ideas clearly. Moreover, all the templates are customizable, and easy to edit and downloadable. Use these for both personal and commercial use.
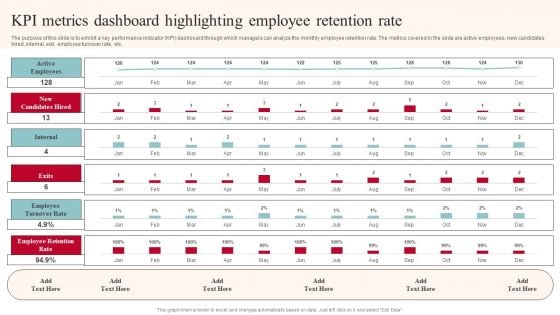
KPI Metrics Dashboard Highlighting Employee Retention Rate Structure PDF
The purpose of this slide is to exhibit a key performance indicator KPI dashboard through which managers can analyze the monthly employee retention rate. The metrics covered in the slide are active employees, new candidates hired, internal, exit, employee turnover rate, etc. Do you have to make sure that everyone on your team knows about any specific topic I yes, then you should give KPI Metrics Dashboard Highlighting Employee Retention Rate Structure PDF a try. Our experts have put a lot of knowledge and effort into creating this impeccable KPI Metrics Dashboard Highlighting Employee Retention Rate Structure PDF. You can use this template for your upcoming presentations, as the slides are perfect to represent even the tiniest detail. You can download these templates from the Slidegeeks website and these are easy to edit. So grab these today.
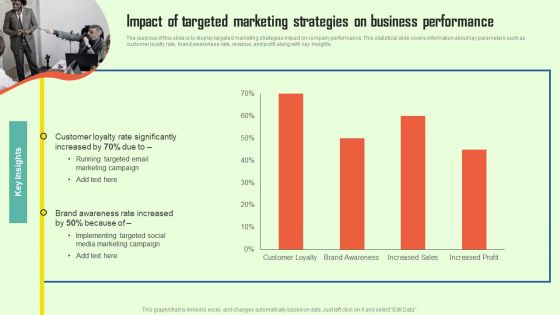
Increasing Consumer Engagement With Database Impact Of Targeted Marketing Strategies Background PDF
The purpose of this slide is to display targeted marketing strategies impact on company performance. This statistical slide covers information about key parameters such as customer loyalty rate, brand awareness rate, revenue, and profit along with key insights. Formulating a presentation can take up a lot of effort and time, so the content and message should always be the primary focus. The visuals of the PowerPoint can enhance the presenters message, so our Increasing Consumer Engagement With Database Impact Of Targeted Marketing Strategies Background PDF was created to help save time. Instead of worrying about the design, the presenter can concentrate on the message while our designers work on creating the ideal templates for whatever situation is needed. Slidegeeks has experts for everything from amazing designs to valuable content, we have put everything into Increasing Consumer Engagement With Database Impact Of Targeted Marketing Strategies Background PDF
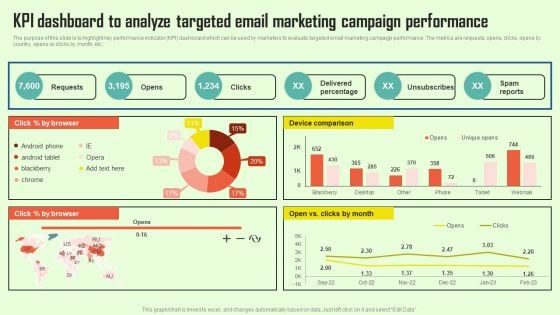
Increasing Consumer Engagement With Database KPI Dashboard To Analyze Targeted Email Infographics PDF
The purpose of this slide is to highlight key performance indicator KPI dashboard which can be used by marketers to evaluate targeted email marketing campaign performance. The metrics are requests, opens, clicks, opens by country, opens vs clicks by month, etc. This modern and well arranged Increasing Consumer Engagement With Database KPI Dashboard To Analyze Targeted Email Infographics PDF provides lots of creative possibilities. It is very simple to customize and edit with the Powerpoint Software. Just drag and drop your pictures into the shapes. All facets of this template can be edited with Powerpoint no extra software is necessary. Add your own material, put your images in the places assigned for them, adjust the colors, and then you can show your slides to the world, with an animated slide included.
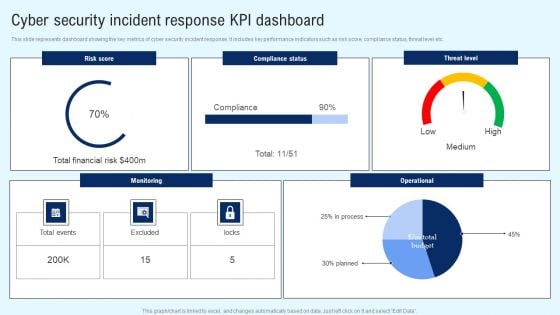
Implementing Cyber Security Incident Cyber Security Incident Response KPI Dashboard Clipart PDF
This slide represents dashboard showing the key metrics of cyber security incident response. It includes key performance indicators such as risk score, compliance status, threat level etc. There are so many reasons you need a Implementing Cyber Security Incident Cyber Security Incident Response KPI Dashboard Clipart PDF. The first reason is you cannot spend time making everything from scratch, Thus, Slidegeeks has made presentation templates for you too. You can easily download these templates from our website easily.
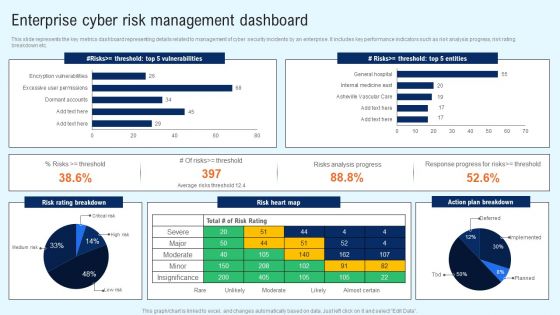
Implementing Cyber Security Incident Enterprise Cyber Risk Dashboard Professional PDF
This slide represents the key metrics dashboard representing details related to management of cyber security incidents by an enterprise. It includes key performance indicators such as risk analysis progress, risk rating breakdown etc. Do you have an important presentation coming up Are you looking for something that will make your presentation stand out from the rest Look no further than Implementing Cyber Security Incident Enterprise Cyber Risk Dashboard Professional PDF. With our professional designs, you can trust that your presentation will pop and make delivering it a smooth process. And with Slidegeeks, you can trust that your presentation will be unique and memorable. So why wait Grab Implementing Cyber Security Incident Enterprise Cyber Risk Dashboard Professional PDF today and make your presentation stand out from the rest.
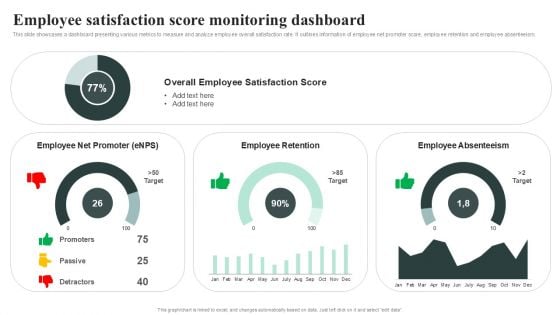
Employee Satisfaction Score Monitoring Dashboard Topics PDF
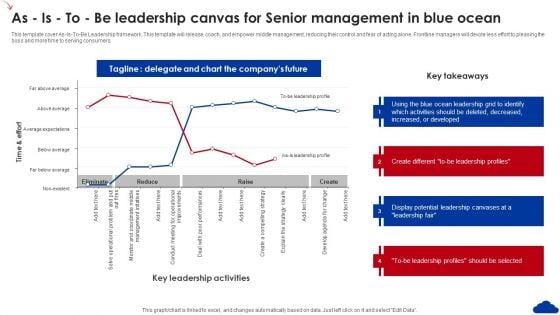
5 Step Guide For Transitioning To Blue Ocean Strategy As Is To Be Leadership Canvas Senior Management Brochure PDF
This template cover As-Is-To-Be Leadership framework. This template will release, coach, and empower middle management, reducing their control and fear of acting alone. Frontline managers will devote less effort to pleasing the boss and more time to serving consumers. If your project calls for a presentation, then Slidegeeks is your go-to partner because we have professionally designed, easy-to-edit templates that are perfect for any presentation. After downloading, you can easily edit 5 Step Guide For Transitioning To Blue Ocean Strategy As Is To Be Leadership Canvas Senior Management Brochure PDF and make the changes accordingly. You can rearrange slides or fill them with different images. Check out all the handy templates
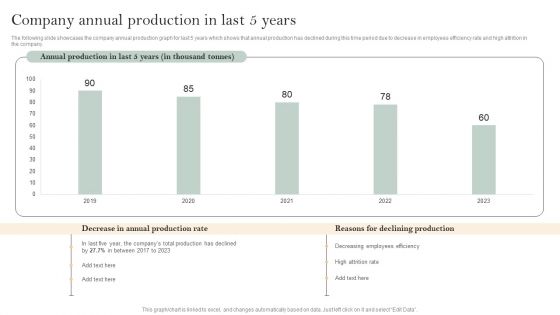
Skill Enhancement Plan Company Annual Production In Last 5 Years Template PDF
The following slide showcases the company annual production graph for last 5 years which shows that annual production has declined during this time period due to decrease in employees efficiency rate and high attrition in the company. Get a simple yet stunning designed Skill Enhancement Plan Company Annual Production In Last 5 Years Template PDF. It is the best one to establish the tone in your meetings. It is an excellent way to make your presentations highly effective. So, download this PPT today from Slidegeeks and see the positive impacts. Our easy-to-edit Skill Enhancement Plan Company Annual Production In Last 5 Years Template PDF can be your go-to option for all upcoming conferences and meetings. So, what are you waiting for Grab this template today.
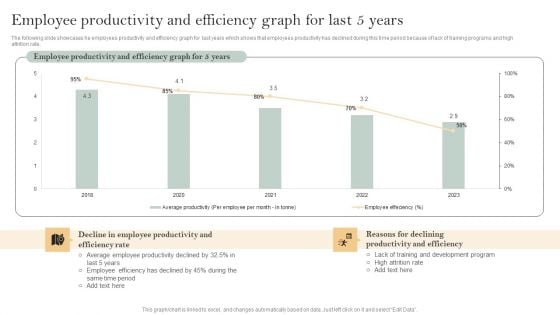
Skill Enhancement Plan Employee Productivity And Efficiency Graph For Last 5 Years Microsoft PDF
The following slide showcases he employees productivity and efficiency graph for last years which shows that employees productivity has declined during this time period because of lack of training programs and high attrition rate. Find highly impressive Skill Enhancement Plan Employee Productivity And Efficiency Graph For Last 5 Years Microsoft PDF on Slidegeeks to deliver a meaningful presentation. You can save an ample amount of time using these presentation templates. No need to worry to prepare everything from scratch because Slidegeeks experts have already done a huge research and work for you. You need to download Skill Enhancement Plan Employee Productivity And Efficiency Graph For Last 5 Years Microsoft PDF for your upcoming presentation. All the presentation templates are 100 percent editable and you can change the color and personalize the content accordingly. Download now
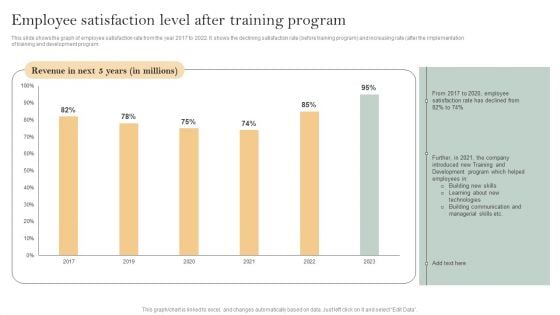
Skill Enhancement Plan Employee Satisfaction Level After Training Program Guidelines PDF
This slide shows the graph of employee satisfaction rate from the year 2017 to 2022. It shows the declining satisfaction rate before training program and increasing rate after the implementation of training and development program. If your project calls for a presentation, then Slidegeeks is your go-to partner because we have professionally designed, easy-to-edit templates that are perfect for any presentation. After downloading, you can easily edit Skill Enhancement Plan Employee Satisfaction Level After Training Program Guidelines PDF and make the changes accordingly. You can rearrange slides or fill them with different images. Check out all the handy templates
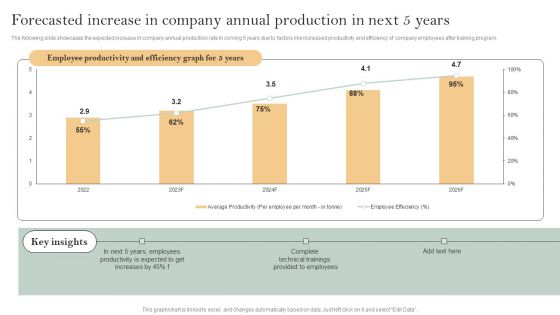
Skill Enhancement Plan Forecasted Increase In Company Annual Production In Next 5 Years Graphics PDF
The following slide showcases the expected increase in company annual production rate in coming 5 years due to factors like increased productivity and efficiency of company employees after training program. Are you in need of a template that can accommodate all of your creative concepts This one is crafted professionally and can be altered to fit any style. Use it with Google Slides or PowerPoint. Include striking photographs, symbols, depictions, and other visuals. Fill, move around, or remove text boxes as desired. Test out color palettes and font mixtures. Edit and save your work, or work with colleagues. Download Skill Enhancement Plan Forecasted Increase In Company Annual Production In Next 5 Years Graphics PDF and observe how to make your presentation outstanding. Give an impeccable presentation to your group and make your presentation unforgettable.
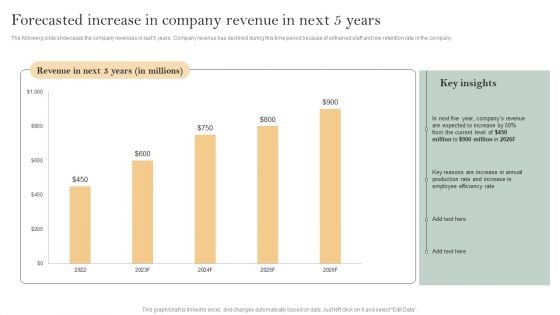
Skill Enhancement Plan Forecasted Increase In Company Revenue In Next 5 Years Inspiration PDF
The following slide showcases the company revenues in last 5 years. Company revenus has declined during this time period because of untrained staff and low retention rate in the company. Crafting an eye-catching presentation has never been more straightforward. Let your presentation shine with this tasteful yet straightforward Skill Enhancement Plan Forecasted Increase In Company Revenue In Next 5 Years Inspiration PDF template. It offers a minimalistic and classy look that is great for making a statement. The colors have been employed intelligently to add a bit of playfulness while still remaining professional. Construct the ideal Skill Enhancement Plan Forecasted Increase In Company Revenue In Next 5 Years Inspiration PDF that effortlessly grabs the attention of your audience Begin now and be certain to wow your customers
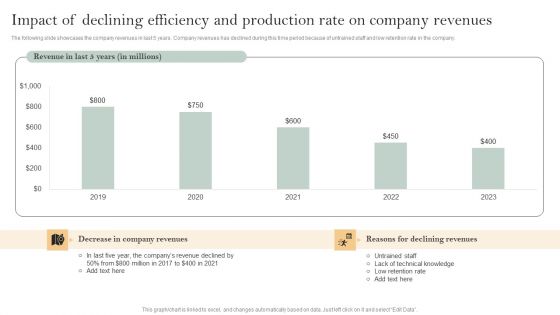
Skill Enhancement Plan Impact Of Declining Efficiency And Production Rate On Company Revenues Pictures PDF
The following slide showcases the company revenues in last 5 years. Company revenues has declined during this time period because of untrained staff and low retention rate in the company. Coming up with a presentation necessitates that the majority of the effort goes into the content and the message you intend to convey. The visuals of a PowerPoint presentation can only be effective if it supplements and supports the story that is being told. Keeping this in mind our experts created Skill Enhancement Plan Impact Of Declining Efficiency And Production Rate On Company Revenues Pictures PDF to reduce the time that goes into designing the presentation. This way, you can concentrate on the message while our designers take care of providing you with the right template for the situation.
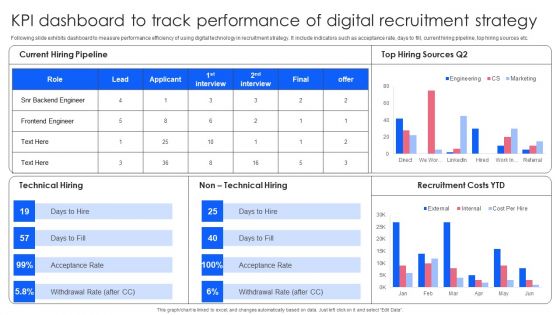
Effective Guide To Build Strong Online Hiring Strategy KPI Dashboard To Track Performance Of Digital Slides PDF
Following slide exhibits dashboard to measure performance efficiency of using digital technology in recruitment strategy. It include indicators such as acceptance rate, days to fill, current hiring pipeline, top hiring sources etc. There are so many reasons you need a Effective Guide To Build Strong Online Hiring Strategy KPI Dashboard To Track Performance Of Digital Slides PDF. The first reason is you cannot spend time making everything from scratch, Thus, Slidegeeks has made presentation templates for you too. You can easily download these templates from our website easily.
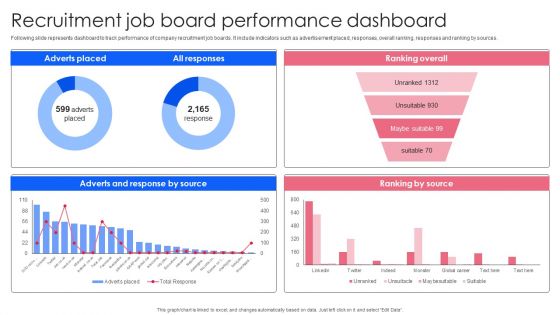
Effective Guide To Build Strong Online Hiring Strategy Recruitment Job Board Performance Dashboard Template PDF
Following slide represents dashboard to track performance of company recruitment job boards. It include indicators such as advertisement placed, responses, overall ranking, responses and ranking by sources. Present like a pro with Effective Guide To Build Strong Online Hiring Strategy Recruitment Job Board Performance Dashboard Template PDF Create beautiful presentations together with your team, using our easy to use presentation slides. Share your ideas in real time and make changes on the fly by downloading our templates. So whether you are in the office, on the go, or in a remote location, you can stay in sync with your team and present your ideas with confidence. With Slidegeeks presentation got a whole lot easier. Grab these presentations today.
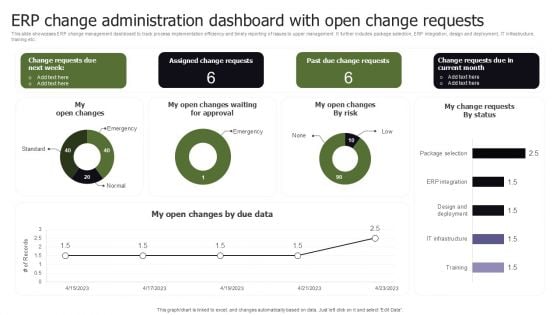
ERP Change Administration Dashboard With Open Change Requests Wd Topics PDF
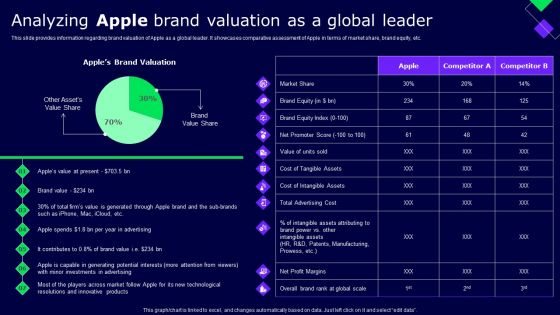
Analyzing Apple Brand Valuation As A Global Leader Ppt Show Shapes PDF
This slide provides information regarding brand valuation of Apple as a global leader. It showcases comparative assessment of Apple in terms of market share, brand equity, etc. Presenting this PowerPoint presentation, titled Analyzing Apple Brand Valuation As A Global Leader Ppt Show Shapes PDF, with topics curated by our researchers after extensive research. This editable presentation is available for immediate download and provides attractive features when used. Download now and captivate your audience. Presenting this Analyzing Apple Brand Valuation As A Global Leader Ppt Show Shapes PDF. Our researchers have carefully researched and created these slides with all aspects taken into consideration. This is a completely customizable Analyzing Apple Brand Valuation As A Global Leader Ppt Show Shapes PDF that is available for immediate downloading. Download now and make an impact on your audience. Highlight the attractive features available with our PPTs.
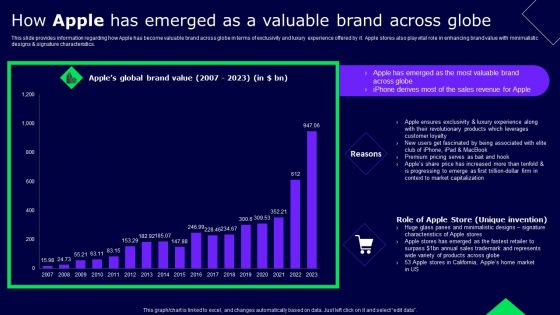
How Apple Has Emerged As A Valuable Brand Across Globe Ppt Infographics Clipart PDF
This slide provides information regarding how Apple has become valuable brand across globe in terms of exclusivity and luxury experience offered by it. Apple stores also play vital role in enhancing brand value with minimalistic designs and signature characteristics. Find a pre designed and impeccable How Apple Has Emerged As A Valuable Brand Across Globe Ppt Infographics Clipart PDF. The templates can ace your presentation without additional effort. You can download these easy to edit presentation templates to make your presentation stand out from others. So, what are you waiting for Download the template from Slidegeeks today and give a unique touch to your presentation.
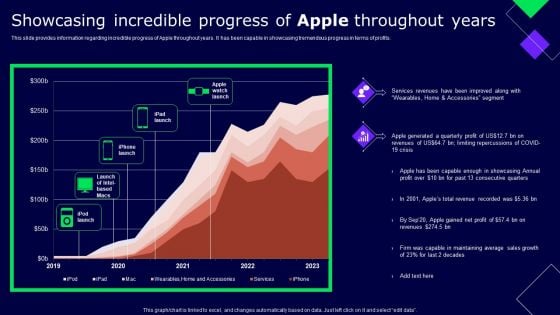
Showcasing Incredible Progress Of Apple Throughout Years Ppt Pictures Tips PDF
This slide provides information regarding incredible progress of Apple throughout years. It has been capable in showcasing tremendous progress in terms of profits. Want to ace your presentation in front of a live audience Our Showcasing Incredible Progress Of Apple Throughout Years Ppt Pictures Tips PDF can help you do that by engaging all the users towards you. Slidegeeks experts have put their efforts and expertise into creating these impeccable powerpoint presentations so that you can communicate your ideas clearly. Moreover, all the templates are customizable, and easy to edit and downloadable. Use these for both personal and commercial use.

Smart Wireless Sensor Networks Dashboard For Spectrum Consumption In Cognitive Radio Professional PDF
This slide depicts the dashboard for spectrum consumption in cognitive radio by covering an overview of the types of data that spectrum contains, spectrum results, user reputation, and locations. Get a simple yet stunning designed Smart Wireless Sensor Networks Dashboard For Spectrum Consumption In Cognitive Radio Professional PDF. It is the best one to establish the tone in your meetings. It is an excellent way to make your presentations highly effective. So, download this PPT today from Slidegeeks and see the positive impacts. Our easy-to-edit Smart Wireless Sensor Networks Dashboard For Spectrum Consumption In Cognitive Radio Professional PDF can be your go-to option for all upcoming conferences and meetings. So, what are you waiting for Grab this template today.
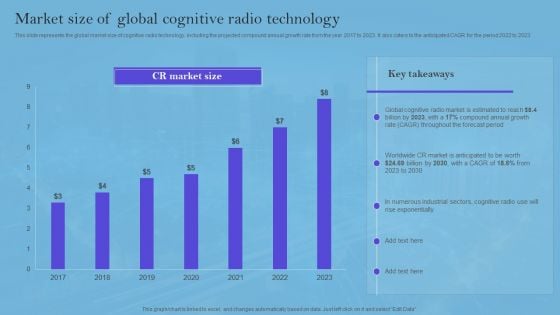
Smart Wireless Sensor Networks Market Size Of Global Cognitive Radio Technology Designs PDF
This slide represents the global market size of cognitive radio technology, including the projected compound annual growth rate from the year 2017 to 2023. It also caters to the anticipated CAGR for the period 2022 to 2023. Coming up with a presentation necessitates that the majority of the effort goes into the content and the message you intend to convey. The visuals of a PowerPoint presentation can only be effective if it supplements and supports the story that is being told. Keeping this in mind our experts created Smart Wireless Sensor Networks Market Size Of Global Cognitive Radio Technology Designs PDF to reduce the time that goes into designing the presentation. This way, you can concentrate on the message while our designers take care of providing you with the right template for the situation.
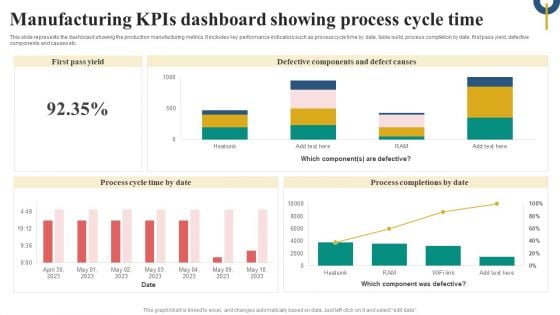
Manufacturing Kpis Dashboard Showing Process Cycle Time Microsoft PDF
This slide represents the dashboard showing the production manufacturing metrics. It includes key performance indicators such as process cycle time by date, table build, process completion by date, first pass yield, defective components and causes etc. Pitch your topic with ease and precision using this Manufacturing Kpis Dashboard Showing Process Cycle Time Microsoft PDF. This layout presents information on Defective Components Defect Causes, Process Cycle, Time By Date, Process Completions By Date. It is also available for immediate download and adjustment. So, changes can be made in the color, design, graphics or any other component to create a unique layout.
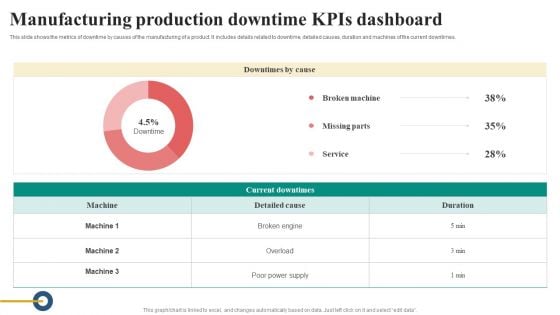
Manufacturing Production Downtime Kpis Dashboard Diagrams PDF
This slide shows the metrics of downtime by causes of the manufacturing of a product. It includes details related to downtime, detailed causes, duration and machines of the current downtimes. Pitch your topic with ease and precision using this Manufacturing Production Downtime Kpis Dashboard Diagrams PDF. This layout presents information on Details Related To Downtime, Detailed Causes, Duration And Machines, Current Downtimes. It is also available for immediate download and adjustment. So, changes can be made in the color, design, graphics or any other component to create a unique layout.
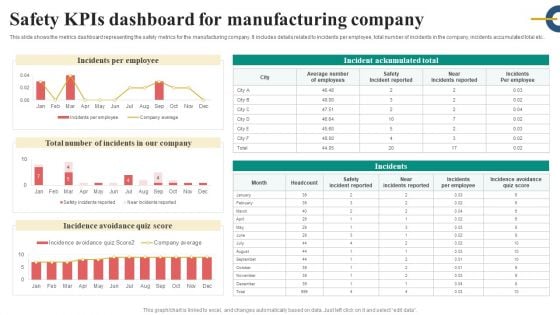
Safety Kpis Dashboard For Manufacturing Company Slides PDF
This slide shows the metrics dashboard representing the safety metrics for the manufacturing company. It includes details related to incidents per employee, total number of incidents in the company, incidents accumulated total etc.. Pitch your topic with ease and precision using this Safety Kpis Dashboard For Manufacturing Company Slides PDF. This layout presents information on Incidents Per Employee, Safety Incident Reported, Incidence Avoidance Quiz Score. It is also available for immediate download and adjustment. So, changes can be made in the color, design, graphics or any other component to create a unique layout.
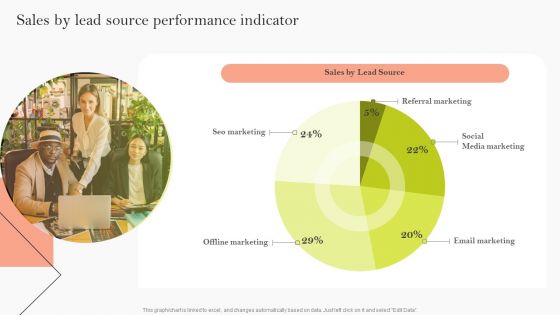
Sales By Lead Source Performance Indicator Ppt Pictures Graphics Template PDF
Explore a selection of the finest Sales By Lead Source Performance Indicator Ppt Pictures Graphics Template PDF here. With a plethora of professionally designed and pre made slide templates, you can quickly and easily find the right one for your upcoming presentation. You can use our Sales By Lead Source Performance Indicator Ppt Pictures Graphics Template PDF to effectively convey your message to a wider audience. Slidegeeks has done a lot of research before preparing these presentation templates. The content can be personalized and the slides are highly editable. Grab templates today from Slidegeeks.
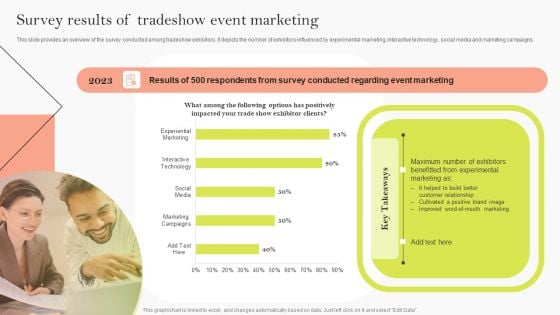
Survey Results Of Tradeshow Event Marketing Ppt Infographics Graphic Tips PDF
This slide provides an overview of the survey conducted among tradeshow exhibitors. It depicts the number of exhibitors influenced by experimental marketing, interactive technology, social media and marketing campaigns. Get a simple yet stunning designed Survey Results Of Tradeshow Event Marketing Ppt Infographics Graphic Tips PDF. It is the best one to establish the tone in your meetings. It is an excellent way to make your presentations highly effective. So, download this PPT today from Slidegeeks and see the positive impacts. Our easy to edit Survey Results Of Tradeshow Event Marketing Ppt Infographics Graphic Tips PDF can be your go to option for all upcoming conferences and meetings. So, what are you waiting for Grab this template today.
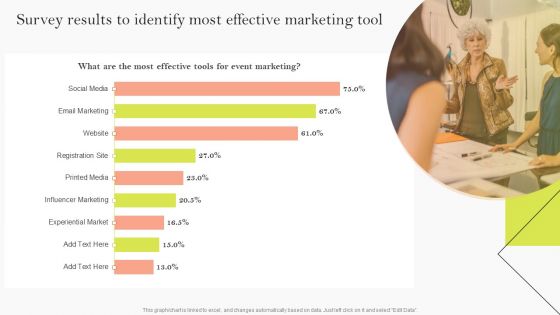
Survey Results To Identify Most Effective Marketing Tool Ppt Model Designs PDF
From laying roadmaps to briefing everything in detail, our templates are perfect for you. You can set the stage with your presentation slides. All you have to do is download these easy to edit and customizable templates. Survey Results To Identify Most Effective Marketing Tool Ppt Model Designs PDF will help you deliver an outstanding performance that everyone would remember and praise you for. Do download this presentation today.
Sales By Lead Source Performance Indicator Ppt Icon Images PDF
Explore a selection of the finest Sales By Lead Source Performance Indicator Ppt Icon Images PDF here. With a plethora of professionally designed and pre made slide templates, you can quickly and easily find the right one for your upcoming presentation. You can use our Sales By Lead Source Performance Indicator Ppt Icon Images PDF to effectively convey your message to a wider audience. Slidegeeks has done a lot of research before preparing these presentation templates. The content can be personalized and the slides are highly editable. Grab templates today from Slidegeeks.
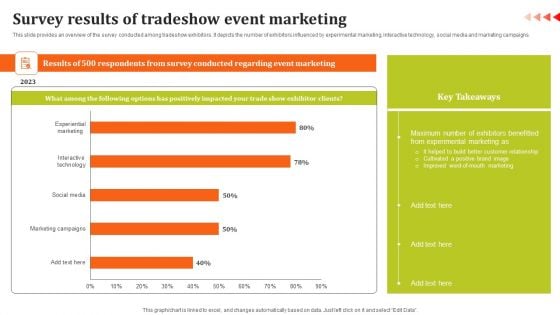
Survey Results Of Tradeshow Event Marketing Diagrams PDF
This slide provides an overview of the survey conducted among tradeshow exhibitors. It depicts the number of exhibitors influenced by experimental marketing, interactive technology, social media and marketing campaigns. Get a simple yet stunning designed Survey Results Of Tradeshow Event Marketing Diagrams PDF. It is the best one to establish the tone in your meetings. It is an excellent way to make your presentations highly effective. So, download this PPT today from Slidegeeks and see the positive impacts. Our easy to edit Survey Results Of Tradeshow Event Marketing Diagrams PDF can be your go to option for all upcoming conferences and meetings. So, what are you waiting for Grab this template today.
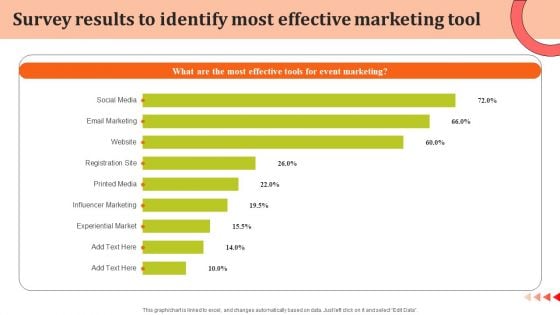
Survey Results To Identify Most Effective Marketing Tool Introduction PDF
From laying roadmaps to briefing everything in detail, our templates are perfect for you. You can set the stage with your presentation slides. All you have to do is download these easy to edit and customizable templates. Survey Results To Identify Most Effective Marketing Tool Introduction PDF will help you deliver an outstanding performance that everyone would remember and praise you for. Do download this presentation today.
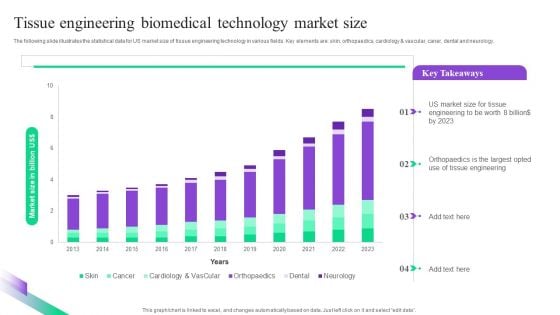
Tissue Engineering Biomedical Technology Market Size Summary PDF
The following slide illustrates the statistical data for US market size of tissue engineering technology in various fields. Key elements are skin, orthopaedics, cardiology and vascular, caner, dental and neurology. Pitch your topic with ease and precision using this Tissue Engineering Biomedical Technology Market Size Summary PDF. This layout presents information on Tissue, Engineering, Market Size. It is also available for immediate download and adjustment. So, changes can be made in the color, design, graphics or any other component to create a unique layout.
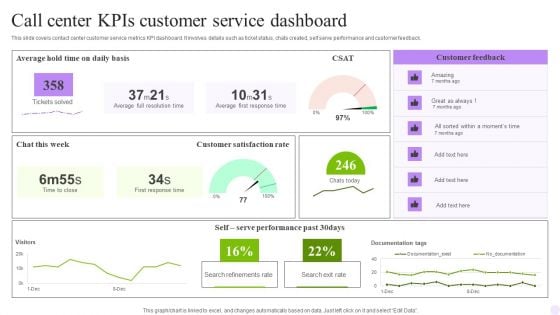
Call Center Kpis Customer Service Dashboard Pictures PDF
This slide covers contact center customer service metrics KPI dashboard. It involves details such as ticket status, chats created, self serve performance and customer feedback. Pitch your topic with ease and precision using this Call Center Kpis Customer Service Dashboard Pictures PDF. This layout presents information on Response Time, Customer, Dashboard. It is also available for immediate download and adjustment. So, changes can be made in the color, design, graphics or any other component to create a unique layout.
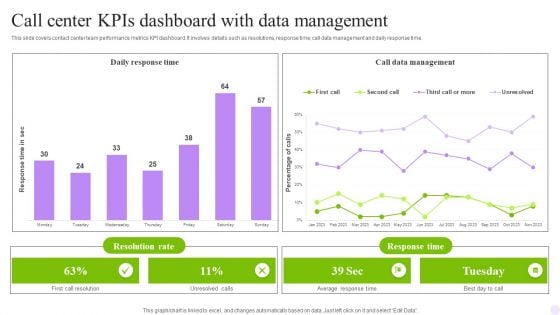
Call Center Kpis Dashboard With Data Management Infographics PDF
This slide covers contact center metrics KPI dashboard with call data details. It involves details such as total number of contacts handled, product sales, repeated calls and contact handles per day. Pitch your topic with ease and precision using this Call Center Kpis Dashboard With Data Management Infographics PDF. This layout presents information on Achieved, Contacts Handled, Repeated Calls. It is also available for immediate download and adjustment. So, changes can be made in the color, design, graphics or any other component to create a unique layout.
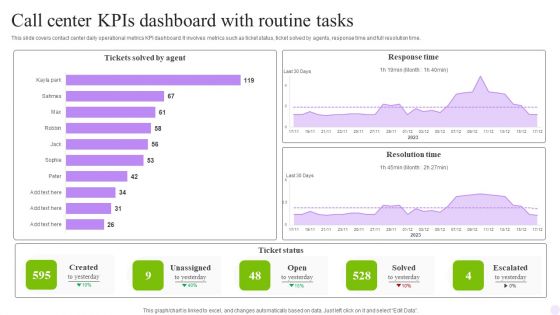
Call Center Kpis Dashboard With Routine Tasks Structure PDF
This slide covers contact center daily operational metrics KPI dashboard. It involves metrics such as ticket status, ticket solved by agents, response time and full resolution time. Pitch your topic with ease and precision using this Call Center Kpis Dashboard With Routine Tasks Structure PDF. This layout presents information on Agent, Response Time, Routine Tasks. It is also available for immediate download and adjustment. So, changes can be made in the color, design, graphics or any other component to create a unique layout.
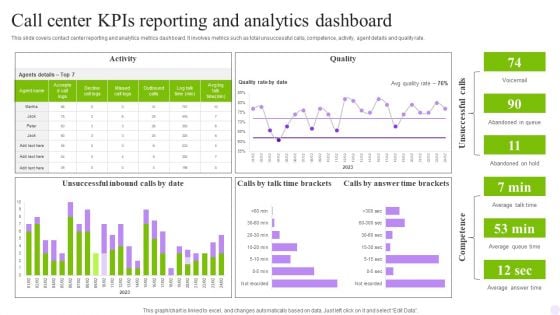
Call Center Kpis Reporting And Analytics Dashboard Download PDF
This slide covers contact center reporting and analytics metrics dashboard. It involves metrics such as total unsuccessful calls, competence, activity, agent details and quality rate. Pitch your topic with ease and precision using this Call Center Kpis Reporting And Analytics Dashboard Download PDF. This layout presents information on Activity, Quality, Dashboard. It is also available for immediate download and adjustment. So, changes can be made in the color, design, graphics or any other component to create a unique layout.
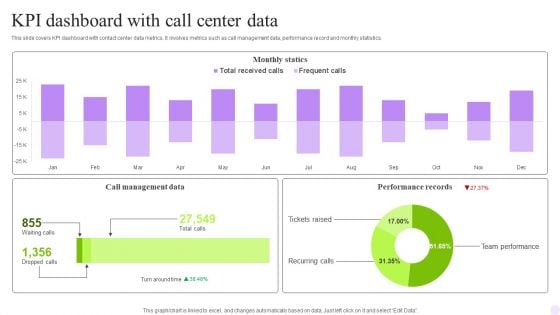
KPI Dashboard With Call Center Data Rules PDF
This slide covers contact center performance metrics KPI dashboard. It involves details such as number of total calls, average answer speed, abandon rate, data of agents performance and call abandon rate by departments. Pitch your topic with ease and precision using this KPI Dashboard With Call Center Data Rules PDF. This layout presents information on Monthly Statics, Management Data, Performance Records. It is also available for immediate download and adjustment. So, changes can be made in the color, design, graphics or any other component to create a unique layout.
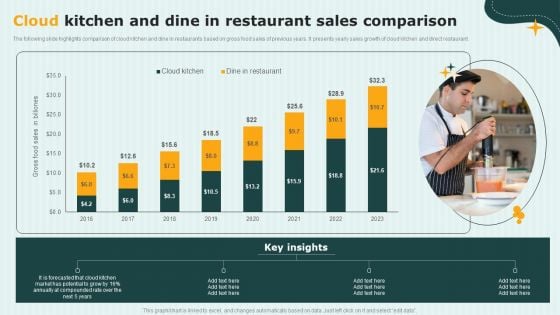
International Cloud Kitchen Industry Analysis Cloud Kitchen And Dine In Restaurant Sales Comparison Rules PDF
The following slide highlights comparison of cloud kitchen and dine in restaurants based on gross food sales of previous years. It presents yearly sales growth of cloud kitchen and direct restaurant. Want to ace your presentation in front of a live audience Our International Cloud Kitchen Industry Analysis Cloud Kitchen And Dine In Restaurant Sales Comparison Rules PDF can help you do that by engaging all the users towards you.. Slidegeeks experts have put their efforts and expertise into creating these impeccable powerpoint presentations so that you can communicate your ideas clearly. Moreover, all the templates are customizable, and easy-to-edit and downloadable. Use these for both personal and commercial use.
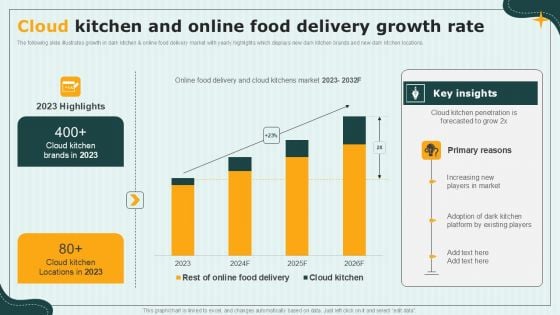
International Cloud Kitchen Industry Analysis Cloud Kitchen And Online Food Delivery Growth Rate Topics PDF
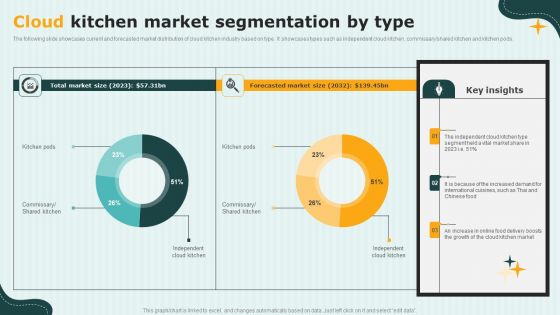
International Cloud Kitchen Industry Analysis Cloud Kitchen Market Segmentation By Type Introduction PDF
The following slide showcases current and forecasted market distribution of cloud kitchen industry based on type. It showcases types such as independent cloud kitchen, commissary shared kitchen and kitchen pods. Do you have an important presentation coming up Are you looking for something that will make your presentation stand out from the rest Look no further than International Cloud Kitchen Industry Analysis Cloud Kitchen Market Segmentation By Type Introduction PDF. With our professional designs, you can trust that your presentation will pop and make delivering it a smooth process. And with Slidegeeks, you can trust that your presentation will be unique and memorable. So why wait Grab International Cloud Kitchen Industry Analysis Cloud Kitchen Market Segmentation By Type Introduction PDF today and make your presentation stand out from the rest
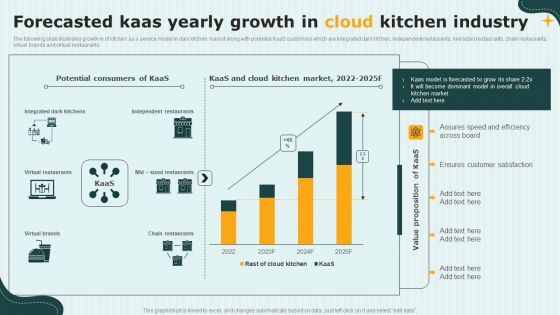
International Cloud Kitchen Industry Analysis Forecasted Kaas Yearly Growth In Cloud Kitchen Industry Slides PDF
The following slide illustrates growth in of kitchen as a service model in dark kitchen market along with potential KaaS customers which are integrated dark kitchen, independent restaurants, mid sized restaurants, chain restaurants, virtual brands and virtual restaurants. Coming up with a presentation necessitates that the majority of the effort goes into the content and the message you intend to convey. The visuals of a PowerPoint presentation can only be effective if it supplements and supports the story that is being told. Keeping this in mind our experts created International Cloud Kitchen Industry Analysis Forecasted Kaas Yearly Growth In Cloud Kitchen Industry Slides PDF to reduce the time that goes into designing the presentation. This way, you can concentrate on the message while our designers take care of providing you with the right template for the situation.
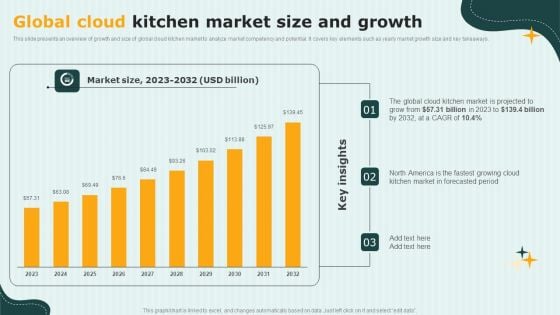
International Cloud Kitchen Industry Analysis Global Cloud Kitchen Market Size And Growth Diagrams PDF
This slide presents an overview of growth and size of global cloud kitchen market to analyze market competency and potential. It covers key elements such as yearly market growth size and key takeaways. This modern and well-arranged International Cloud Kitchen Industry Analysis Global Cloud Kitchen Market Size And Growth Diagrams PDF provides lots of creative possibilities. It is very simple to customize and edit with the Powerpoint Software. Just drag and drop your pictures into the shapes. All facets of this template can be edited with Powerpoint, no extra software is necessary. Add your own material, put your images in the places assigned for them, adjust the colors, and then you can show your slides to the world, with an animated slide included.
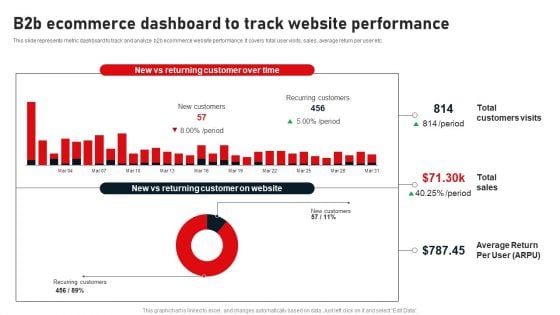
B2B Ecommerce Dashboard To Track Website Performance Designs PDF
This slide represents metric dashboard to track and analyze b2b ecommerce website performance. It covers total user visits, sales, average return per user etc. Presenting this PowerPoint presentation, titled B2B Ecommerce Dashboard To Track Website Performance Designs PDF, with topics curated by our researchers after extensive research. This editable presentation is available for immediate download and provides attractive features when used. Download now and captivate your audience. Presenting this B2B Ecommerce Dashboard To Track Website Performance Designs PDF. Our researchers have carefully researched and created these slides with all aspects taken into consideration. This is a completely customizable B2B Ecommerce Dashboard To Track Website Performance Designs PDF that is available for immediate downloading. Download now and make an impact on your audience. Highlight the attractive features available with our PPTs.
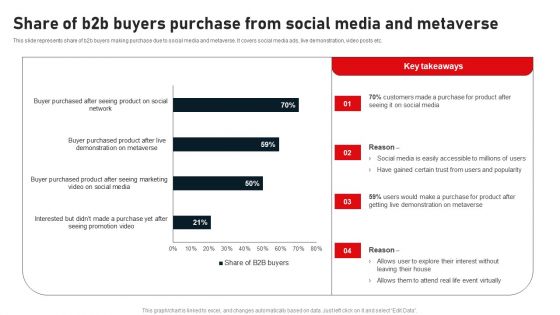
Share Of B2B Buyers Purchase From Social Media And Metaverse Portrait PDF
This slide represents share of b2b buyers making purchase due to social media and metaverse. It covers social media ads, live demonstration, video posts etc. There are so many reasons you need a Share Of B2B Buyers Purchase From Social Media And Metaverse Portrait PDF. The first reason is you can not spend time making everything from scratch, Thus, Slidegeeks has made presentation templates for you too. You can easily download these templates from our website easily.
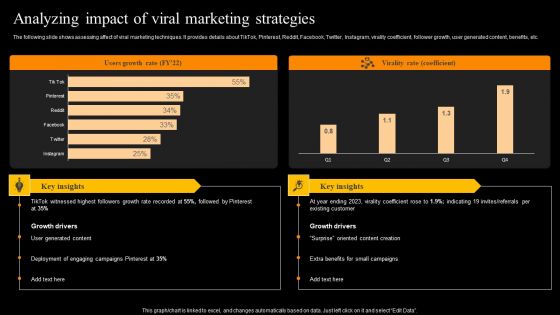
Buzz Marketing Strategies To Expand Campaign Reach Analyzing Impact Of Viral Marketing Strategies Template PDF
The following slide shows assessing affect of viral marketing techniques. It provides details about TikTok, Pinterest, Reddit, Facebook, Twitter, Instagram, virality coefficient, follower growth, user generated content, benefits, etc. Find a pre designed and impeccable Buzz Marketing Strategies To Expand Campaign Reach Analyzing Impact Of Viral Marketing Strategies Template PDF. The templates can ace your presentation without additional effort. You can download these easy to edit presentation templates to make your presentation stand out from others. So, what are you waiting for Download the template from Slidegeeks today and give a unique touch to your presentation.
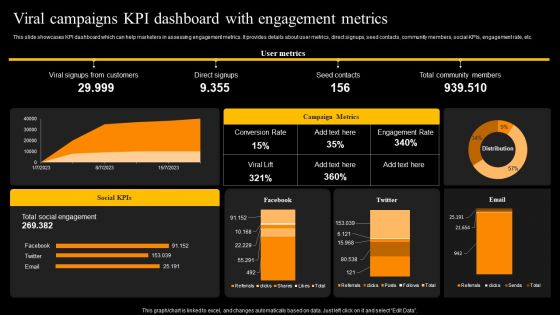
Viral Campaigns Kpi Dashboard With Engagement Metrics Template PDF
This slide showcases KPI dashboard which can help marketers in assessing engagement metrics. It provides details about user metrics, direct signups, seed contacts, community members, social KPIs, engagement rate, etc. Want to ace your presentation in front of a live audience Our Viral Campaigns Kpi Dashboard With Engagement Metrics Template PDF can help you do that by engaging all the users towards you. Slidegeeks experts have put their efforts and expertise into creating these impeccable powerpoint presentations so that you can communicate your ideas clearly. Moreover, all the templates are customizable, and easy to edit and downloadable. Use these for both personal and commercial use.
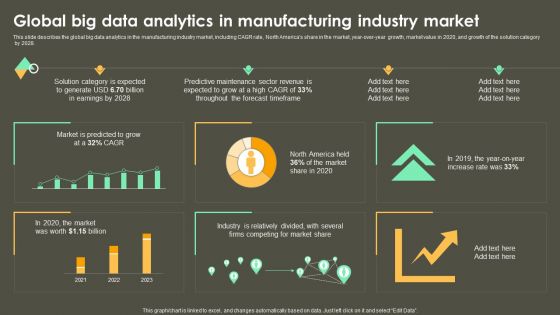
Iot Integration In Manufacturing Global Big Data Analytics In Manufacturing Industry Market Infographics PDF
This slide describes the global big data analytics in the manufacturing industry market, including CAGR rate, North Americas share in the market, year-over-year growth, market value in 2020, and growth of the solution category by 2028. Coming up with a presentation necessitates that the majority of the effort goes into the content and the message you intend to convey. The visuals of a PowerPoint presentation can only be effective if it supplements and supports the story that is being told. Keeping this in mind our experts created Iot Integration In Manufacturing Global Big Data Analytics In Manufacturing Industry Market Infographics PDF to reduce the time that goes into designing the presentation. This way, you can concentrate on the message while our designers take care of providing you with the right template for the situation.
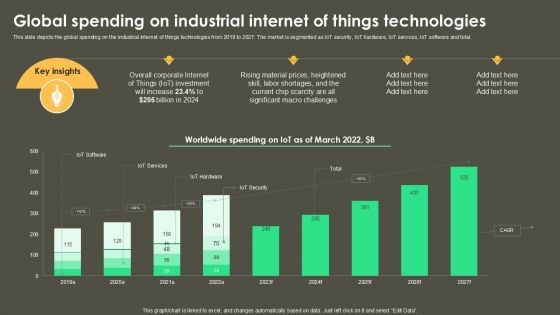
Iot Integration In Manufacturing Global Spending On Industrial Internet Of Things Technologies Topics PDF
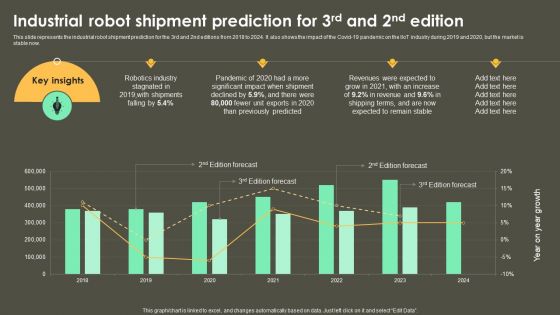
Iot Integration In Manufacturing Industrial Robot Shipment Prediction For 3Rd And 2Nd Edition Themes PDF
This slide represents the industrial robot shipment prediction for the 3rd and 2nd editions from 2018 to 2024. It also shows the impact of the Covid-19 pandemic on the IIoT industry during 2019 and 2020, but the market is stable now. This Iot Integration In Manufacturing Industrial Robot Shipment Prediction For 3Rd And 2Nd Edition Themes PDF from Slidegeeks makes it easy to present information on your topic with precision. It provides customization options, so you can make changes to the colors, design, graphics, or any other component to create a unique layout. It is also available for immediate download, so you can begin using it right away. Slidegeeks has done good research to ensure that you have everything you need to make your presentation stand out. Make a name out there for a brilliant performance.
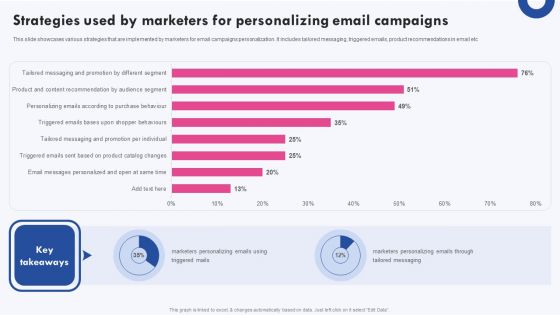
Targeted Marketing Campaigns To Improve Buyers Experience Strategies Used By Marketers For Personalizing Mockup PDF
This slide showcases various strategies that are implemented by marketers for email campaigns personalization. It includes tailored messaging, triggered emails, product recommendations in email etc Formulating a presentation can take up a lot of effort and time, so the content and message should always be the primary focus. The visuals of the PowerPoint can enhance the presenters message, so our Targeted Marketing Campaigns To Improve Buyers Experience Strategies Used By Marketers For Personalizing Mockup PDF was created to help save time. Instead of worrying about the design, the presenter can concentrate on the message while our designers work on creating the ideal templates for whatever situation is needed. Slidegeeks has experts for everything from amazing designs to valuable content, we have put everything into Targeted Marketing Campaigns To Improve Buyers Experience Strategies Used By Marketers For Personalizing Mockup PDF
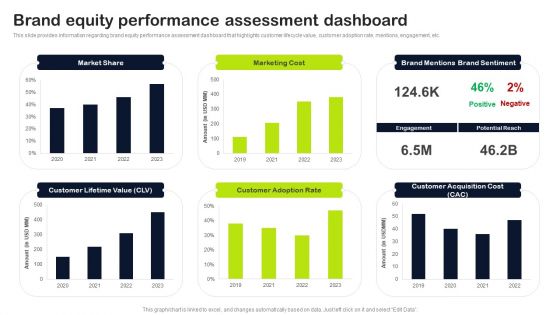
Key Elements Of Strategic Brand Administration Brand Equity Performance Assessment Dashboard Elements PDF
This slide provides information regarding brand equity performance assessment dashboard that highlights customer lifecycle value, customer adoption rate, mentions, engagement, etc. Get a simple yet stunning designed Key Elements Of Strategic Brand Administration Brand Equity Performance Assessment Dashboard Elements PDF. It is the best one to establish the tone in your meetings. It is an excellent way to make your presentations highly effective. So, download this PPT today from Slidegeeks and see the positive impacts. Our easy-to-edit Key Elements Of Strategic Brand Administration Brand Equity Performance Assessment Dashboard Elements PDF can be your go-to option for all upcoming conferences and meetings. So, what are you waiting for Grab this template today.
Key Elements Of Strategic Brand Administration Rebranding Performance Tracking Dashboard Track Elements PDF
This slide provides information regarding rebranding performance tracking dashboard in order to track renewed brand. It includes details about total spent, total link clicks, total conversations, etc. There are so many reasons you need a Key Elements Of Strategic Brand Administration Rebranding Performance Tracking Dashboard Track Elements PDF. The first reason is you can not spend time making everything from scratch, Thus, Slidegeeks has made presentation templates for you too. You can easily download these templates from our website easily.
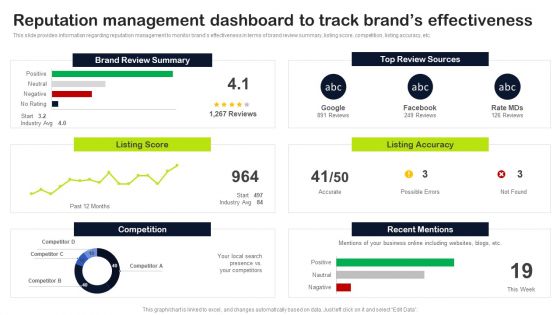
Key Elements Of Strategic Brand Administration Reputation Management Dashboard To Track Brands Brochure PDF
This slide provides information regarding reputation management to monitor brands effectiveness in terms of brand review summary, listing score, competition, listing accuracy, etc. Get a simple yet stunning designed Key Elements Of Strategic Brand Administration Reputation Management Dashboard To Track Brands Brochure PDF. It is the best one to establish the tone in your meetings. It is an excellent way to make your presentations highly effective. So, download this PPT today from Slidegeeks and see the positive impacts. Our easy-to-edit Key Elements Of Strategic Brand Administration Reputation Management Dashboard To Track Brands Brochure PDF can be your go-to option for all upcoming conferences and meetings. So, what are you waiting for Grab this template today.
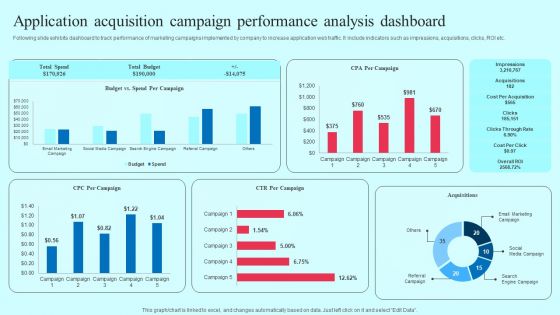
Application Acquisition Campaign Performance Analysis Dashboard Information PDF
Following slide exhibits dashboard to track performance of marketing campaigns implemented by company to increase application web traffic. It include indicators such as impressions, acquisitions, clicks, ROI etc. Find a pre designed and impeccable Application Acquisition Campaign Performance Analysis Dashboard Information PDF. The templates can ace your presentation without additional effort. You can download these easy to edit presentation templates to make your presentation stand out from others. So, what are you waiting for Download the template from Slidegeeks today and give a unique touch to your presentation.
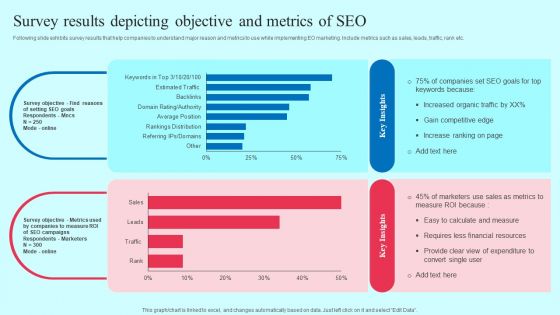
Smartphone Application User Acquisition Techniques Survey Results Depicting Objective And Metrics Of SEO Mockup PDF
Following slide exhibits survey results that help companies to understand major reason and metrics to use while implementing EO marketing. Include metrics such as sales, leads, traffic, rank etc. Want to ace your presentation in front of a live audience Our Smartphone Application User Acquisition Techniques Survey Results Depicting Objective And Metrics Of SEO Mockup PDF can help you do that by engaging all the users towards you. Slidegeeks experts have put their efforts and expertise into creating these impeccable powerpoint presentations so that you can communicate your ideas clearly. Moreover, all the templates are customizable, and easy to edit and downloadable. Use these for both personal and commercial use.
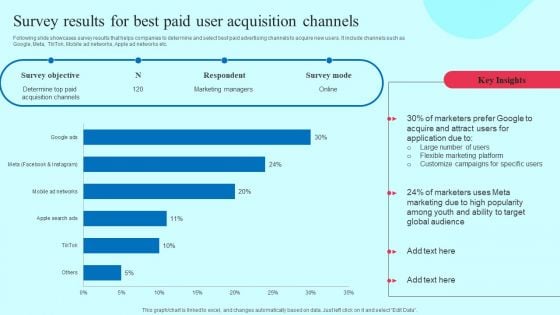
Smartphone Application User Acquisition Techniques Survey Results For Best Paid User Acquisition Channels Summary PDF
Following slide showcases survey results that helps companies to determine and select best paid advertising channels to acquire new users. It include channels such as Google, Meta, TikTok, Mobile ad networks, Apple ad networks etc. There are so many reasons you need a Smartphone Application User Acquisition Techniques Survey Results For Best Paid User Acquisition Channels Summary PDF. The first reason is you can not spend time making everything from scratch, Thus, Slidegeeks has made presentation templates for you too. You can easily download these templates from our website easily.
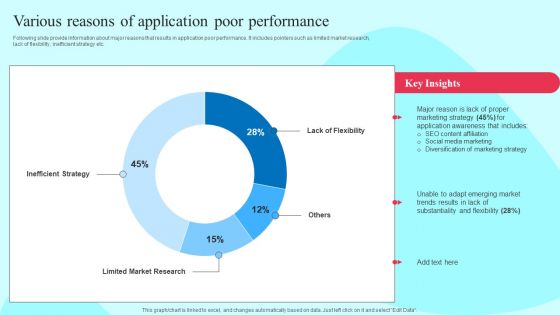
Smartphone Application User Acquisition Techniques Various Reasons Of Application Poor Performance Portrait PDF
Following slide provide information about major reasons that results in application poor performance. It includes pointers such as limited market research, lack of flexibility, inefficient strategy etc. Present like a pro with Smartphone Application User Acquisition Techniques Various Reasons Of Application Poor Performance Portrait PDF Create beautiful presentations together with your team, using our easy to use presentation slides. Share your ideas in real time and make changes on the fly by downloading our templates. So whether you are in the office, on the go, or in a remote location, you can stay in sync with your team and present your ideas with confidence. With Slidegeeks presentation got a whole lot easier. Grab these presentations today.
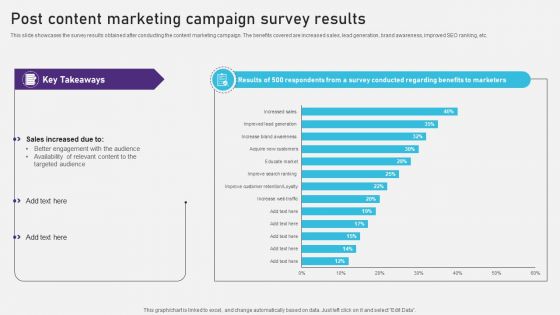
Advertising Campaign Optimization Process Post Content Marketing Campaign Survey Results Mockup PDF
This slide showcases the survey results obtained after conducting the content marketing campaign. The benefits covered are increased sales, lead generation, brand awareness, improved SEO ranking, etc. There are so many reasons you need a Advertising Campaign Optimization Process Post Content Marketing Campaign Survey Results Mockup PDF. The first reason is you can not spend time making everything from scratch, Thus, Slidegeeks has made presentation templates for you too. You can easily download these templates from our website easily.
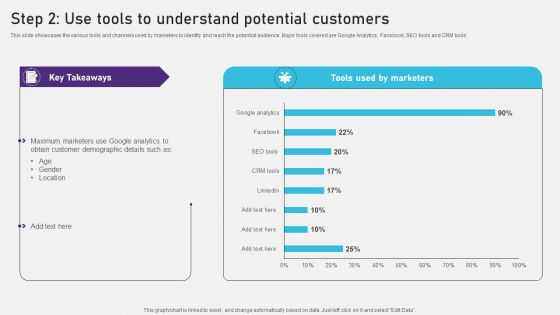
Advertising Campaign Optimization Process Step 2 Use Tools To Understand Potential Download PDF
This slide showcases the various tools and channels used by marketers to identify and reach the potential audience. Major tools covered are Google Analytics, Facebook, SEO tools and CRM tools. Get a simple yet stunning designed Advertising Campaign Optimization Process Step 2 Use Tools To Understand Potential Download PDF. It is the best one to establish the tone in your meetings. It is an excellent way to make your presentations highly effective. So, download this PPT today from Slidegeeks and see the positive impacts. Our easy to edit Advertising Campaign Optimization Process Step 2 Use Tools To Understand Potential Download PDF can be your go to option for all upcoming conferences and meetings. So, what are you waiting for Grab this template today.


 Continue with Email

 Home
Home


