Cost
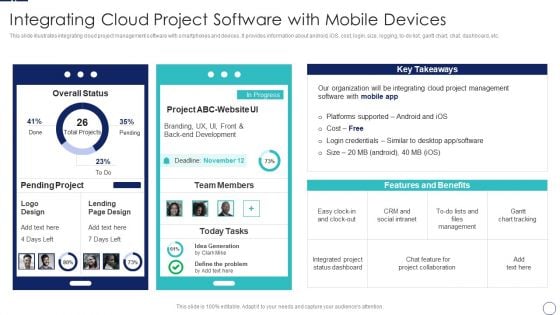
How To Implement Cloud Collaboration Integrating Cloud Project Software With Mobile Devices Inspiration PDF
This slide illustrates integrating cloud project management software with smartphones and devices. It provides information about android, iOS, cost, login, size, logging, to-do list, gantt chart, chat, dashboard, etc. Deliver and pitch your topic in the best possible manner with this How To Implement Cloud Collaboration Integrating Cloud Project Software With Mobile Devices Inspiration PDF. Use them to share invaluable insights on Our Organization, Integrating Cloud, Project Management and impress your audience. This template can be altered and modified as per your expectations. So, grab it now.
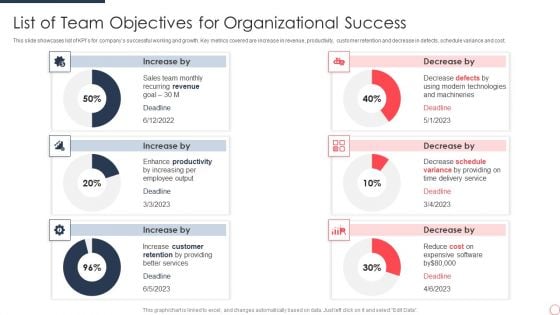
List Of Team Objectives For Organizational Success Ideas PDF
This slide showcases list of KPIs for companys successful working and growth. Key metrics covered are increase in revenue, productivity, customer retention and decrease in defects, schedule variance and cost. Showcasing this set of slides titled List Of Team Objectives For Organizational Success Ideas PDF. The topics addressed in these templates are Sales Team, Recurring Revenue, Goal. All the content presented in this PPT design is completely editable. Download it and make adjustments in color, background, font etc. as per your unique business setting.
New Service Launch And Development Strategy To Gain Market Share Service Subscription And Revenue Demonstration PDF
This slide showcases dashboard that can help organization to identify the new customers acquired and revenue generated by service subscriptions. Its key components are average weekly subscription revenue, subscription sales target, customer lifetime value and customer acquisition cost.Deliver an awe inspiring pitch with this creative New Service Launch And Development Strategy To Gain Market Share Service Subscription And Revenue Demonstration PDF bundle. Topics like Average Revenue, Average Customer, Customer Acquisition can be discussed with this completely editable template. It is available for immediate download depending on the needs and requirements of the user.
Marketing And Operations Dashboard For Performance Management Icons PDF
This slide covers sales and operation dashboard for performance management. It involves details such as number of new buyers, sales revenue, average revenue per unit etc. Pitch your topic with ease and precision using this Marketing And Operations Dashboard For Performance Management Icons PDF. This layout presents information on Average Revenue Per Unit, Customer Acquisition Cost, Customer Lifetime Value. It is also available for immediate download and adjustment. So, changes can be made in the color, design, graphics or any other component to create a unique layout.
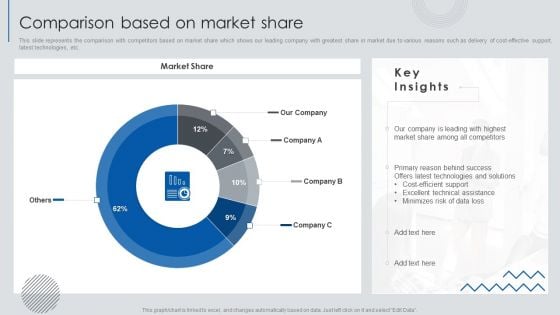
Information Technology Solutions Business Profile Comparison Based On Market Share Rules PDF
This slide represents the comparison with competitors based on market share which shows our leading company with greatest share in market due to various reasons such as delivery of cost-effective support, latest technologies, etc. Deliver and pitch your topic in the best possible manner with this Information Technology Solutions Business Profile Comparison Based On Market Share Rules PDF. Use them to share invaluable insights on Leading Highest, Among Competitors, Behind Success and impress your audience. This template can be altered and modified as per your expectations. So, grab it now.
Small Business Venture Company Profile Comparison Based On Market Share Summary PDF
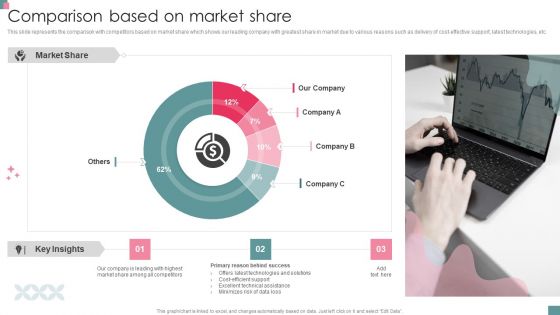
This slide represents the comparison with competitors based on market share which shows our leading company with greatest share in market due to various reasons such as delivery of cost-effective support, latest technologies, etc. Deliver and pitch your topic in the best possible manner with this Small Business Venture Company Profile Comparison Based On Market Share Summary PDF. Use them to share invaluable insights on Among Competitors, Technologies And Solutions, Technical Assistance and impress your audience. This template can be altered and modified as per your expectations. So, grab it now.
Dashboard For Logistics KPI Management System Of Logistics Company Infographics PDF
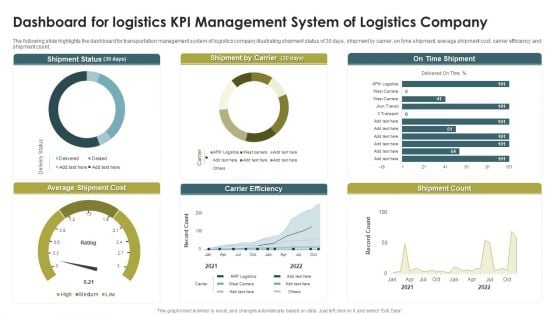
The following slide highlights the dashboard for transportation management system of logistics company illustrating shipment status of 30 days, shipment by carrier, on time shipment, average shipment cost, carrier efficiency and shipment count. Pitch your topic with ease and precision using this Dashboard For Logistics KPI Management System Of Logistics Company Infographics PDF. This layout presents information on Shipment Status, Shipment By Carrier, On Time Shipment. It is also available for immediate download and adjustment. So, changes can be made in the color, design, graphics or any other component to create a unique layout.
Impact Of Wellness Program On Personnel Well Being Stats Information PDF
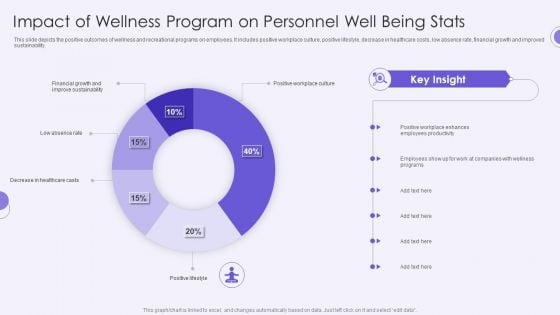
This slide depicts the positive outcomes of wellness and recreational programs on employees. It includes positive workplace culture, positive lifestyle, decrease in healthcare costs, low absence rate, financial growth and improved sustainability.Showcasing this set of slides titled Impact Of Wellness Program On Personnel Well Being Stats Information PDF. The topics addressed in these templates are Improve Sustainability, Financial Growth, Low Absence. All the content presented in this PPT design is completely editable. Download it and make adjustments in color, background, font etc. as per your unique business setting.
IT Consultancy Services Company Profile Comparison Based On Market Share Ideas PDF
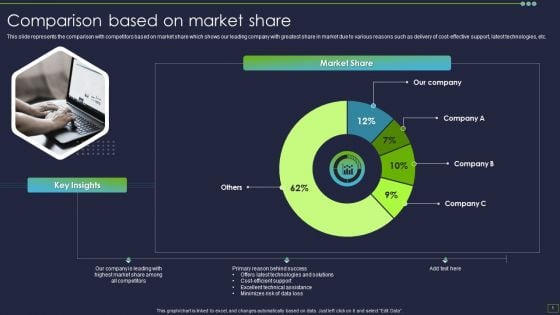
This slide represents the comparison with competitors based on market share which shows our leading company with greatest share in market due to various reasons such as delivery of cost-effective support, latest technologies, etc. Deliver and pitch your topic in the best possible manner with this IT Consultancy Services Company Profile Comparison Based On Market Share Ideas PDF. Use them to share invaluable insights on Market Share, Key Insights, Primary Reason and impress your audience. This template can be altered and modified as per your expectations. So, grab it now.
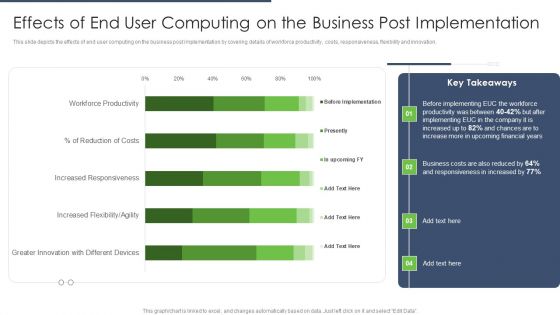
End User Computing Effects Of End User Computing On The Business Post Implementation Introduction PDF
This slide depicts the effects of end user computing on the business post implementation by covering details of workforce productivity, costs, responsiveness, flexibility and innovation.Deliver and pitch your topic in the best possible manner with this End User Computing Effects Of End User Computing On The Business Post Implementation Introduction PDF. Use them to share invaluable insights on Greater Innovation, Different Devices, Increased Flexibility, Increased Responsiveness and impress your audience. This template can be altered and modified as per your expectations. So, grab it now.
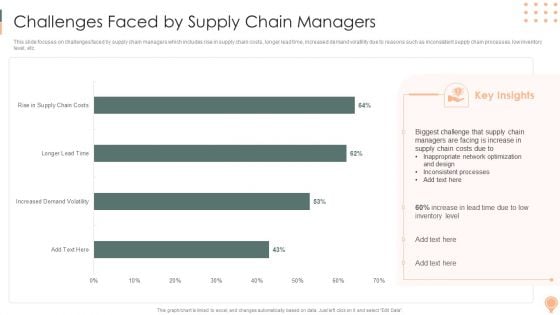
Supply Chain Approaches Challenges Faced By Supply Chain Managers Download PDF
This slide focuses on challenges faced by supply chain managers which includes rise in supply chain costs, longer lead time, increased demand volatility due to reasons such as inconsistent supply chain processes, low inventory level, etc.Deliver an awe inspiring pitch with this creative Supply Chain Approaches Challenges Faced By Supply Chain Managers Download PDF bundle. Topics like Inconsistent Processes, Inappropriate Optimization, Inventory Level can be discussed with this completely editable template. It is available for immediate download depending on the needs and requirements of the user.

Business Performance Review Dashboard To Measure Overall Business Performance Formats PDF
The following slide highlights a comprehensive quarterly business review QBR dashboard which can be used by the organization to evaluate business performance. The metrics used for review are total revenue, new customers, gross profit, overall costs, sales comparison, sales by different products and top performing channels. Showcasing this set of slides titled Business Performance Review Dashboard To Measure Overall Business Performance Formats PDF. The topics addressed in these templates are Sales Comparison, Sales Product, High Performing. All the content presented in this PPT design is completely editable. Download it and make adjustments in color, background, font etc. as per your unique business setting.
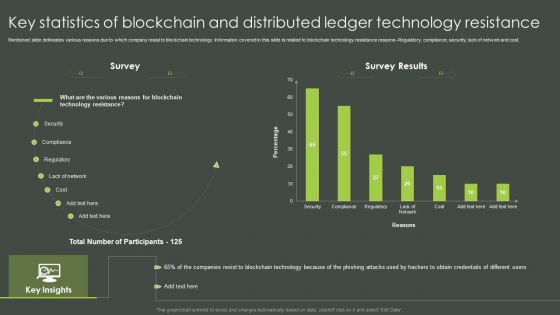
Key Statistics Of Blockchain And Distributed Ledger Technology Resistance Themes PDF
Mentioned slide delineates various reasons due to which company resist to blockchain technology. Information covered in this slide is related to blockchain technology resistance reasons -Regulatory, compliance, security, lack of network and cost. Showcasing this set of slides titled Key Statistics Of Blockchain And Distributed Ledger Technology Resistance Themes PDF. The topics addressed in these templates are Blockchain, Technology Resistance, Total Number Participants. All the content presented in this PPT design is completely editable. Download it and make adjustments in color, background, font etc. as per your unique business setting.
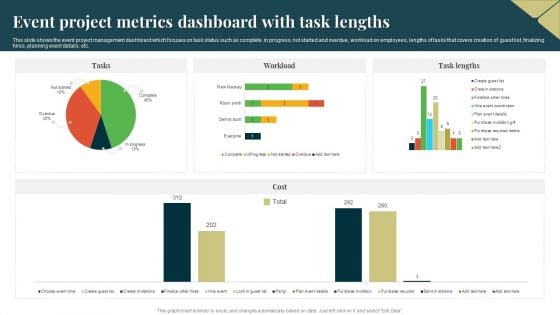
Event Project Metrics Dashboard With Task Lengths Template PDF
This slide shows the event project management dashboard which focuses on task status such as complete, in progress, not started and overdue, workload on employees, lengths of tasks that covers creation of guest list, finalizing hires, planning event details, etc. Showcasing this set of slides titled Event Project Metrics Dashboard With Task Lengths Template PDF. The topics addressed in these templates are Event Project Metrics Dashboard, Cost. All the content presented in this PPT design is completely editable. Download it and make adjustments in color, background, font etc. as per your unique business setting.
Project Metrics Dashboard With Task Summary Icons PDF
This slide shows the project management dashboard which covers the summary of different projects with time, cost, workload, tasks and progress with workload, created verses completed tasks, time spent on managing projects, etc. Showcasing this set of slides titled Project Metrics Dashboard With Task Summary Icons PDF. The topics addressed in these templates are Project Metrics Dashboard, Task Summary. All the content presented in this PPT design is completely editable. Download it and make adjustments in color, background, font etc. as per your unique business setting.
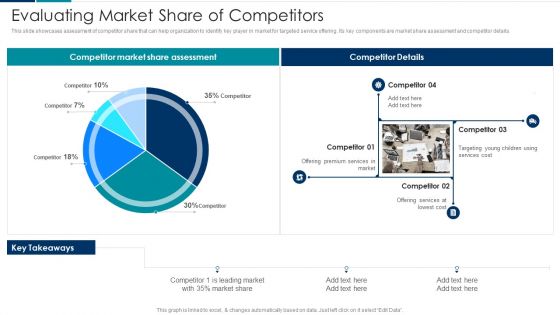
Managing New Service Roll Out And Marketing Procedure Evaluating Market Share Of Competitors Inspiration PDF
This slide showcases assessment of competitor share that can help organization to identify key player in market for targeted service offering. Its key components are market share assessment and competitor details. Deliver an awe inspiring pitch with this creative Managing New Service Roll Out And Marketing Procedure Evaluating Market Share Of Competitors Inspiration PDF bundle. Topics like Services Cost, Evaluating Market Share can be discussed with this completely editable template. It is available for immediate download depending on the needs and requirements of the user.
Customer Service Metrics Dashboard With Customer Retention Rate Icons PDF
This slide showcases KPIs dashboard for customer service that can help organization to track the consumer satisfaction score and improve product or service by improving customer loyalty. Its key components are net promoter score, customer retention and support costs. Showcasing this set of slides titled Customer Service Metrics Dashboard With Customer Retention Rate Icons PDF. The topics addressed in these templates are Customer Retention, Net Promoter Score, Service Level. All the content presented in this PPT design is completely editable. Download it and make adjustments in color, background, font etc. as per your unique business setting.
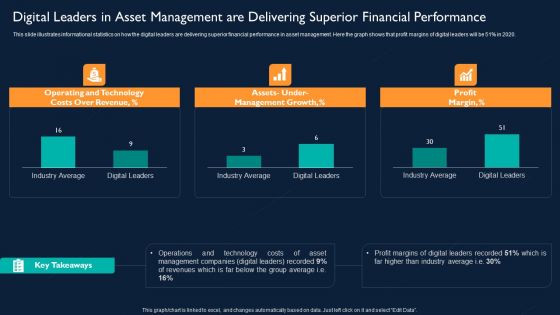
Digital Leaders In Asset Management Are Delivering Superior Financial Performance Designs PDF
This slide illustrates informational statistics on how the digital leaders are delivering superior financial performance in asset management. Here the graph shows that profit margins of digital leaders will be 51 percentage in 2020. Deliver and pitch your topic in the best possible manner with this Digital Leaders In Asset Management Are Delivering Superior Financial Performance Designs PDF. Use them to share invaluable insights on Operating And Technology Costs, Management Growth, Profit Margin and impress your audience. This template can be altered and modified as per your expectations. So, grab it now.

Brand Promotion Communication Strategy Dashboard For Analyzing Brand Perception Introduction PDF
This slide covers the dashboard for tracking brand reputation. It also includes metrics such as new customer lifetime value, customer acquisition cost, target met, above sales target, average weekly sales revenue, etc. Deliver an awe inspiring pitch with this creative Brand Promotion Communication Strategy Dashboard For Analyzing Brand Perception Introduction PDF bundle. Topics like New customer YTD, Sales revenue YTD, Profit YTD can be discussed with this completely editable template. It is available for immediate download depending on the needs and requirements of the user.
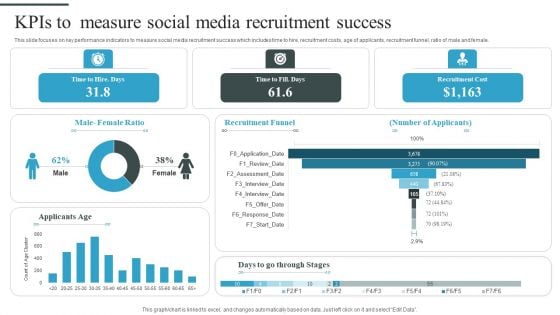
Tactical Process For Social Kpis To Measure Social Media Recruitment Success Demonstration PDF
This slide focuses on key performance indicators to measure social media recruitment success which includes time to hire, recruitment costs, age of applicants, recruitment funnel, ratio of male and female. Deliver an awe inspiring pitch with this creative Tactical Process For Social Kpis To Measure Social Media Recruitment Success Demonstration PDF bundle. Topics like Male Female Ratio, Recruitment Funnel, Number Applicants can be discussed with this completely editable template. It is available for immediate download depending on the needs and requirements of the user.

Commercial And Urban Architect Business Profile Company Revenue And Profit For 2017 And 2022 Introduction PDF
This slide highlights the company revenue and profit increases with supply chain planning and automation which includes data of 2018 and 2022 through bar graph. Deliver and pitch your topic in the best possible manner with this Commercial And Urban Architect Business Profile Company Revenue And Profit For 2017 And 2022 Introduction PDF. Use them to share invaluable insights on Additional Costs, Revenue Increased, Profits and impress your audience. This template can be altered and modified as per your expectations. So, grab it now.
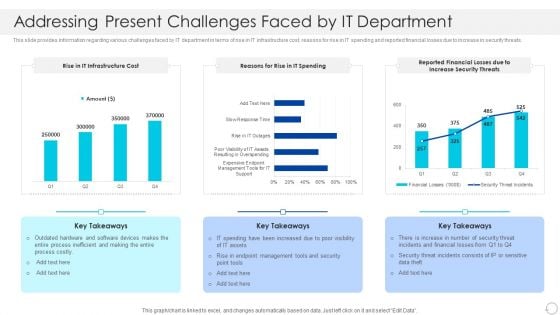
Addressing Present Challenges Faced By IT Department Download PDF
This slide provides information regarding various challenges faced by IT department in terms of rise in IT infrastructure cost, reasons for rise in IT spending and reported financial losses due to increase in security threats. Deliver and pitch your topic in the best possible manner with this Addressing Present Challenges Faced By IT Department Download PDF. Use them to share invaluable insights on Management Tools, Financial, Security and impress your audience. This template can be altered and modified as per your expectations. So, grab it now.
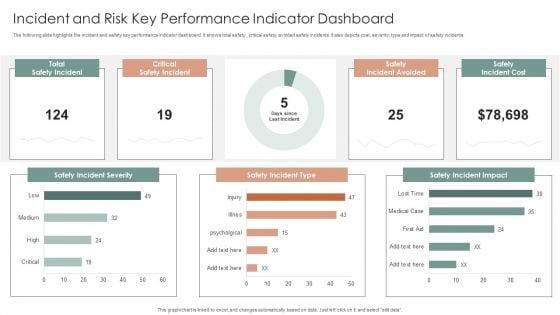
Incident And Risk Key Performance Indicator Dashboard Ppt Gallery Mockup PDF
The following slide highlights the incident and safety key performance indicator dashboard. It shows total safety, critical safety, avoided safety incidents. It also depicts cost, severity, type and impact of safety incidents. Showcasing this set of slides titled Incident And Risk Key Performance Indicator Dashboard Ppt Gallery Mockup PDF. The topics addressed in these templates are Safety Incident Severity, Safety Incident Type, Safety Incident Impact. All the content presented in this PPT design is completely editable. Download it and make adjustments in color, background, font etc. as per your unique business setting.
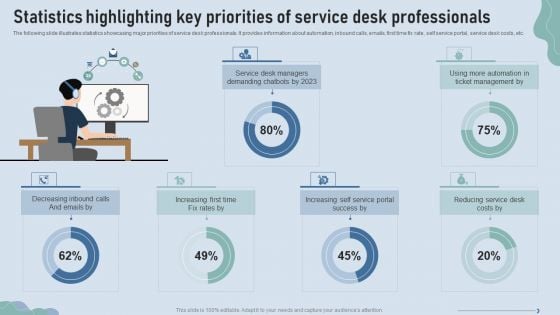
Improve IT Service Desk Statistics Highlighting Key Priorities Of Service Topics PDF
The following slide illustrates statistics showcasing major priorities of service desk professionals. It provides information about automation, inbound calls, emails, first time fix rate, self service portal, service desk costs, etc. Deliver and pitch your topic in the best possible manner with this Improve IT Service Desk Statistics Highlighting Key Priorities Of Service Topics PDF. Use them to share invaluable insights on Service Managers, Ticket Management, Increasing Time and impress your audience. This template can be altered and modified as per your expectations. So, grab it now.
Building Quality Inspection Dashboard With Customer Satisfaction Ratio Icons PDF
The following slide showcases dashboard of construction company exhibiting quality KPIs regarding safety, workmanship and customer satisfaction. Key indicators covered are site inspection success level, CSR, defect count, net promoter score, promotors, passives, defectors, total rework cost, safety meetings and average time taken to fix defects. Showcasing this set of slides titled Building Quality Inspection Dashboard With Customer Satisfaction Ratio Icons PDF. The topics addressed in these templates are Construction Project, Customer Satisfaction Ratio, Promoters. All the content presented in this PPT design is completely editable. Download it and make adjustments in color, background, font etc. as per your unique business setting.
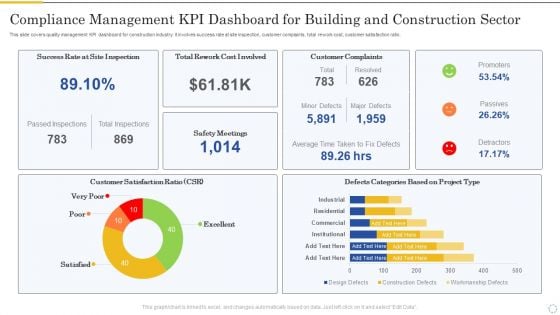
Compliance Management Kpi Dashboard For Building And Construction Sector Inspiration PDF
This slide covers quality management KPI dashboard for construction industry. It involves success rate at site inspection, customer complaints, total rework cost, customer satisfaction ratio. Pitch your topic with ease and precision using this Compliance Management Kpi Dashboard For Building And Construction Sector Inspiration PDF. This layout presents information on Customer Complaints, Customer Satisfaction, Safety Meetings. It is also available for immediate download and adjustment. So, changes can be made in the color, design, graphics or any other component to create a unique layout.
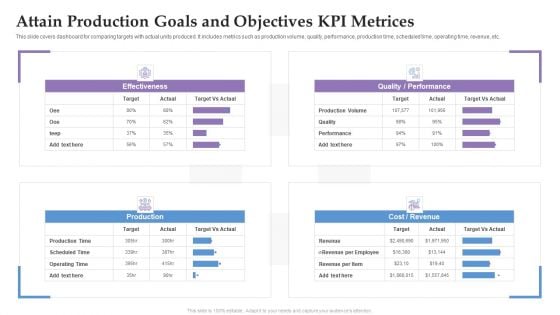
Attain Production Goals And Objectives KPI Metrices Ppt Summary Format Ideas PDF
This slide covers dashboard for comparing targets with actual units produced. It includes metrics such as production volume, quality, performance, production time, scheduled time, operating time, revenue, etc. Pitch your topic with ease and precision using this Attain Production Goals And Objectives KPI Metrices Ppt Summary Format Ideas PDF. This layout presents information on Production, Cost, Revenue, Performance. It is also available for immediate download and adjustment. So, changes can be made in the color, design, graphics or any other component to create a unique layout.
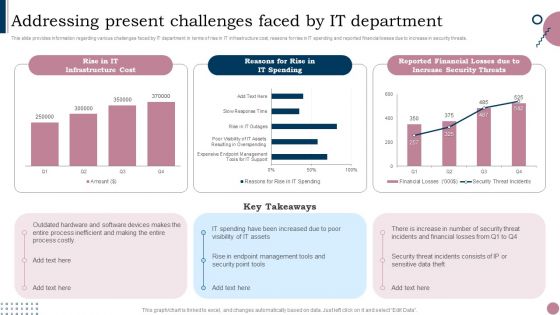
Cios Guide To Optimize Addressing Present Challenges Faced By IT Department Sample PDF
This slide provides information regarding various challenges faced by IT department in terms of rise in IT infrastructure cost, reasons for rise in IT spending and reported financial losses due to increase in security threats. There are so many reasons you need a Cios Guide To Optimize Addressing Present Challenges Faced By IT Department Sample PDF. The first reason is you cant spend time making everything from scratch, Thus, Slidegeeks has made presentation templates for you too. You can easily download these templates from our website easily.
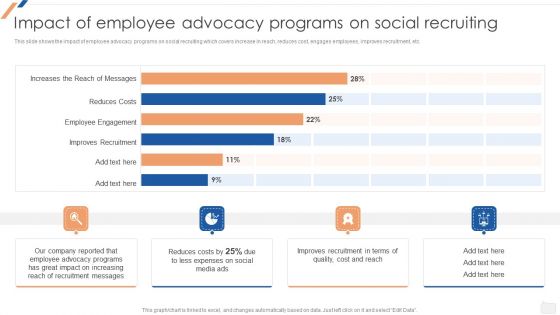
Impact Of Employee Advocacy Programs On Social Recruiting Enhancing Social Media Recruitment Process Elements PDF
This slide shows the impact of employee advocacy programs on social recruiting which covers increase in reach, reduces cost, engages employees, improves recruitment, etc.If your project calls for a presentation, then Slidegeeks is your go-to partner because we have professionally designed, easy-to-edit templates that are perfect for any presentation. After downloading, you can easily edit Impact Of Employee Advocacy Programs On Social Recruiting Enhancing Social Media Recruitment Process Elements PDF and make the changes accordingly. You can rearrange slides or fill them with different images. Check out all the handy templates.
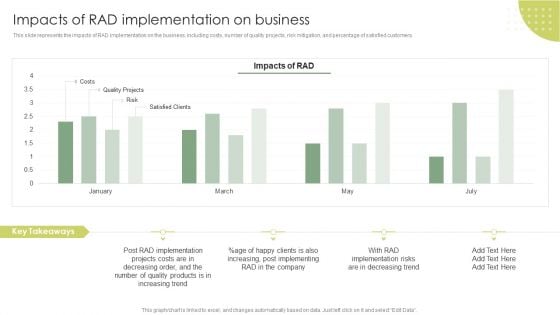
Impacts Of Rad Implementation On Business Rapid Application Building RAB Model Elements PDF
This slide represents the impacts of RAD implementation on the business, including costs, number of quality projects, risk mitigation, and percentage of satisfied customers.From laying roadmaps to briefing everything in detail, our templates are perfect for you. You can set the stage with your presentation slides. All you have to do is download these easy to edit and customizable templates. Impacts Of Rad Implementation On Business Rapid Application Building RAB Model Elements PDF will help you deliver an outstanding performance that everyone would remember and praise you for. Do download this presentation today.
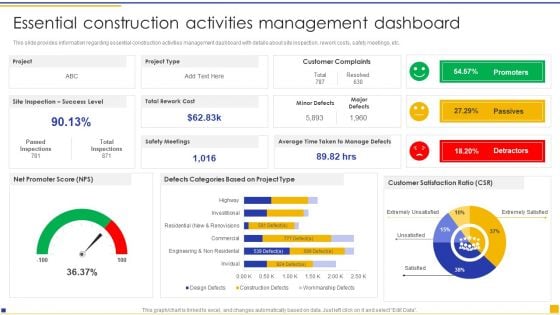
Construction Project Instructions Playbook Essential Construction Activities Management Dashboard Graphics PDF
This slide provides information regarding essential construction activities management dashboard with details about site inspection, rework costs, safety meetings, etc. Crafting an eye catching presentation has never been more straightforward. Let your presentation shine with this tasteful yet straightforward Construction Project Instructions Playbook Essential Construction Activities Management Dashboard Graphics PDF template. It offers a minimalistic and classy look that is great for making a statement. The colors have been employed intelligently to add a bit of playfulness while still remaining professional. Construct the ideal Construction Project Instructions Playbook Essential Construction Activities Management Dashboard Graphics PDF that effortlessly grabs the attention of your audience Begin now and be certain to wow your customers.
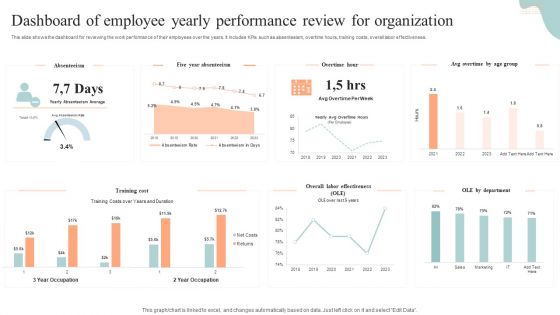
Dashboard Of Employee Yearly Performance Review For Organization Mockup PDF
This slide shows the dashboard for reviewing the work performance of their employees over the years. It includes KPIs such as absenteeism, overtime hours, training costs, overall labor effectiveness. Showcasing this set of slides titled Dashboard Of Employee Yearly Performance Review For Organization Mockup PDF. The topics addressed in these templates are Dashboard Of Employee, Yearly Performance, Review For Organization. All the content presented in this PPT design is completely editable. Download it and make adjustments in color, background, font etc. as per your unique business setting.
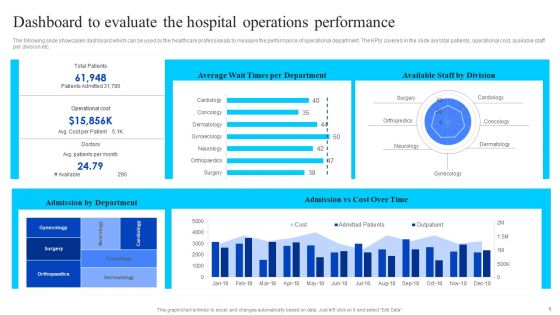
Healthcare Management Overview Trends Stats And Operational Areas Dashboard To Evaluate The Hospital Operations Performance Pictures PDF
The following slide showcases dashboard which can be used by the healthcare professionals to measure the performance of operational department. The KPIs covered in the slide are total patients, operational cost, available staff per division etc. There are so many reasons you need a Healthcare Management Overview Trends Stats And Operational Areas Dashboard To Evaluate The Hospital Operations Performance Pictures PDF. The first reason is you can not spend time making everything from scratch, Thus, Slidegeeks has made presentation templates for you too. You can easily download these templates from our website easily.
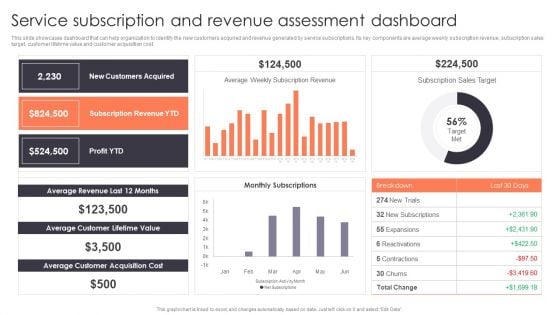
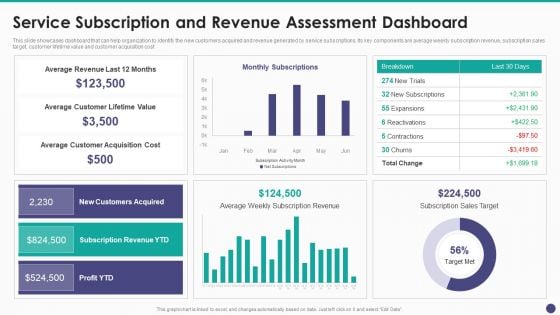
Promotion Strategies For New Service Launch Service Subscription And Revenue Assessment Dashboard Mockup PDF
This slide showcases dashboard that can help organization to identify the new customers acquired and revenue generated by service subscriptions. Its key components are average weekly subscription revenue, subscription sales target, customer lifetime value and customer acquisition cost. There are so many reasons you need a Promotion Strategies For New Service Launch Service Subscription And Revenue Assessment Dashboard Mockup PDF. The first reason is you can not spend time making everything from scratch, Thus, Slidegeeks has made presentation templates for you too. You can easily download these templates from our website easily.
Staff Awareness Playbook Determine Workforce Training Performance Tracking Dashboard Slides PDF
This slide provides information regarding workforce training performance tracking dashboard with training cost, number of participants, hours of training, etc. This Staff Awareness Playbook Determine Workforce Training Performance Tracking Dashboard Slides PDF from Slidegeeks makes it easy to present information on your topic with precision. It provides customization options, so you can make changes to the colors, design, graphics, or any other component to create a unique layout. It is also available for immediate download, so you can begin using it right away. Slidegeeks has done good research to ensure that you have everything you need to make your presentation stand out. Make a name out there for a brilliant performance.
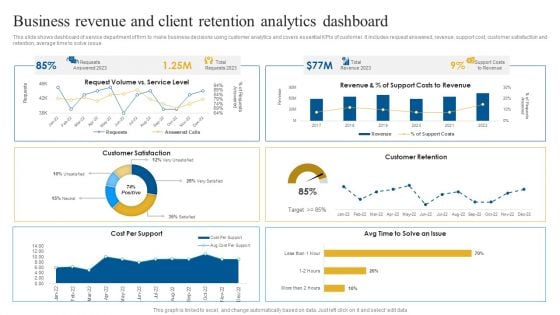
Business Revenue And Client Retention Analytics Dashboard Brochure PDF
This slide shows dashboard of service department of firm to make business decisions using customer analytics and covers essential KPIs of customer. It includes request answered, revenue, support cost, customer satisfaction and retention, average time to solve issue. Showcasing this set of slides titled Business Revenue And Client Retention Analytics Dashboard Brochure PDF. The topics addressed in these templates are Customer Satisfaction, Customer Retention, Revenue. All the content presented in this PPT design is completely editable. Download it and make adjustments in color, background, font etc. as per your unique business setting.
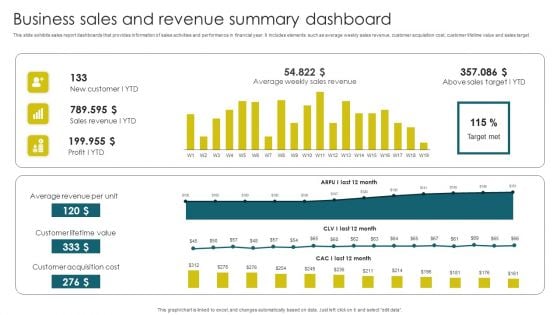
Business Sales And Revenue Summary Dashboard Brochure PDF
This slide exhibits sales report dashboards that provides information of sales activities and performance in financial year. It includes elements such as average weekly sales revenue, customer acquisition cost, customer lifetime value and sales target. Pitch your topic with ease and precision using this Business Sales And Revenue Summary Dashboard Brochure PDF. This layout presents information on Average Revenue, Customer Lifetime, Customer Acquisition. It is also available for immediate download and adjustment. So, changes can be made in the color, design, graphics or any other component to create a unique layout.
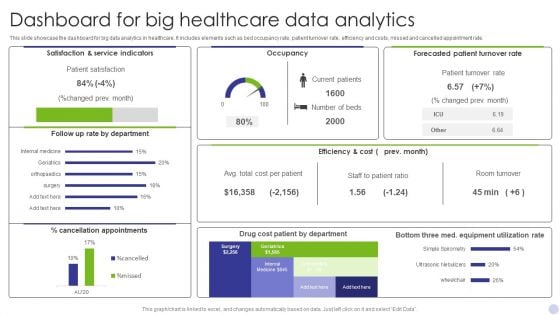
Dashboard For Big Healthcare Data Analytics Graphics PDF
This slide showcase the dashboard for big data analytics in healthcare. It includes elements such as bed occupancy rate, patient turnover rate, efficiency and costs, missed and cancelled appointment rate. Showcasing this set of slides titled Dashboard For Big Healthcare Data Analytics Graphics PDF. The topics addressed in these templates are Satisfaction Service Indicators, Occupancy, Forecasted Patient Turnover. All the content presented in this PPT design is completely editable. Download it and make adjustments in color, background, font etc. as per your unique business setting.
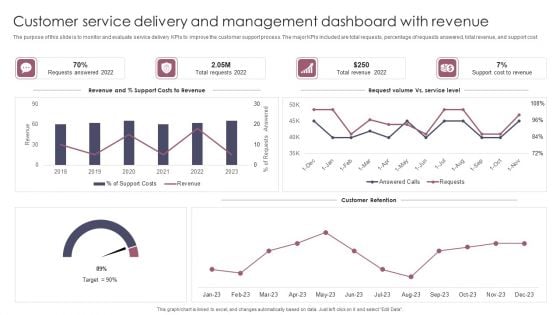
Customer Service Delivery And Management Dashboard With Revenue Brochure PDF
The purpose of this slide is to monitor and evaluate service delivery KPIs to improve the customer support process. The major KPIs included are total requests, percentage of requests answered, total revenue, and support cost. Pitch your topic with ease and precision using this Customer Service Delivery And Management Dashboard With Revenue Brochure PDF. This layout presents information on Customer Service Delivery, Management Dashboard With Revenue. It is also available for immediate download and adjustment. So, changes can be made in the color, design, graphics or any other component to create a unique layout.
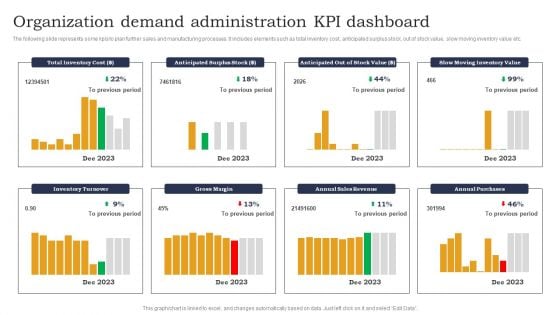
Organization Demand Administration KPI Dashboard Designs PDF
The following slide represents some kpis to plan further sales and manufacturing processes. It includes elements such as total inventory cost, anticipated surplus stock, out of stock value, slow moving inventory value etc. Pitch your topic with ease and precision using this Organization Demand Administration KPI Dashboard Designs PDF. This layout presents information on Anticipated Surplus Stock, Out Of Stock, Slow Moving Inventory. It is also available for immediate download and adjustment. So, changes can be made in the color, design, graphics or any other component to create a unique layout.
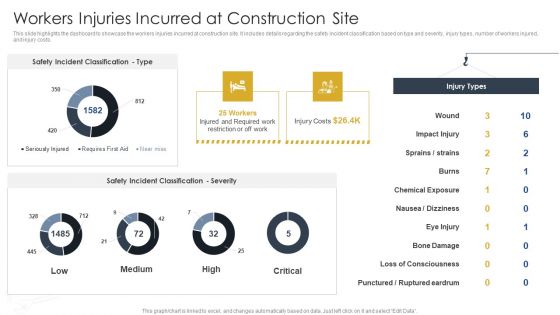
Workers Injuries Incurred At Construction Site Construction Site Safety Plan Introduction PDF
This slide highlights the dashboard to showcase the workers injuries incurred at construction site. It includes details regarding the safety incident classification based on type and severity, injury types, number of workers injured, and injury costs. Find a pre-designed and impeccable Workers Injuries Incurred At Construction Site Construction Site Safety Plan Introduction PDF. The templates can ace your presentation without additional effort. You can download these easy-to-edit presentation templates to make your presentation stand out from others. So, what are you waiting for Download the template from Slidegeeks today and give a unique touch to your presentation.
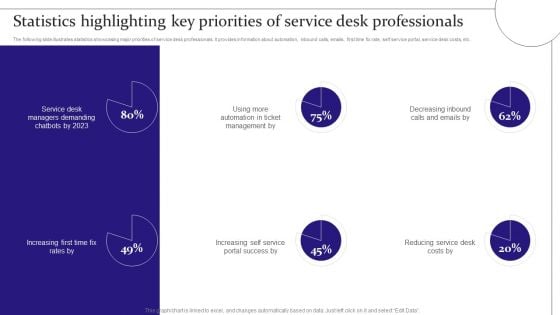
Digitalization Of Service Desk Statistics Highlighting Key Priorities Of Service Desk Professionals Ppt Gallery Grid PDF
The following slide illustrates statistics showcasing major priorities of service desk professionals. It provides information about automation, inbound calls, emails, first time fix rate, self service portal, service desk costs, etc. Take your projects to the next level with our ultimate collection of Digitalization Of Service Desk Statistics Highlighting Key Priorities Of Service Desk Professionals Ppt Gallery Grid PDF. Slidegeeks has designed a range of layouts that are perfect for representing task or activity duration, keeping track of all your deadlines at a glance. Tailor these designs to your exact needs and give them a truly corporate look with your own brand colors they will make your projects stand out from the rest.
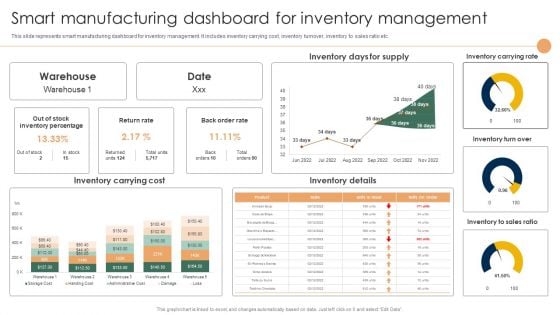
Smart Manufacturing Deployment Improve Production Procedures Smart Manufacturing Dashboard Summary PDF
This slide represents smart manufacturing dashboard for inventory management. It includes inventory carrying cost, inventory turnover, inventory to sales ratio etc.Slidegeeks has constructed Smart Manufacturing Deployment Improve Production Procedures Smart Manufacturing Dashboard Summary PDF after conducting extensive research and examination. These presentation templates are constantly being generated and modified based on user preferences and critiques from editors. Here, you will find the most attractive templates for a range of purposes while taking into account ratings and remarks from users regarding the content. This is an excellent jumping-off point to explore our content and will give new users an insight into our top-notch PowerPoint Templates.
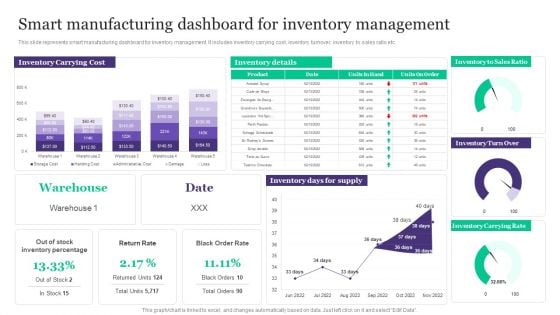
Deployment Of Automated Production Technology Smart Manufacturing Dashboard For Inventory Management Brochure PDF
This slide represents smart manufacturing dashboard for inventory management. It includes inventory carrying cost, inventory turnover, inventory to sales ratio etc.Welcome to our selection of the Deployment Of Automated Production Technology Smart Manufacturing Dashboard For Inventory Management Brochure PDF. These are designed to help you showcase your creativity and bring your sphere to life. Planning and Innovation are essential for any business that is just starting out. This collection contains the designs that you need for your everyday presentations. All of our PowerPoints are 100 precent editable, so you can customize them to suit your needs. This multi-purpose template can be used in various situations. Grab these presentation templates today.
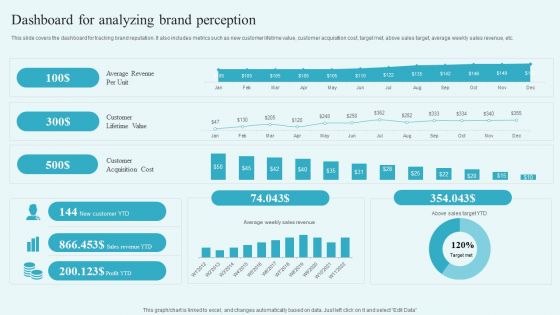
Dashboard For Analyzing Brand Perception Building A Comprehensive Brand Elements PDF
This slide covers the dashboard for tracking brand reputation. It also includes metrics such as new customer lifetime value, customer acquisition cost, target met, above sales target, average weekly sales revenue, etc. Find a pre-designed and impeccable Dashboard For Analyzing Brand Perception Building A Comprehensive Brand Elements PDF. The templates can ace your presentation without additional effort. You can download these easy-to-edit presentation templates to make your presentation stand out from others. So, what are you waiting for Download the template from Slidegeeks today and give a unique touch to your presentation.
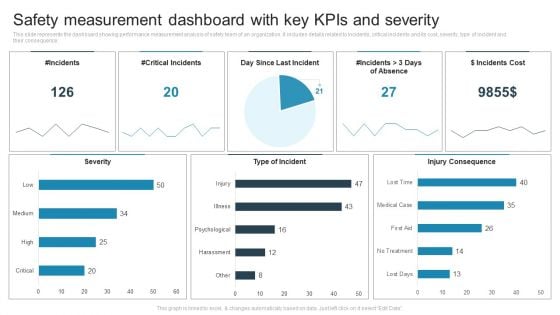
Safety Measurement Dashboard With Key Kpis And Severity Sample PDF
This slide represents the dashboard showing performance measurement analysis of safety team of an organization. It includes details related to incidents, critical incidents and its cost, severity, type of incident and their consequence. Showcasing this set of slides titled Safety Measurement Dashboard With Key Kpis And Severity Sample PDF. The topics addressed in these templates are Incidents, Critical Incidents, Day Since Last Incident. All the content presented in this PPT design is completely editable. Download it and make adjustments in color, background, font etc. as per your unique business setting.
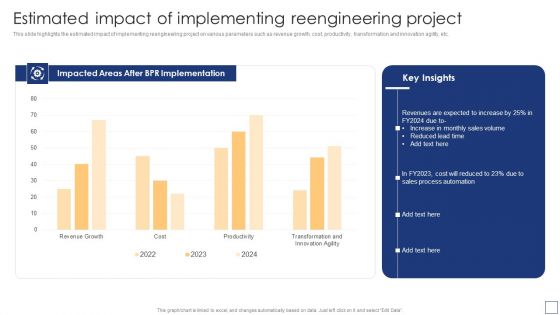
Business Process Redesigning Estimated Impact Of Implementing Reengineering Project Inspiration PDF
This slide highlights the estimated impact of implementing reengineering project on various parameters such as revenue growth, cost, productivity, transformation and innovation agility, etc. Get a simple yet stunning designed Business Process Redesigning Estimated Impact Of Implementing Reengineering Project Inspiration PDF. It is the best one to establish the tone in your meetings. It is an excellent way to make your presentations highly effective. So, download this PPT today from Slidegeeks and see the positive impacts. Our easy-to-edit Business Process Redesigning Estimated Impact Of Implementing Reengineering Project Inspiration PDF can be your go-to option for all upcoming conferences and meetings. So, what are you waiting for Grab this template today.
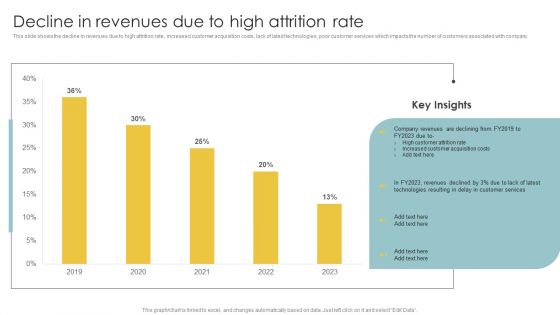
Implementing CRM To Optimize Decline In Revenues Due To High Attrition Rate Sample PDF
This slide shows the decline in revenues due to high attrition rate, increased customer acquisition costs, lack of latest technologies, poor customer services which impacts the number of customers associated with company. Want to ace your presentation in front of a live audience Our Implementing CRM To Optimize Decline In Revenues Due To High Attrition Rate Sample PDF can help you do that by engaging all the users towards you. Slidegeeks experts have put their efforts and expertise into creating these impeccable powerpoint presentations so that you can communicate your ideas clearly. Moreover, all the templates are customizable, and easy-to-edit and downloadable. Use these for both personal and commercial use.
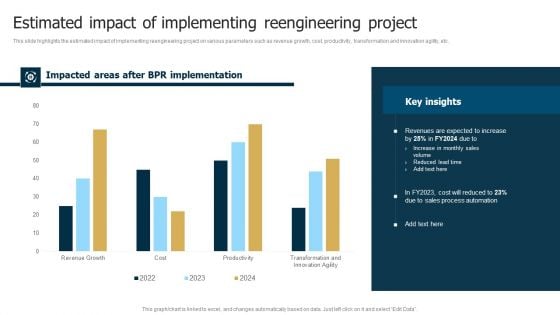
Business Restructuring Process Estimated Impact Of Implementing Reengineering Microsoft PDF
This slide highlights the estimated impact of implementing reengineering project on various parameters such as revenue growth, cost, productivity, transformation and innovation agility, etc. Get a simple yet stunning designed Business Restructuring Process Estimated Impact Of Implementing Reengineering Microsoft PDF. It is the best one to establish the tone in your meetings. It is an excellent way to make your presentations highly effective. So, download this PPT today from Slidegeeks and see the positive impacts. Our easy-to-edit Business Restructuring Process Estimated Impact Of Implementing Reengineering Microsoft PDF can be your go-to option for all upcoming conferences and meetings. So, what are you waiting for Grab this template today.

Inventory Overview Dashboard In Supply Chain Management To Enhance Logistics Operations Summary PDF
This slide showcases the inventory management dashboard. It include KPIs such as inventory value, re-order products, restocking cost, inventory value by vendor, item name, last order date, warehouse, etc. Showcasing this set of slides titled Inventory Overview Dashboard In Supply Chain Management To Enhance Logistics Operations Summary PDF. The topics addressed in these templates are Inventory Overview Dashboard, Supply Chain Management, Enhance Logistics Operations. All the content presented in this PPT design is completely editable. Download it and make adjustments in color, background, font etc. as per your unique business setting.
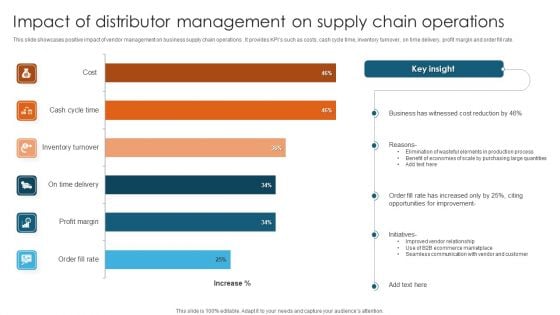
Impact Of Distributor Management On Supply Chain Operations Brochure PDF
This slide showcases positive impact of vendor management on business supply chain operations . It provides KPIs such as costs, cash cycle time, inventory turnover, on time delivery, profit margin and order fill rate.Showcasing this set of slides titled Impact Of Distributor Management On Supply Chain Operations Brochure PDF. The topics addressed in these templates are Business Witnessed, Elimination Wasteful, Opportunities Improvement. All the content presented in this PPT design is completely editable. Download it and make adjustments in color, background, font etc. as per your unique business setting.
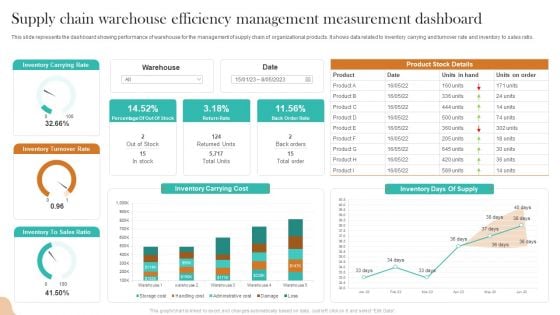
Supply Chain Warehouse Efficiency Management Measurement Dashboard Inspiration PDF
This slide represents the dashboard showing performance of warehouse for the management of supply chain of organizational products. It shows data related to inventory carrying and turnover rate and inventory to sales ratio. Pitch your topic with ease and precision using this Supply Chain Warehouse Efficiency Management Measurement Dashboard Inspiration PDF. This layout presents information on Inventory Carrying Rate, Inventory Turnover Rate, Inventory Carrying Cost. It is also available for immediate download and adjustment. So, changes can be made in the color, design, graphics or any other component to create a unique layout.
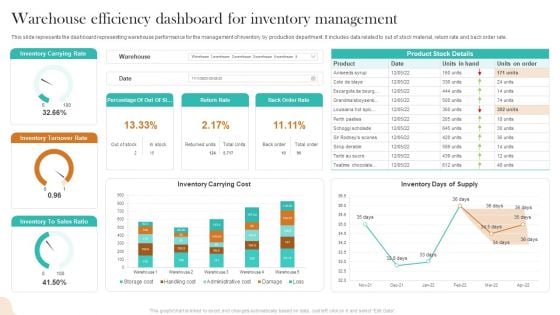
Warehouse Efficiency Dashboard For Inventory Management Infographics PDF
This slide represents the dashboard representing warehouse performance for the management of inventory by production department. It includes data related to out of stock material, return rate and back order rate. Showcasing this set of slides titled Warehouse Efficiency Dashboard For Inventory Management Infographics PDF. The topics addressed in these templates are Inventory Carrying Rate, Inventory Turnover Rate, Inventory Carrying Cost. All the content presented in this PPT design is completely editable. Download it and make adjustments in color, background, font etc. as per your unique business setting.
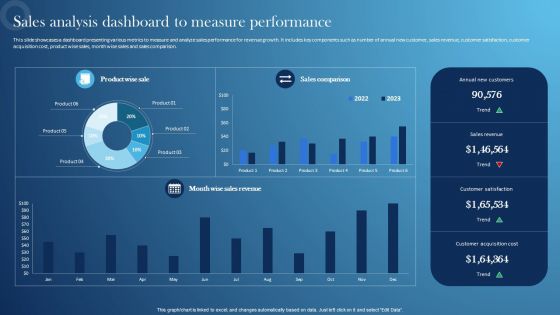
Inspecting Sales Optimization Areas Sales Analysis Dashboard To Measure Performance Demonstration PDF
This slide showcases a dashboard presenting various metrics to measure and analyze sales performance for revenue growth. It includes key components such as number of annual new customer, sales revenue, customer satisfaction, customer acquisition cost, product wise sales, month wise sales and sales comparison. From laying roadmaps to briefing everything in detail, our templates are perfect for you. You can set the stage with your presentation slides. All you have to do is download these easy-to-edit and customizable templates. Inspecting Sales Optimization Areas Sales Analysis Dashboard To Measure Performance Demonstration PDF will help you deliver an outstanding performance that everyone would remember and praise you for. Do download this presentation today.
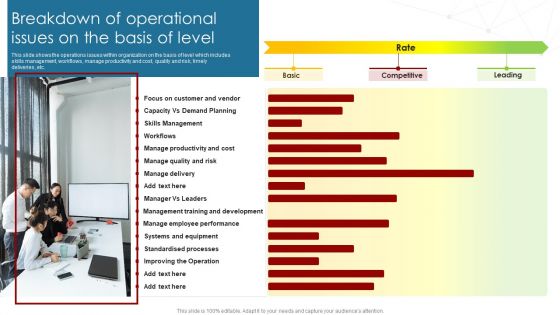
Deployment Of Business Process Breakdown Of Operational Issues On The Basis Pictures PDF
This slide shows the operations issues within organization on the basis of level which includes skills management, workflows, manage productivity and cost, quality and risk, timely deliveries, etc. Find a pre-designed and impeccable Deployment Of Business Process Breakdown Of Operational Issues On The Basis Pictures PDF. The templates can ace your presentation without additional effort. You can download these easy-to-edit presentation templates to make your presentation stand out from others. So, what are you waiting for Download the template from Slidegeeks today and give a unique touch to your presentation.
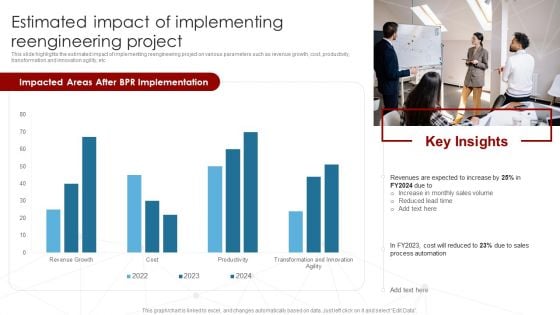
Deployment Of Business Process Estimated Impact Of Implementing Reengineering Diagrams PDF
This slide highlights the estimated impact of implementing reengineering project on various parameters such as revenue growth, cost, productivity, transformation and innovation agility, etc. Present like a pro with Deployment Of Business Process Estimated Impact Of Implementing Reengineering Diagrams PDF Create beautiful presentations together with your team, using our easy-to-use presentation slides. Share your ideas in real-time and make changes on the fly by downloading our templates. So whether youre in the office, on the go, or in a remote location, you can stay in sync with your team and present your ideas with confidence. With Slidegeeks presentation got a whole lot easier. Grab these presentations today.
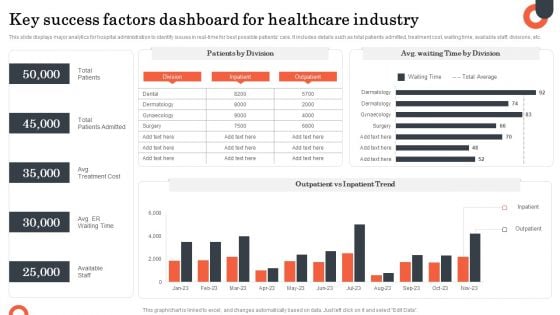
Key Success Factors Dashboard For Healthcare Industry Diagrams PDF
This slide displays major analytics for hospital administration to identify issues in real-time for best possible patients care. It includes details such as total patients admitted, treatment cost, waiting time, available staff, divisions, etc. Showcasing this set of slides titled Key Success Factors Dashboard For Healthcare Industry Diagrams PDF. The topics addressed in these templates are Success Factors, Total Patients, Total Patients Admitted, Available Staff. All the content presented in this PPT design is completely editable. Download it and make adjustments in color, background, font etc. as per your unique business setting.
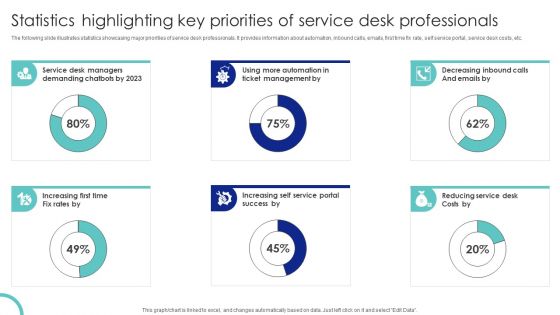
Statistics Highlighting Key Priorities Of Service Desk Professionals Ppt PowerPoint Presentation Diagram PDF
The following slide illustrates statistics showcasing major priorities of service desk professionals. It provides information about automation, inbound calls, emails, first time fix rate, self service portal, service desk costs, etc. If your project calls for a presentation, then Slidegeeks is your go to partner because we have professionally designed, easy to edit templates that are perfect for any presentation. After downloading, you can easily edit Statistics Highlighting Key Priorities Of Service Desk Professionals Ppt PowerPoint Presentation Diagram PDF and make the changes accordingly. You can rearrange slides or fill them with different images. Check out all the handy templates.
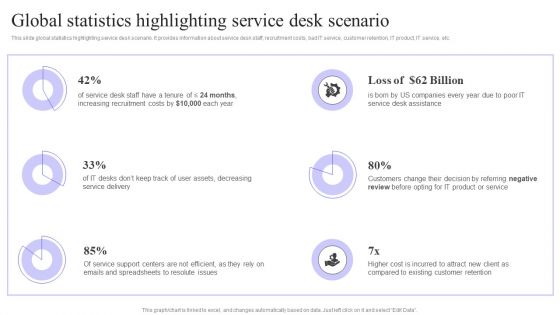
Global Statistics Highlighting Service Desk Scenario Pictures PDF
This slide global statistics highlighting service desk scenario. It provides information about service desk staff, recruitment costs, bad IT service, customer retention, IT product, IT service, etc. From laying roadmaps to briefing everything in detail, our templates are perfect for you. You can set the stage with your presentation slides. All you have to do is download these easy to edit and customizable templates. Global Statistics Highlighting Service Desk Scenario Pictures PDF will help you deliver an outstanding performance that everyone would remember and praise you for. Do download this presentation today.
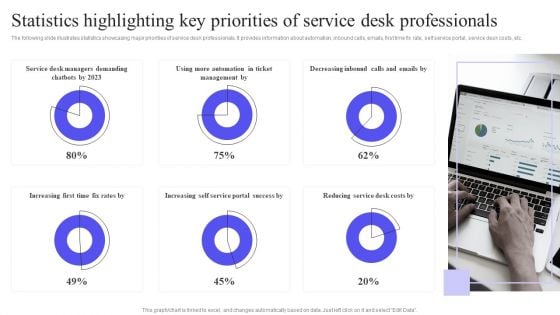
Statistics Highlighting Key Priorities Of Service Desk Professionals Graphics PDF
The following slide illustrates statistics showcasing major priorities of service desk professionals. It provides information about automation, inbound calls, emails, first time fix rate, self service portal, service desk costs, etc. If your project calls for a presentation, then Slidegeeks is your go to partner because we have professionally designed, easy to edit templates that are perfect for any presentation. After downloading, you can easily edit Statistics Highlighting Key Priorities Of Service Desk Professionals Graphics PDF and make the changes accordingly. You can rearrange slides or fill them with different images. Check out all the handy templates.


 Continue with Email

 Home
Home


