Curve

Editable Bell Curve PowerPoint Templates Statistical Curve Ppt Slides
Editable Bell Curve PowerPoint templates Statistical Curve PPT Slides-These high quality, editable pre-designed powerpoint slides have been carefully created by our professional team to help you impress your audience. Each graphic in every slide is vector based and is 100% editable in powerpoint. Each and every property of any slide - color, size, shading etc can be modified to build an effective powerpoint presentation. Use these slides to convey complex business concepts in a simplified manner. Any text can be entered at any point in the powerpoint slide. Simply DOWNLOAD, TYPE and PRESENT! Dwell on your argument with our Editable Bell Curve PowerPoint Templates Statistical Curve Ppt Slides. Your audience will see eye to eye with you.
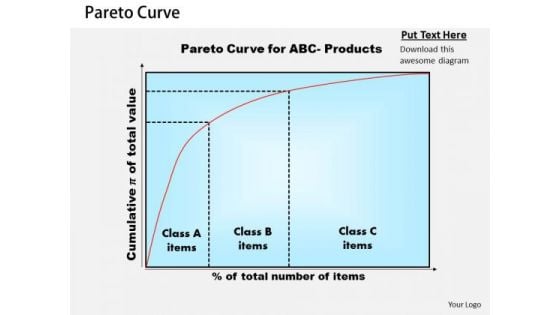
Pareto Curve Business PowerPoint Presentation
Make Some Dough With Our Pareto Curve Business Powerpoint Presentation Powerpoint Templates. Your Assets Will Rise Significantly.
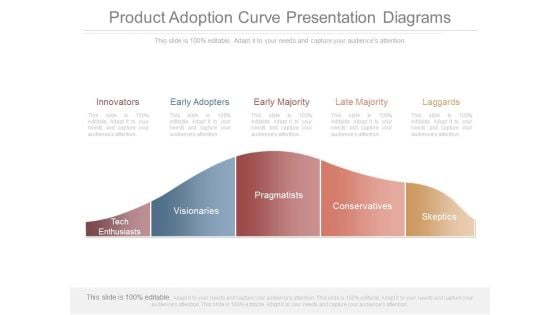
Product Adoption Curve Presentation Diagrams
This is a product adoption curve presentation diagrams. This is a five stage process. The stages in this process are innovators, early adopters, early majority, late majority, laggards, tech enthusiasts, visionaries, pragmatists, conservatives, skeptics.
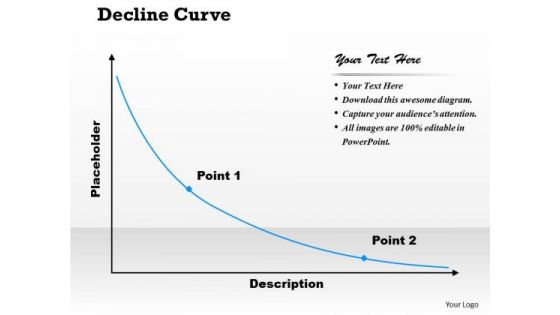
Decline Curve PowerPoint Presentation Template
Double Your Chances With Our Decline Curve PowerPoint Presentation Template Powerpoint Templates. The Value Of Your Thoughts Will Increase Two-Fold. Charm The Audience With Your Thoughts. Add Our Business Process Powerpoint Templates And They Will Be Dotty For You.
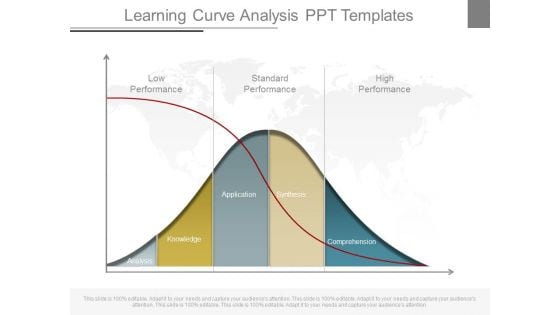
Learning Curve Analysis Ppt Templates
This is a learning curve analysis ppt templates. This is a five stage process. The stages in this process are low performance, standard performance, high performance, analysis, knowledge, application, synthesis, comprehension.\n\n\n\n\n\n
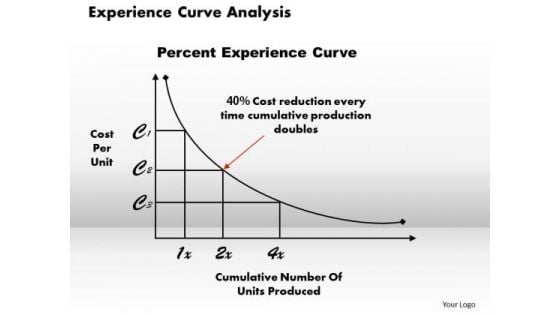
Experience Curve Analysis Business PowerPoint Presentation
Draw Out The Best In You With Our Experience Curve Analysis Business Powerpoint Presentation Powerpoint Templates. Let Your Inner Brilliance Come To The Surface.
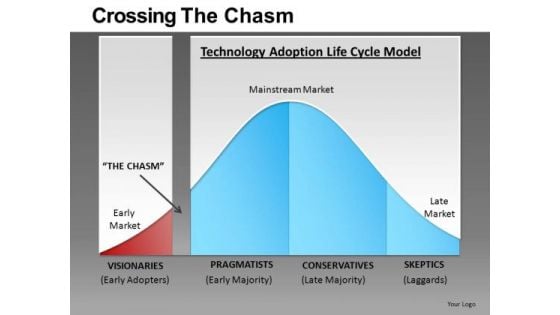
Crossing The Chasm Bell Curve PowerPoint Templates
Crossing the Chasm Bell Curve PowerPoint templates-These high quality powerpoint pre-designed slides and powerpoint templates have been carefully created by our professional team to help you impress your audience. All slides have been created and are 100% editable in powerpoint. Each and every property of any graphic - color, size, orientation, shading, outline etc. can be modified to help you build an effective powerpoint presentation. Any text can be entered at any point in the powerpoint template or slide. Simply DOWNLOAD, TYPE and PRESENT! Experience exponential.growth with our Crossing The Chasm Bell Curve PowerPoint Templates. Your earnings will acquire a big boost.
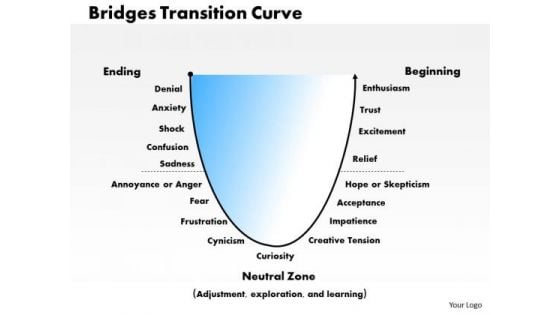
Business Framework Bridges Transition Curve PowerPoint Presentation
This power point diagram slide has been crafted with bridges transition curve with multiple points. This curve displays the each stage of transition but not focus on change. Use this PPT slide for sales and business presentations.
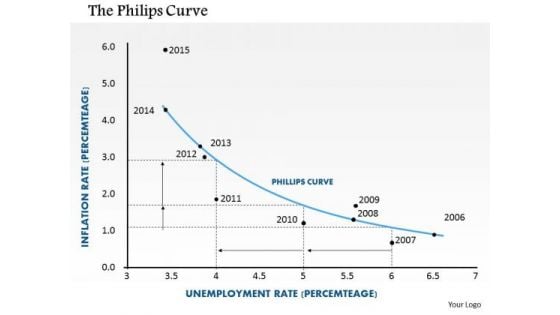
Business Framework The Philips Curve PowerPoint Presentation
Our above diagram displays framework of Philips curve. This Phillips curve represents the relationship between the rate of inflation and the unemployment rate. Use this professional and customized business diagram in your marketing presentations.
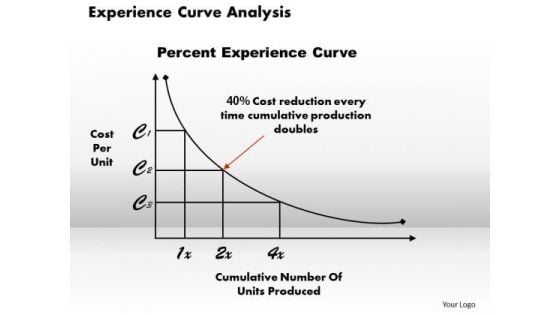
Business Framework Experience Curve Analysis PowerPoint Presentation
A two way linear curve has been used to design this PPT diagram. This business framework contains the concept of curve analysis and management. Use this PPT diagram for your business and management related topics.
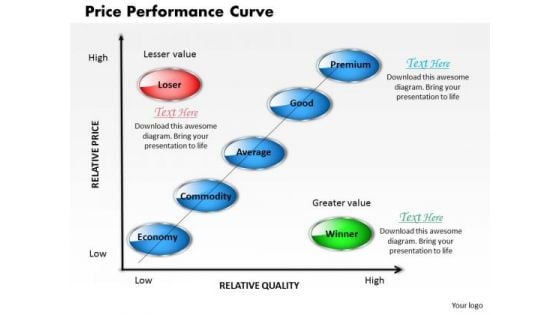
Price Performance Curve Business PowerPoint Presentation
Draw It Out On Our Price Performance Curve Business Powerpoint Presentation Powerpoint Templates. Provide Inspiration To Your Colleagues.
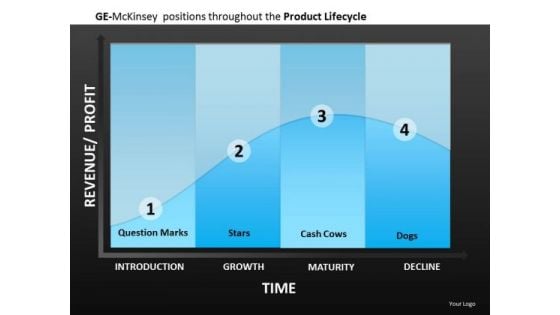
Ge Mckinsey Matrix Statistical Curve PowerPoint Templates
GE McKinsey Matrix Statistical Curve PowerPoint templates-These high quality, editable pre-designed powerpoint slides have been carefully created by our professional team to help you impress your audience. Each graphic in every slide is vector based and is 100% editable in powerpoint. Each and every property of any slide - color, size, shading etc can be modified to build an effective powerpoint presentation. Use these slides to convey complex business concepts in a simplified manner. Any text can be entered at any point in the powerpoint slide. Simply DOWNLOAD, TYPE and PRESENT! Acquire the aura of a champion. Enhance your charisma with our Ge Mckinsey Matrix Statistical Curve PowerPoint Templates.
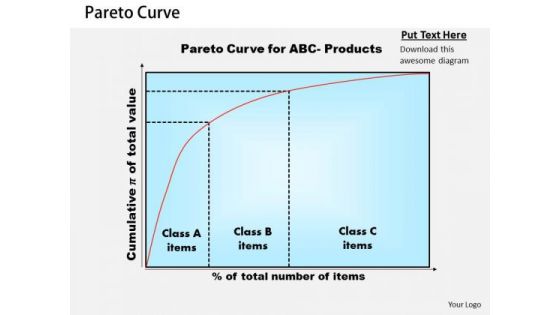
Business Diagram Pareto Curve PowerPoint Ppt Presentation
Deliver The Right Dose With Our Business Diagram Pareto Curve PowerPoint PPT Presentation PowerPoint Templates. Your Ideas Will Get The Correct Illumination.
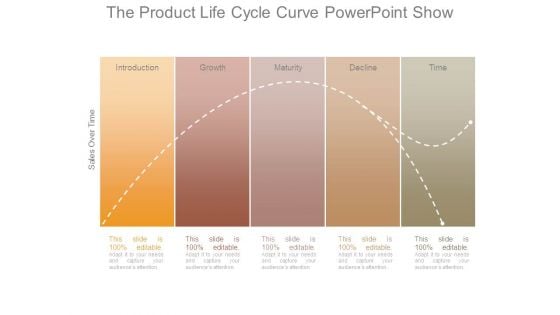
The Product Life Cycle Curve Powerpoint Show
This is a the product life cycle curve powerpoint show. This is a five stage process. The stages in this process are introduction, growth, maturity, decline, time.
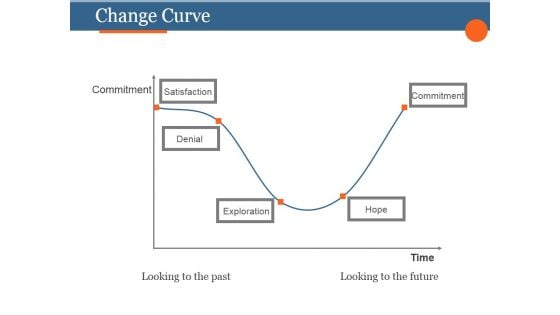
Change Curve Ppt PowerPoint Presentation Templates
This is a change curve ppt powerpoint presentation templates. This is a five stage process. The stages in this process are satisfaction, denial, exploration, commitment, hope.

Change Curve Ppt PowerPoint Presentation Background Designs
This is a change curve ppt powerpoint presentation background designs. This is a five stage process. The stages in this process are satisfaction, denial, exploration, hope, commitment.

Adoption Curve Ppt PowerPoint Presentation Clipart
This is a adoption curve ppt powerpoint presentation clipart. This is a five stage process. The stages in this process are innovators, early adopters, early majority, late majority, laggards.
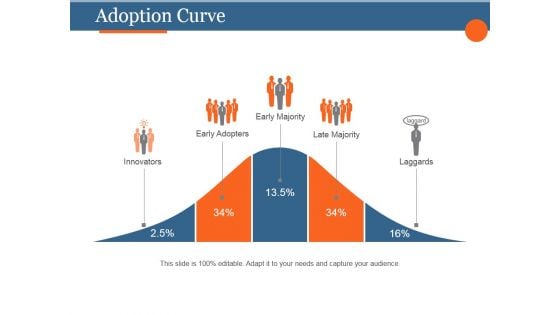
Adoption Curve Ppt PowerPoint Presentation Visual Aids
This is a adoption curve ppt powerpoint presentation visual aids. This is a five stage process. The stages in this process are innovators, early adopters, early majority, late majority, laggards.
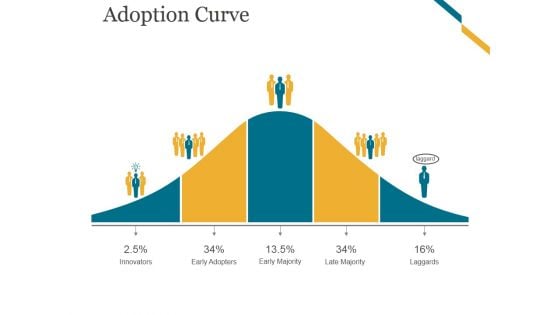
Adoption Curve Ppt PowerPoint Presentation Designs
This is a adoption curve ppt powerpoint presentation designs. This is a five stage process. The stages in this process are innovators, early adopters, early majority, late majority, laggards.
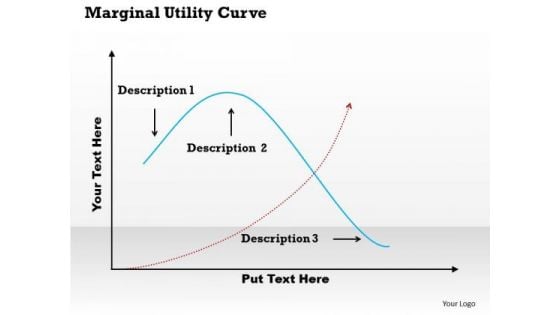
Marginal Utility Curve PowerPoint Presentation Template
Make Some Dough With Our Marginal Utility Curve PowerPoint Presentation Template Powerpoint Templates. Your Assets Will Rise Significantly. Your Approach Is Truly Down To Earth. Our Practical Business Process Powerpoint Templates Are Apt For You.
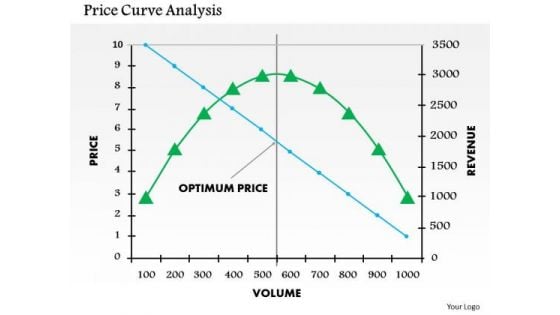
Business Framework Price Curve Analysis PowerPoint Presentation
This image slide displays price curve analysis business framework. Use this image slide in business and marketing presentations to depict analyses of market research. This image slide will enhance the quality of your presentations.

Business Framework Price Performance Curve PowerPoint Presentation
This image slide displays price performance curve business framework. Use this image slide in business and marketing presentations to depict analyses of market research. This image slide will enhance the quality of your presentations.
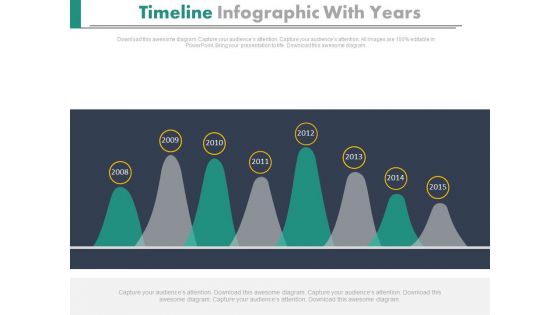
Timeline Curve Diagram With Years Powerpoint Slides
Our above PowerPoint template displays timeline curve diagram. This Linear timeline template can be used for multiple purposes including event planning, new milestones and tasks. Download this PowerPoint timeline template to make impressive presentations.
Curve Line Diagram With Icons Powerpoint Template
Our above slide contains diagram of curve line infographic. This infographic slide helps to exhibit business analysis. Use this diagram to impart more clarity to data and to create more sound impact on viewers.
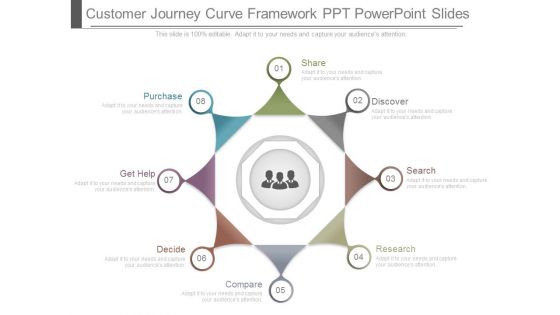
Customer Journey Curve Framework Ppt Powerpoint Slides
This is a customer journey curve framework ppt powerpoint slides. This is a eight stage process. The stages in this process are share, discover, search, research, compare, decide, get help, purchase.
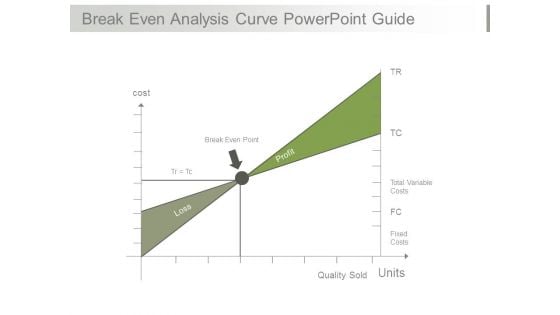
Break Even Analysis Curve Powerpoint Guide
This is a break even analysis curve powerpoint guide. This is a one stage process. The stages in this process are cost, break even point, loss, profit, total variable costs, fixed costs, quality sold, units.
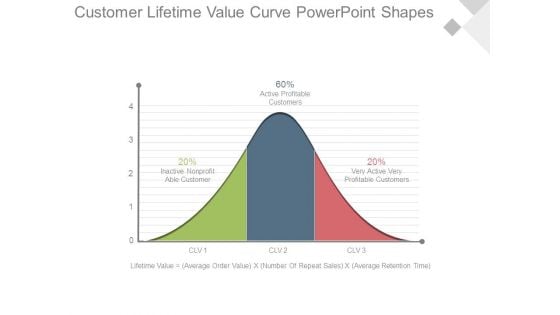
Customer Lifetime Value Curve Powerpoint Shapes
This is a customer lifetime value curve powerpoint shapes. This is a three stage process. The stages in this process are 20 percent inactive non profitable customer, 60 percent active profitable customers, 20 percent very active very profitable customers, clv.
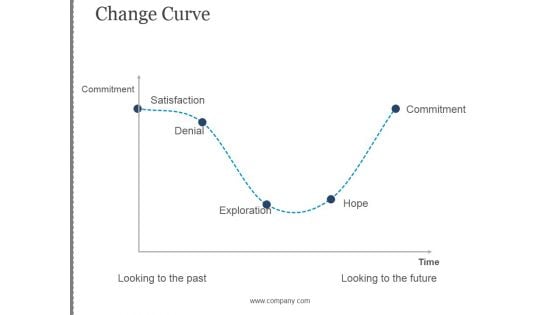
Change Curve Ppt PowerPoint Presentation Backgrounds
This is a change curve ppt powerpoint presentation backgrounds. This is a five stage process. The stages in this process are commitment, satisfaction, denial , exploration, commitment, hope, looking to the past, looking to the, future.

Commodity Adoption Technique Curve Model Graphics PDF
This slide showcases a curve model of product adoption to classify entry of users into various segments based on willingness to adopt innovation. It includes segments like innovators, early adopters, early majority, late ,majority and laggards. Showcasing this set of slides titled Commodity Adoption Technique Curve Model Graphics PDF. The topics addressed in these templates are Early Majority, Early Adopters, Late Majority. All the content presented in this PPT design is completely editable. Download it and make adjustments in color, background, font etc. as per your unique business setting.
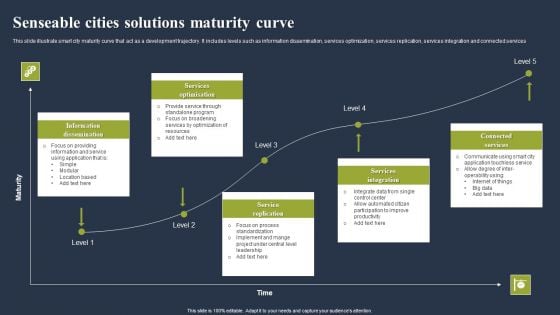
Senseable Cities Solutions Maturity Curve Information PDF
This slide illustrate smart city maturity curve that act as a development trajectory. It includes levels such as information dissemination, services optimization, services replication, services integration and connected services. Persuade your audience using this Senseable Cities Solutions Maturity Curve Information PDF. This PPT design covers Five stages, thus making it a great tool to use. It also caters to a variety of topics including Information Dissemination, Services Optimization, Service Replication. Download this PPT design now to present a convincing pitch that not only emphasizes the topic but also showcases your presentation skills.
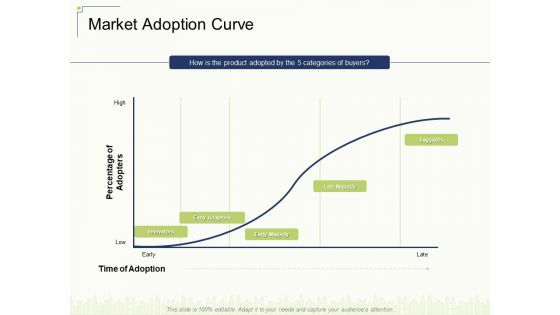
Market Adoption Curve Ppt Pictures Rules V
Deliver and pitch your topic in the best possible manner with this market adoption curve ppt pictures rules v. Use them to share invaluable insights on buyers, percentage, time, adaptors, innovators and impress your audience. This template can be altered and modified as per your expectations. So, grab it now.
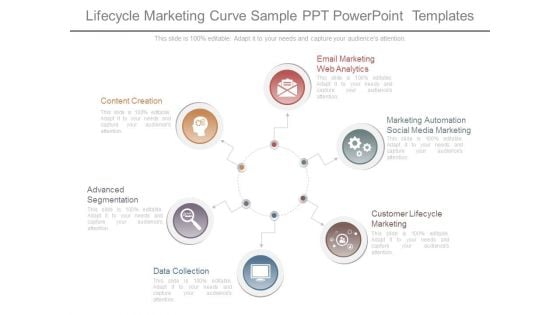
Lifecycle Marketing Curve Sample Ppt Powerpoint Templates
This is a lifecycle marketing curve sample ppt powerpoint templates. This is a six stage process. The stages in this process are content creation, advanced segmentation, data collection , customer lifecycle marketing , marketing automation social media marketing, email marketing web analytics.
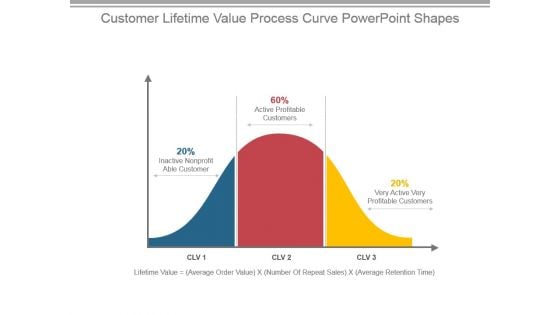
Customer Lifetime Value Process Curve Powerpoint Shapes
This is a customer lifetime value process curve powerpoint shapes. This is a three stage process. The stages in this process are inactive nonprofit able customer, active profitable customers, very active very profitable customers, lifetime value, average order value, number of repeat sales, average retention time.
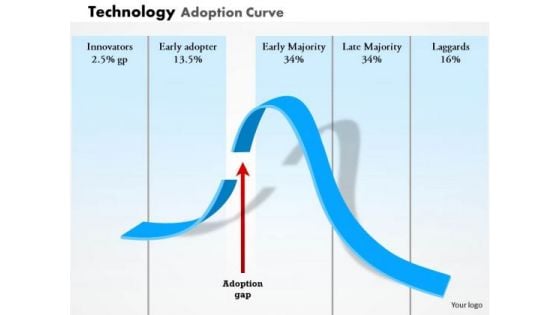
Business Framework Technology Adoption Curve PowerPoint Presentation
This business diagram displays framework of technology adoption curve. It contains curved graph of adoption gap depicting percentage ratio of innovators, early adopter, early majority, late majority and laggards. This diagram enables the users to create their own display of the required processes in an easy way.
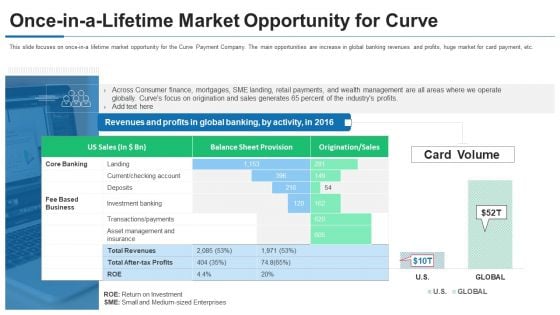
Curve Investor Financing Once In A Lifetime Market Opportunity For Curve Slides PDF
This slide focuses on once-in-a lifetime market opportunity for the Curve Payment Company. The main opportunities are increase in global banking revenues and profits, huge market for card payment, etc. Deliver and pitch your topic in the best possible manner with this Curve Investor Financing Once In A Lifetime Market Opportunity For Curve Slides PDF. Use them to share invaluable insights on Revenues Profits, Global Banking, Investment Banking and impress your audience. This template can be altered and modified as per your expectations. So, grab it now.
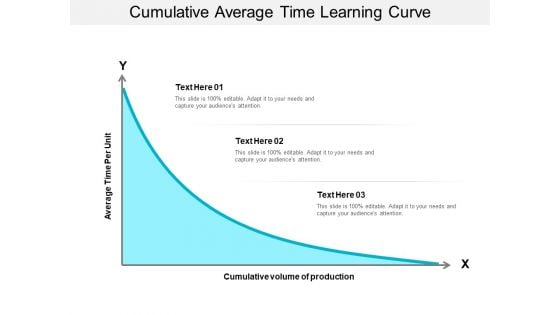
Cumulative Average Time Learning Curve Ppt PowerPoint Presentation Designs
This is a cumulative average time learning curve ppt powerpoint presentation designs. This is a three stage process. The stages in this process are experience curve, learning curve.
Marginal Cost Curve In Powerpoint And Google Slides Cpb
Introducing our well designed Marginal Cost Curve In Powerpoint And Google Slides Cpb. This PowerPoint design presents information on topics like Marginal Cost Curve. As it is predesigned it helps boost your confidence level. It also makes you a better presenter because of its high-quality content and graphics. This PPT layout can be downloaded and used in different formats like PDF, PNG, and JPG. Not only this, it is available in both Standard Screen and Widescreen aspect ratios for your convenience. Therefore, click on the download button now to persuade and impress your audience. Our Marginal Cost Curve In Powerpoint And Google Slides Cpb are topically designed to provide an attractive backdrop to any subject. Use them to look like a presentation pro.
Bacterial Growth Curve In Powerpoint And Google Slides Cpb
Introducing our well designed Bacterial Growth Curve In Powerpoint And Google Slides Cpb. This PowerPoint design presents information on topics like Bacterial Growth Curve. As it is predesigned it helps boost your confidence level. It also makes you a better presenter because of its high-quality content and graphics. This PPT layout can be downloaded and used in different formats like PDF, PNG, and JPG. Not only this, it is available in both Standard Screen and Widescreen aspect ratios for your convenience. Therefore, click on the download button now to persuade and impress your audience. Our Bacterial Growth Curve In Powerpoint And Google Slides Cpb are topically designed to provide an attractive backdrop to any subject. Use them to look like a presentation pro.

Curve Investor Financing Subscriptions Ppt PowerPoint Presentation Gallery Maker PDF
Following slide shows the various subscription cards provided by the Curve company. This subscription cards includes Curve Blue, Curve Black, Curve Metal with their features. Deliver and pitch your topic in the best possible manner with this Curve Investor Financing Subscriptions Ppt PowerPoint Presentation Gallery Maker PDF. Use them to share invaluable insights on Insurance Price, Card Type, Spend Unlimited and impress your audience. This template can be altered and modified as per your expectations. So, grab it now.
Oxygen Dissociation Curve In Powerpoint And Google Slides Cpb
Introducing our well designed Oxygen Dissociation Curve In Powerpoint And Google Slides Cpb. This PowerPoint design presents information on topics like Oxygen Dissociation Curve. As it is predesigned it helps boost your confidence level. It also makes you a better presenter because of its high-quality content and graphics. This PPT layout can be downloaded and used in different formats like PDF, PNG, and JPG. Not only this, it is available in both Standard Screen and Widescreen aspect ratios for your convenience. Therefore, click on the download button now to persuade and impress your audience. Our Oxygen Dissociation Curve In Powerpoint And Google Slides Cpb are topically designed to provide an attractive backdrop to any subject. Use them to look like a presentation pro.
Species Area Curve In Powerpoint And Google Slides Cpb
Introducing our well-designed Species Area Curve In Powerpoint And Google Slides Cpb. This PowerPoint design presents information on topics like Species Area Curve. As it is predesigned it helps boost your confidence level. It also makes you a better presenter because of its high-quality content and graphics. This PPT layout can be downloaded and used in different formats like PDF, PNG, and JPG. Not only this, it is available in both Standard Screen and Widescreen aspect ratios for your convenience. Therefore, click on the download button now to persuade and impress your audience. Our Species Area Curve In Powerpoint And Google Slides Cpb are topically designed to provide an attractive backdrop to any subject. Use them to look like a presentation pro.

Dose Response Curve In Powerpoint And Google Slides Cpb
Introducing our well designed Dose Response Curve In Powerpoint And Google Slides Cpb. This PowerPoint design presents information on topics like Dose Response Curve. As it is predesigned it helps boost your confidence level. It also makes you a better presenter because of its high-quality content and graphics. This PPT layout can be downloaded and used in different formats like PDF, PNG, and JPG. Not only this, it is available in both Standard Screen and Widescreen aspect ratios for your convenience. Therefore, click on the download button now to persuade and impress your audience. Our Dose Response Curve In Powerpoint And Google Slides Cpb are topically designed to provide an attractive backdrop to any subject. Use them to look like a presentation pro.
Stress Strain Curve In Powerpoint And Google Slides Cpb
Introducing our well designed Stress Strain Curve In Powerpoint And Google Slides Cpb. This PowerPoint design presents information on topics like Stress Strain Curve. As it is predesigned it helps boost your confidence level. It also makes you a better presenter because of its high quality content and graphics. This PPT layout can be downloaded and used in different formats like PDF, PNG, and JPG. Not only this, it is available in both Standard Screen and Widescreen aspect ratios for your convenience. Therefore, click on the download button now to persuade and impress your audience. Our Stress Strain Curve In Powerpoint And Google Slides Cpb are topically designed to provide an attractive backdrop to any subject. Use them to look like a presentation pro.
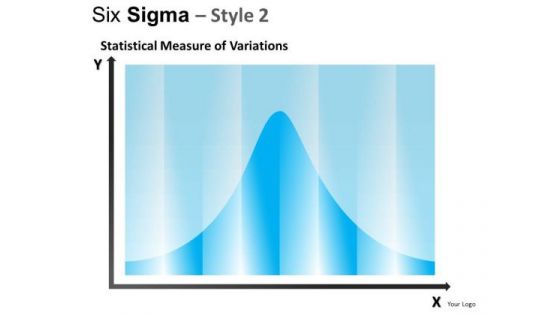
Bell Curve Statistics PowerPoint Slides And Ppt Diagram Templates
Bell Curve Statistics PowerPoint Slides And PPT Diagram Templates-These high quality powerpoint pre-designed slides and powerpoint templates have been carefully created by our professional team to help you impress your audience. All slides have been created and are 100% editable in powerpoint. Each and every property of any graphic - color, size, orientation, shading, outline etc. can be modified to help you build an effective powerpoint presentation. Any text can be entered at any point in the powerpoint template or slide. Simply DOWNLOAD, TYPE and PRESENT! Thoughts won't dry up with our Bell Curve Statistics PowerPoint Slides And Ppt Diagram Templates. They keep your brain going at it all the time.
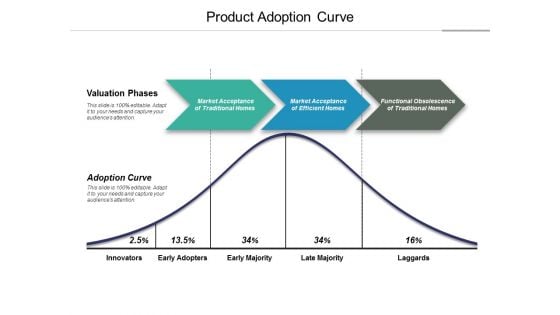
Product Adoption Curve Ppt PowerPoint Presentation Summary Background Designs
This is a product adoption curve ppt powerpoint presentation summary background designs. This is a three stage process. The stages in this process are adoption curve, crossing the chasm, hype cycle.
Growth Curve Mapping Ppt Powerpoint Presentation Complete Deck With Slides
This Growth Curve Mapping Ppt Powerpoint Presentation Complete Deck With Slides is a primer on how to capitalize on business opportunities through planning, innovation, and market intelligence. The content-ready format of the complete deck will make your job as a decision-maker a lot easier. Use this ready-made PowerPoint Template to help you outline an extensive and legible plan to capture markets and grow your company on the right path, at an exponential pace. What is even more amazing is that this presentation is completely editable and 100 percent customizable. This nine slide complete deck helps you impress a roomful of people with your expertise in business and even presentation. Craft such a professional and appealing presentation for that amazing recall value. Download now. Our Growth Curve Mapping Ppt Powerpoint Presentation Complete Deck With Slides are topically designed to provide an attractive backdrop to any subject. Use them to look like a presentation pro.
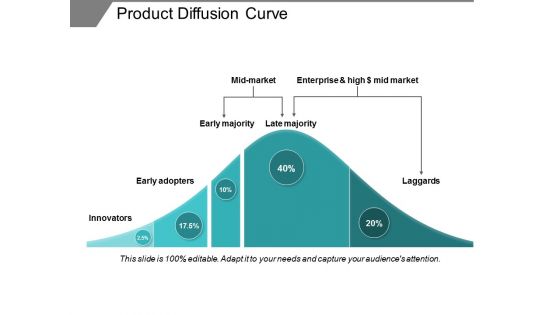
Product Diffusion Curve Ppt PowerPoint Presentation Professional Visuals
This is a product diffusion curve ppt powerpoint presentation professional visuals. This is a five stage process. The stages in this process are adoption curve, crossing the chasm, hype cycle.
Oxyhemoglobin Dissociation Curve In Powerpoint And Google Slides Cpb
Presenting our innovatively designed set of slides titled Oxyhemoglobin Dissociation Curve In Powerpoint And Google Slides Cpb. This completely editable PowerPoint graphic exhibits Oxyhemoglobin Dissociation Curve that will help you convey the message impactfully. It can be accessed with Google Slides and is available in both standard screen and widescreen aspect ratios. Apart from this, you can download this well structured PowerPoint template design in different formats like PDF, JPG, and PNG. So, click the download button now to gain full access to this PPT design. Our Oxyhemoglobin Dissociation Curve In Powerpoint And Google Slides Cpb are topically designed to provide an attractive backdrop to any subject. Use them to look like a presentation pro.
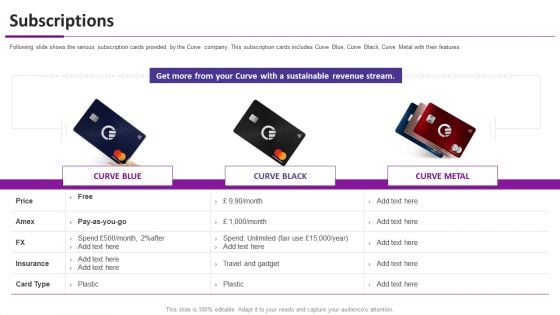
Curve Investor Elevator Pitch Deck Subscriptions Ppt Styles Slide PDF
Following slide shows the various subscription cards provided by the Curve company. This subscription cards includes Curve Blue, Curve Black, Curve Metal with their features. This is a curve investor elevator pitch deck subscriptions ppt styles slide pdf template with various stages. Focus and dispense information on three stages using this creative set, that comes with editable features. It contains large content boxes to add your information on topics like subscriptions . You can also showcase facts, figures, and other relevant content using this PPT layout. Grab it now.

Marketing Plan Implementation Example Smartphone Adoption Curve Formats PDF
Here is an example of market adoption curve for the Smartphones industry. Similarly, map out the adoption rate of your product in your industry. Deliver an awe-inspiring pitch with this creative marketing plan implementation example smartphone adoption curve formats pdf bundle. Topics like example smartphone adoption curve can be discussed with this completely editable template. It is available for immediate download depending on the needs and requirements of the user.
Consulting Diagram Multi Staged Agenda Curve Diagram Business Diagram
Put In A Dollop Of Our Consulting Diagram Multi Staged Agenda Curve Diagram Business Diagram Powerpoint Templates. Give Your Thoughts A Distinctive Flavor.
Strategic Management Multi Staged Agenda Curve Diagram Business Framework Model
Open Up Doors That Lead To Success. Our Strategic Management Multi Staged Agenda Curve Diagram Business Framework Model Powerpoint Templates Provide The Handles.
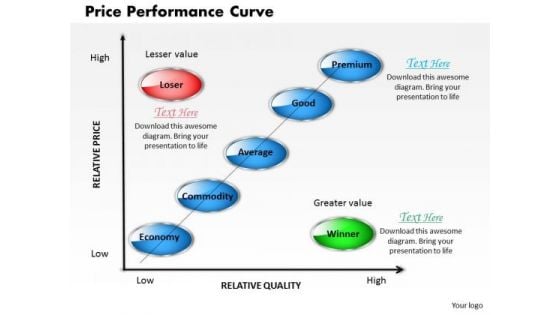
Business Diagram Price Performance Curve PowerPoint Ppt Presentation
Double The Impact With Our Business Diagram Price Performance Curve PowerPoint PPT Presentation PowerPoint Templates. Your Thoughts Will Have An Imposing Effect.
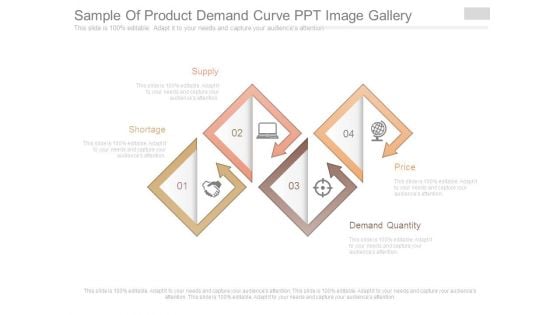
Sample Of Product Demand Curve Ppt Image Gallery
This is a sample of product demand curve ppt image gallery. This is a four stage process. The stages in this process are supply, shortage, price, demand quantity.

Curve Bar Graph For Process Capability Measurement Powerpoint Guide
This is a curve bar graph for process capability measurement powerpoint guide. This is a nine stage process. The stages in this process are target, lsl, usl, category.
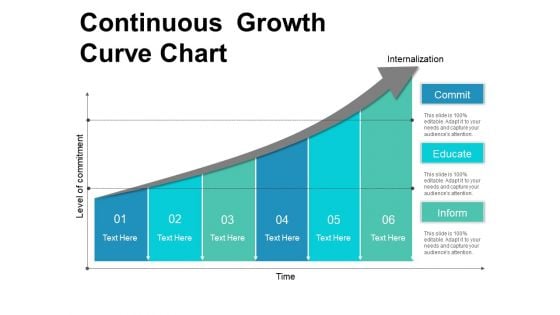
Continuous Growth Curve Chart Ppt PowerPoint Presentation Inspiration Slideshow
This is a continuous growth curve chart ppt powerpoint presentation inspiration slideshow. This is a six stage process. The stages in this process are circular, continuity, continuum.
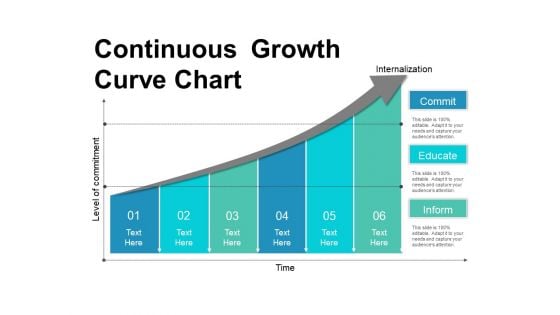
Continuous Growth Curve Chart Ppt PowerPoint Presentation Inspiration Portrait
This is a continuous growth curve chart ppt powerpoint presentation inspiration portrait. This is a six stage process. The stages in this process are circular, continuity, continuum.

Change Transition Curve Ppt PowerPoint Presentation File Information
This is a change transition curve ppt powerpoint presentation file information. This is a six stage process. The stages in this process are marketing, business, management.
Managing Portfolio Growth Options Example Smartphone Adoption Curve Icons PDF
Presenting this set of slides with name managing portfolio growth options example smartphone adoption curve icons pdf. The topics discussed in these slides are smartphone adoption curve. This is a completely editable PowerPoint presentation and is available for immediate download. Download now and impress your audience.

Execution Management In Business Adoption Curve Majority Download PDF
Deliver and pitch your topic in the best possible manner with this execution management in business adoption curve majority download pdf. Use them to share invaluable insights on adoption curve and impress your audience. This template can be altered and modified as per your expectations. So, grab it now.


 Continue with Email

 Home
Home


