Data Dashboard

Business People Profile For Social Media Powerpoint Slides
This PowerPoint template has been designed with business people profile information. This diagram is excellent visual tools to present team profile with social media. Download this PPT slide to explain complex data immediately and clearly.
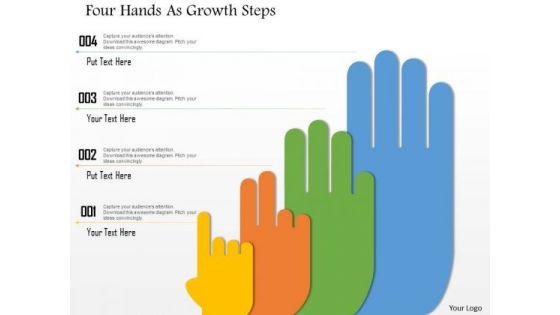
Business Diagram Four Hands As Growth Steps Presentation Template
This business diagram displays four staged hand process diagram. This professional diagram slide helps to display data and process flow. Use this slide for your business and marketing related presentations.
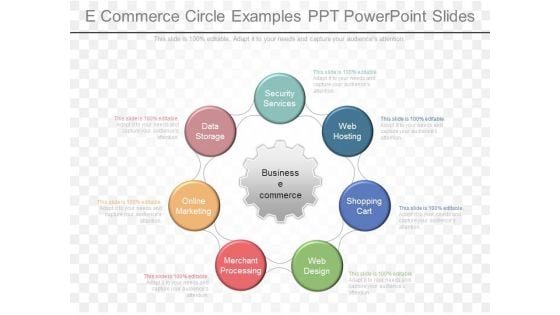
E Commerce Circle Examples Ppt Powerpoint Slides
This is a e commerce circle examples ppt powerpoint slides. This is a seven stage process. The stages in this process are business e commerce, security services, web hosting, shopping cart, web design, merchant processing, online marketing, data storage.
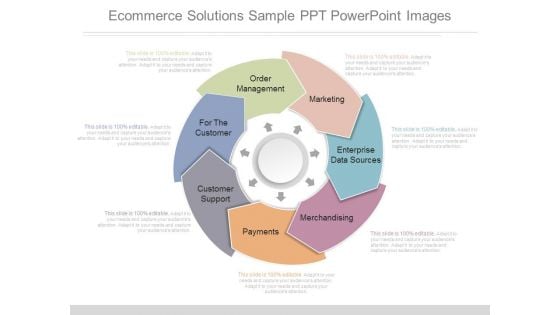
Ecommerce Solutions Sample Ppt Powerpoint Images
This is a ecommerce solutions sample ppt powerpoint images. This is a seven stage process. The stages in this process are order management, for the customer, customer support, payments, merchandising, enterprise data sources, marketing.
Functional Areas Overview Ppt PowerPoint Presentation Icon Design Inspiration
This is a functional areas overview ppt powerpoint presentation icon design inspiration. This is a nine stage process. The stages in this process are master data management, human resources, research and development, controlling, marketing and sales.

Graph03 Business PowerPoint Templates And PowerPoint Backgrounds 0411
Microsoft PowerPoint Template and Background with business chart and data from stock market showing success Manage expectations with our Graph03 Business PowerPoint Templates And PowerPoint Backgrounds 0411. You will be at the top of your game.

A140 ChatGpt Comprehensive Guide Limitations Of Leveraging ChatGpt For Influencer Ppt Slides ChatGpt SS V
This slide showcases various limitations of leveraging ChatGPT for running influencer marketing campaigns. Key issues faced are inability to access influencer, limited data availability and risk of inappropriate data. Want to ace your presentation in front of a live audience Our A140 ChatGpt Comprehensive Guide Limitations Of Leveraging ChatGpt For Influencer Ppt Slides ChatGpt SS V can help you do that by engaging all the users towards you. Slidegeeks experts have put their efforts and expertise into creating these impeccable powerpoint presentations so that you can communicate your ideas clearly. Moreover, all the templates are customizable, and easy-to-edit and downloadable. Use these for both personal and commercial use. This slide showcases various limitations of leveraging ChatGPT for running influencer marketing campaigns. Key issues faced are inability to access influencer, limited data availability and risk of inappropriate data.
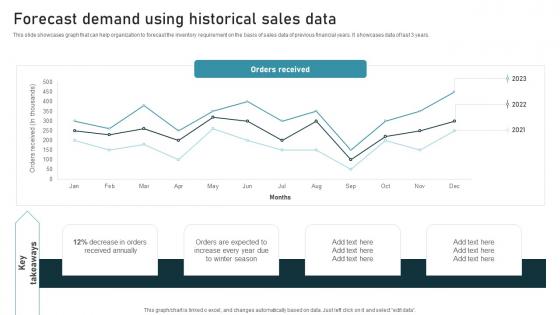
Forecast Demand Using Inventory Administration Techniques For Enhanced Stock Accuracy Template Pdf
This slide showcases graph that can help organization to forecast the inventory requirement on the basis of sales data of previous financial years. It showcases data of last 3 years. Are you in need of a template that can accommodate all of your creative concepts This one is crafted professionally and can be altered to fit any style. Use it with Google Slides or PowerPoint. Include striking photographs, symbols, depictions, and other visuals. Fill, move around, or remove text boxes as desired. Test out color palettes and font mixtures. Edit and save your work, or work with colleagues. Download Forecast Demand Using Inventory Administration Techniques For Enhanced Stock Accuracy Template Pdf and observe how to make your presentation outstanding. Give an impeccable presentation to your group and make your presentation unforgettable. This slide showcases graph that can help organization to forecast the inventory requirement on the basis of sales data of previous financial years. It showcases data of last 3 years.
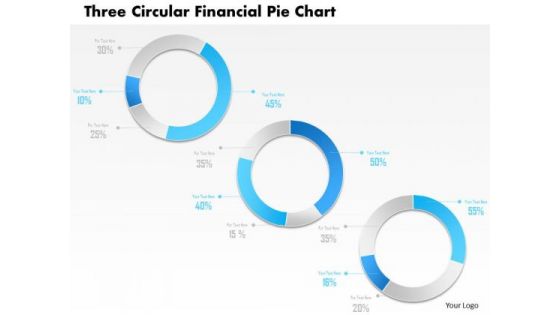
Business Diagram Three Circular Financial Pie Chart PowerPoint Template
This power point template has been designed with graphic of three circular pie chart. This pie chart is suitable for financial data representation. Use this PPt for your business and finance related presentations.
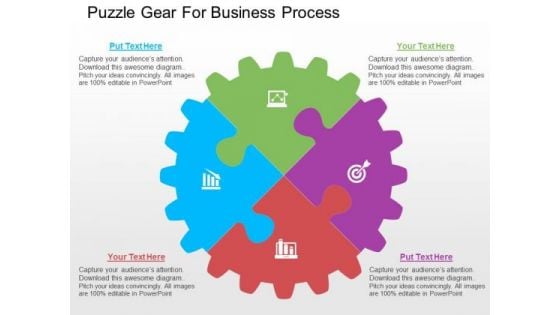
Puzzle Gear For Business Process PowerPoint Templates
Our above PPT slide contains circular gear puzzle diagram. This puzzle gear circular diagram helps to exhibit process planning and solutions. Use this diagram to impart more clarity to data and to create more sound impact on viewers.
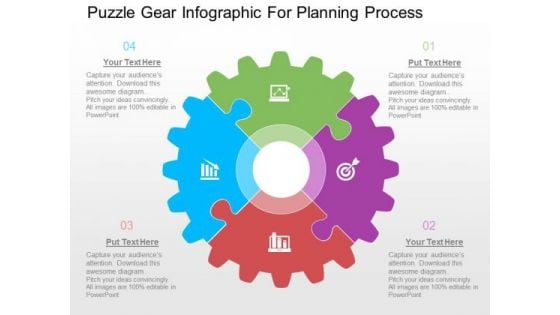
Puzzle Gear Infographic For Planning Process PowerPoint Templates
Our above PPT slide contains circular gear puzzle diagram. This puzzle gear circular diagram helps to exhibit process planning and solutions. Use this diagram to impart more clarity to data and to create more sound impact on viewers.
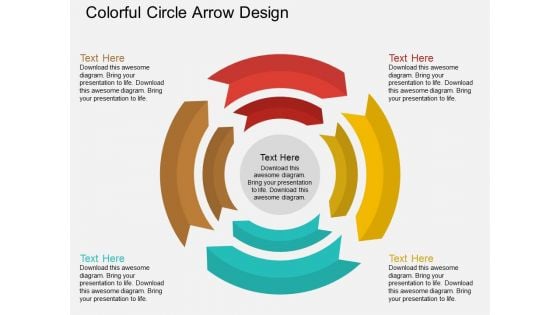
Colorful Circle Arrow Design Powerpoint Template
Our above PPT slide contains circular arrow design. This business diagram helps to exhibit process flow. Use this diagram to impart more clarity to data and to create more sound impact on viewers.
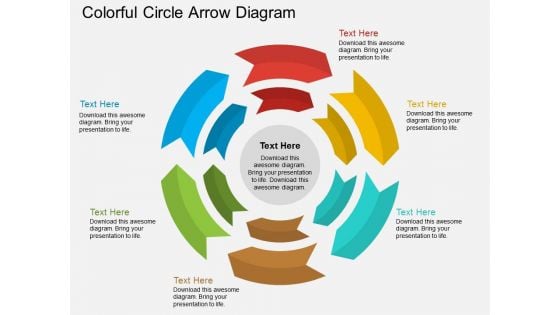
Colorful Circle Arrow Diagram Powerpoint Template
Our above PPT slide contains circular arrow design. This business diagram helps to exhibit process flow. Use this diagram to impart more clarity to data and to create more sound impact on viewers.
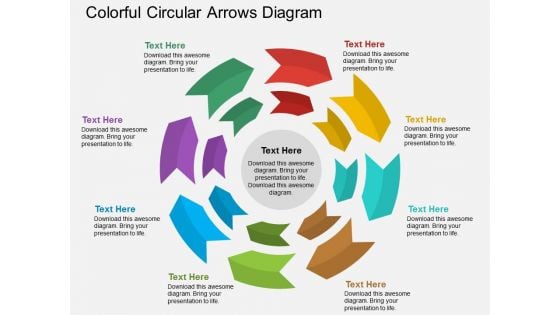
Colorful Circular Arrows Diagram Powerpoint Template
Our above PPT slide contains circular arrow design. This business diagram helps to exhibit process flow. Use this diagram to impart more clarity to data and to create more sound impact on viewers.
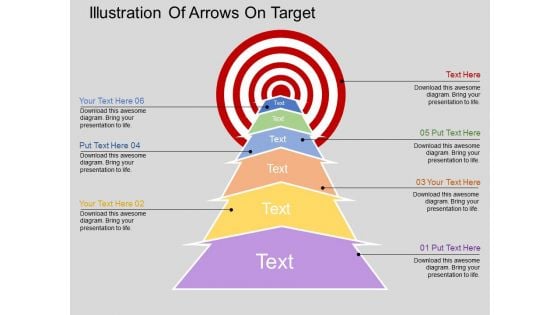
Illustration Of Arrows On Target Powerpoint Templates
Our above slide illustrates arrow steps towards target. This PowerPoint template may be used to exhibit target planning. Use this diagram to impart more clarity to data and to create more sound impact on viewers.
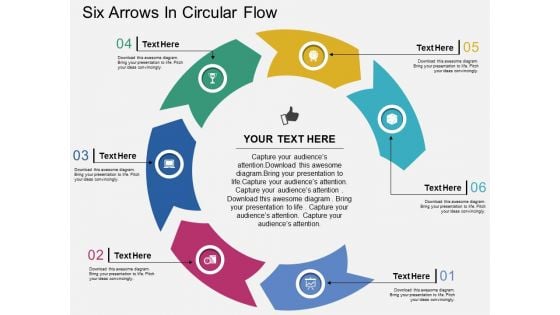
Six Arrows In Circular Flow Powerpoint Templates
Our above PPT slide contains graphics of circular diagram. This business diagram helps to display outline of business plan. Use this template to impart more clarity to data and to create more sound impact on viewers.
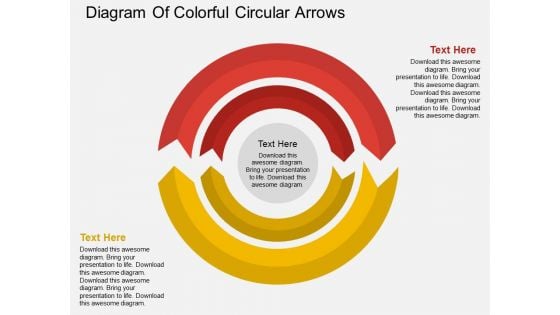
Diagram Of Colorful Circular Arrows Powerpoint Template
Our above PPT slide contains circular arrow design. This business diagram helps to exhibit process flow. Use this diagram to impart more clarity to data and to create more sound impact on viewers.
Four Sequential Boxes And Icons Diagram Powerpoint Template
This PowerPoint template has been designed with four sequential boxes and icons. This diagram is excellent visual tools for business presentations. Download this PPT slide to explain complex data immediately and clearly.
Linear Circles Of Timeline With Icons Powerpoint Template
Our above slide contains linear timeline diagram. This PowerPoint template helps to display circle steps in linear flow. Use this diagram to impart more clarity to data and to create more sound impact on viewers.

Business Man On Road With Question Mark Powerpoint Template
Our above PPT slide contains road graphics with business man and question mark. It helps to exhibit finding possible solutions. Use this diagram to impart more clarity to data and to create more sound impact on viewers.
Linear Arrow Process Diagram With Icons Powerpoint Template
This business slide has been designed with infographic of linear arrow. This arrow infographic can be used for data representation. Use this diagram for your business presentations. Build a quality presentation for your viewers with this unique diagram.
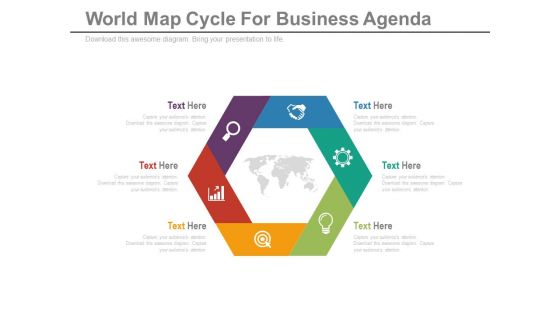
Diagram For Global Business Strategy Powerpoint Template
Our above slide contains hexagonal infographic diagram. This PowerPoint template helps to display global business strategy. Use this diagram to impart more clarity to data and to create more sound impact on viewers.

Three Steps Business Strategy Chart Powerpoint Template
This PowerPoint slide contains three steps infographic hart. It helps to exhibit business strategy steps. Use this diagram to impart more clarity to data and to create more sound impact on viewers.
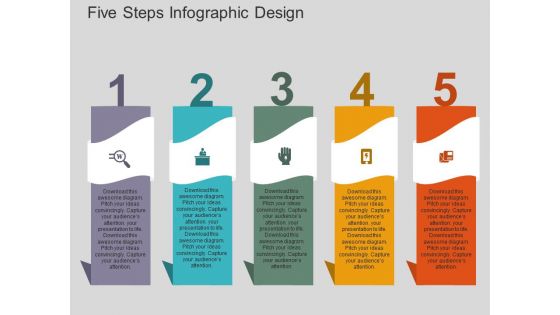
Five Steps Infographic Design Powerpoint Templates
Our above slide contains graphics of six hands around bulb. It helps to display steps of idea planning. Use this diagram to impart more clarity to data and to create more sound impact on viewers.
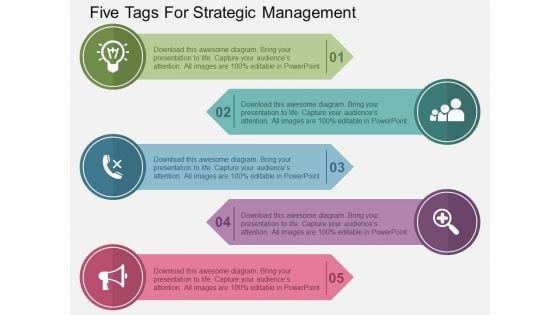
Five Tags For Strategic Management Powerpoint Templates
Our above slide contains diagram of circular infographic. It helps to exhibit six steps of goal planning. Use this diagram to impart more clarity to data and to create more sound impact on viewers.
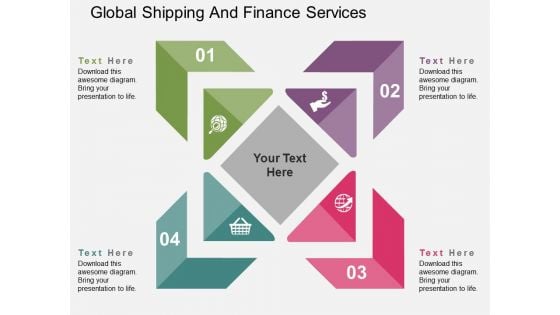
Global Shipping And Finance Services Powerpoint Templates
Our above PPT slide contains triangles infographic. It helps to display outline of business plan. Use this diagram to impart more clarity to data and to create more sound impact on viewers.
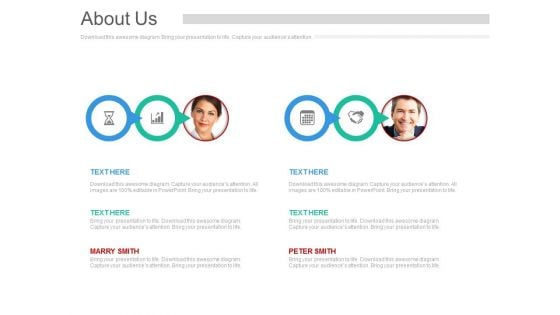
Business Team About Us Page Powerpoint Slides
This PowerPoint template has been designed with team pictures and business icons. This diagram is excellent visual tools to present teams strategic planning. Download this PPT slide to explain complex data immediately and clearly.
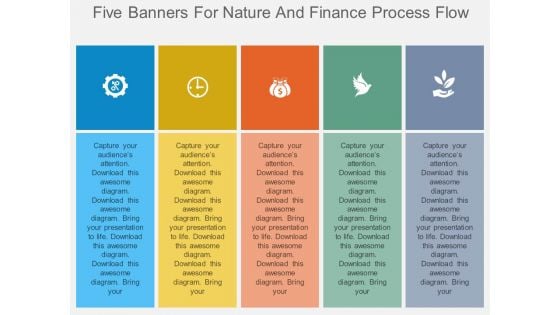
Five Banners For Nature And Finance Process Flow Powerpoint Template
This PowerPoint template has been designed with five banners nature, finance icons. This diagram is excellent visual tools for business presentations. Download this PPT slide to explain complex data immediately and clearly.
Four Arrows For Different Process Representation Powerpoint Template
This PowerPoint template has been designed with graphics of four arrows This diagram is excellent visual tools for business presentations. Download this PPT slide to explain complex data immediately and clearly.

Feedback For Monitoring Powerpoint Templates Microsoft
This is a feedback for monitoring powerpoint templates microsoft. This is a seven stage process. The stages in this process are resources and structure, data and infrastructure, integrated customer communication, feedback for monitoring, annual benchmarking, strategic approach, performance improvement process.\n\n\n
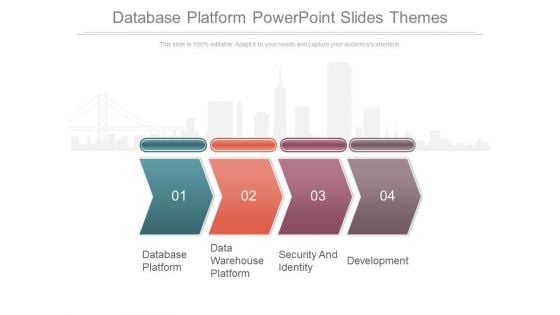
Database Platform Powerpoint Slides Themes
This is a database platform powerpoint slides themes. This is a four stage process. The stages in this process are database platform, data warehouse platform, security and identity, development.
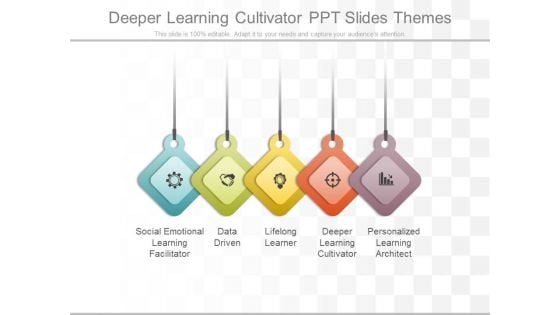
Deeper Learning Cultivator Ppt Slides Themes
This is a deeper learning cultivator ppt slides themes. This is a five stage process. The stages in this process are social emotional learning facilitator, data driven, lifelong learner, deeper learning cultivator, personalized learning architect.
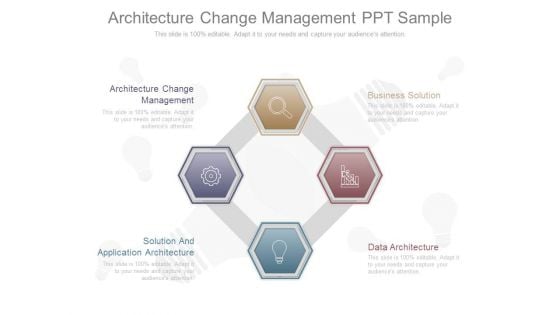
Architecture Change Management Ppt Sample
This is a architecture change management ppt sample. This is a four stage process. The stages in this process are architecture change management, business solution, solution and application architecture, data architecture.
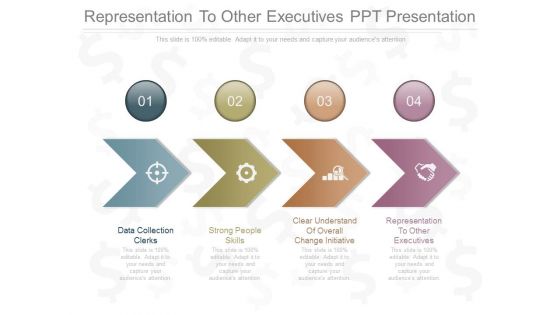
Representation To Other Executives Ppt Presentation
This is a representation to other executives ppt presentation. This is a four stage process. The stages in this process are data collection clerks, strong people skills, clear understand of overall change initiative, representation to other executives.
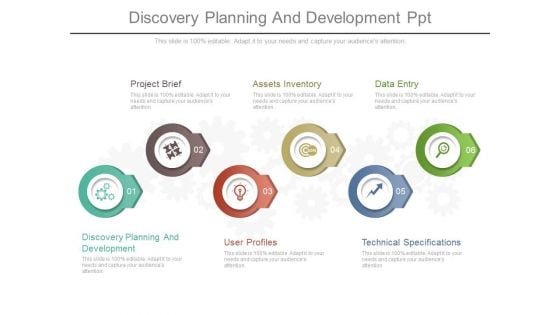
Discovery Planning And Development Ppt
This is a discovery planning and development ppt. This is a five stage process. The stages in this process are project brief, assets inventory, data entry, discovery planning and development, user profiles, technical specifications.

Technical Specifications Powerpoint Slide Presentation Tips
This is a technical specifications powerpoint slide presentation tips. This is a seven stage process. The stages in this process are discovery planning and development, project brief, user profiles, assets inventory, technical specifications, data entry.
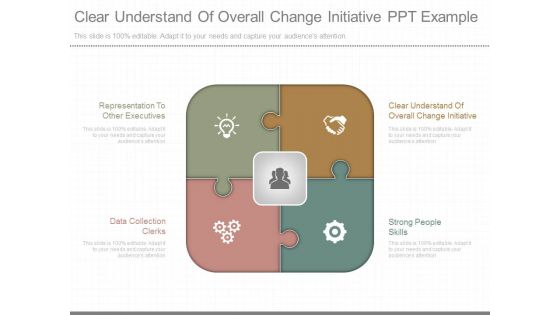
Clear Understand Of Overall Change Initiative Ppt Example
This is a clear understand of overall change initiative ppt example. This is a four stage process. The stages in this process are representation to other executives, data collection clerks, clear understand of overall change initiative, strong people skills.
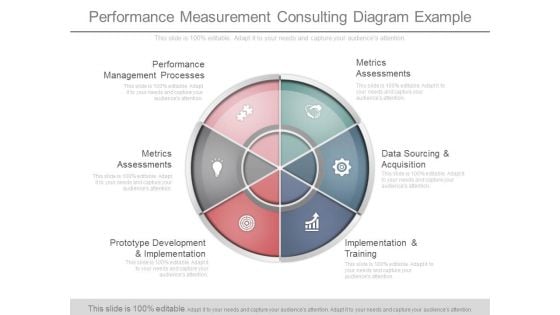
Performance Measurement Consulting Diagram Example
This is a performance measurement consulting diagram example. This is a six stage process. The stages in this process are performance management processes, metrics assessments, prototype development and implementation, metrics assessments, data sourcing and acquisition, implementation and training.
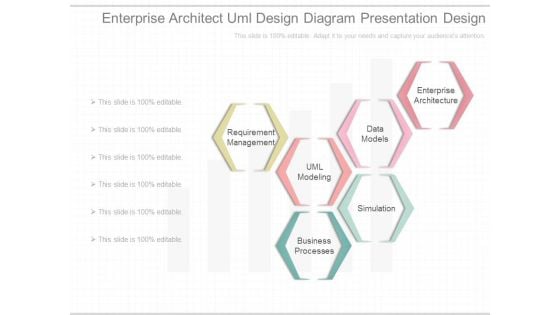
Enterprise Architect Uml Design Diagram Presentation Design
This is a enterprise architect uml design diagram presentation design. This is a six stage process. The stages in this process are requirement management, uml modeling, data models, business processes, simulation, enterprise architecture.
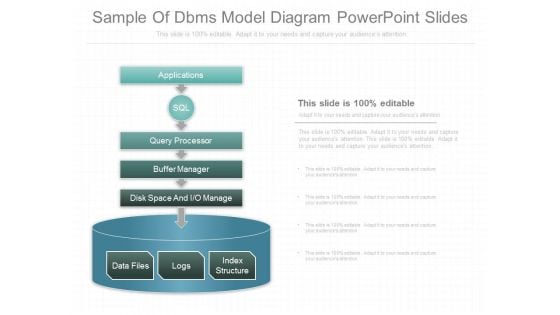
Sample Of Dbms Model Diagram Powerpoint Slides
This is a sample of dbms model diagram powerpoint slides. This is a one stage process. The stages in this process are applications, sql, query processor, buffer manager, disk space and io manage, data files, logs, index structure.
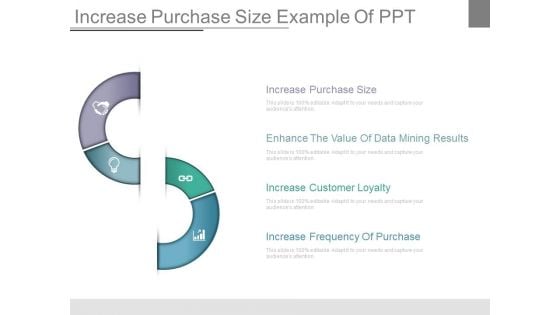
Increase Purchase Size Example Of Ppt
This is a increase purchase size example of ppt. This is a four stage process. The stages in this process are increase purchase size, enhance the value of data mining results, increase customer loyalty, increase frequency of purchase.
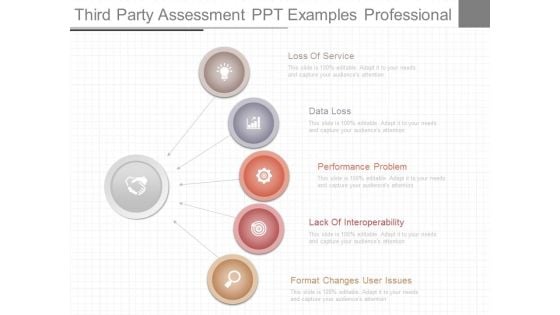
Third Party Assessment Ppt Examples Professional
This is a Third Party Assessment Ppt Examples Professional. This is a five stage process. The stages in this process are data loss, performance problem, lack of interoperability, format changes user issues.
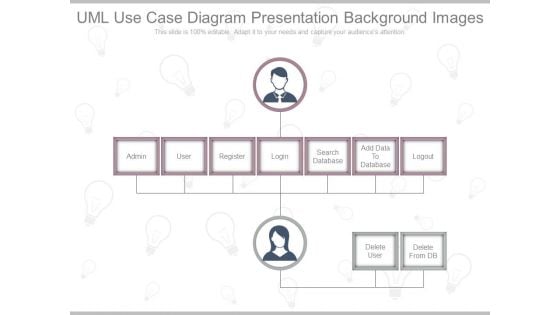
Uml Use Case Diagram Presentation Background Images
This is a uml use case diagram presentation background images. This is a seven stage process. The stages in this process are admin, user, register, login, search database, add data to database, logout.
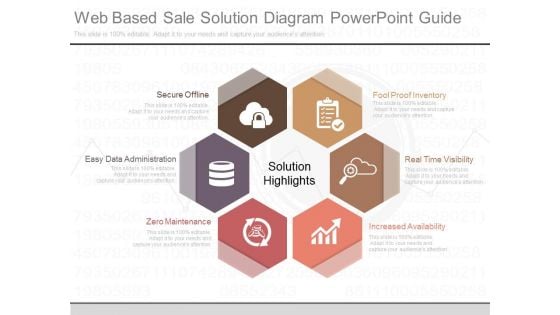
Web Based Sale Solution Diagram Powerpoint Guide
This is a web based sale solution diagram powerpoint guide. This is a six stage process. The stages in this process are fool proof inventory, real time visibility, increased availability, zero maintenance, easy data administration, secure offline.
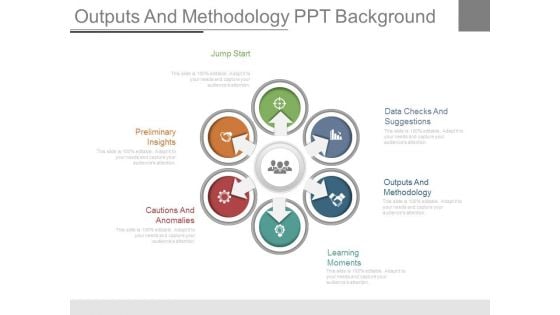
Outputs And Methodology Ppt Background
This is a outputs and methodology ppt background. This is a six stage process. The stages in this process are jump start, preliminary insights, cautions and anomalies, learning moments, outputs and methodology, data checks and suggestions.
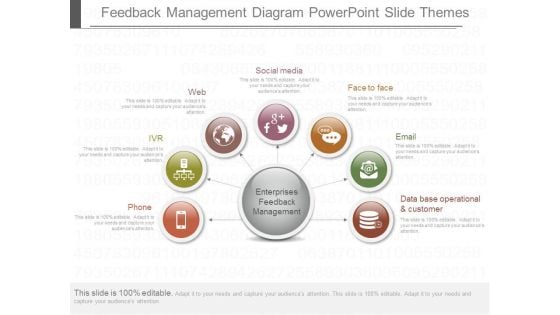
Feedback Management Diagram Powerpoint Slide Themes
This is a feedback management diagram powerpoint slide themes. This is a seven stage process. The stages in this process are phone, ivr, web, social media, face to face, email, data base operational and customer, enterprises feedback management.
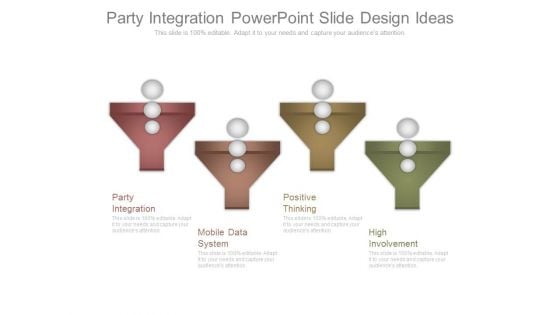
Party Integration Powerpoint Slide Design Ideas
This is a party integration powerpoint slide design ideas. This is a four stage process. The stages in this process are party integration, mobile data system, positive thinking, high involvement.
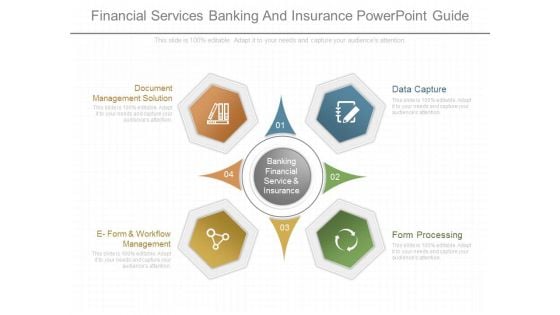
Financial Services Banking And Insurance Powerpoint Guide
This is a financial services banking and insurance powerpoint guide. This is a four stage process. The stages in this process are banking financial service and insurance, data capture, form processing, e form and workflow management, document management solution.
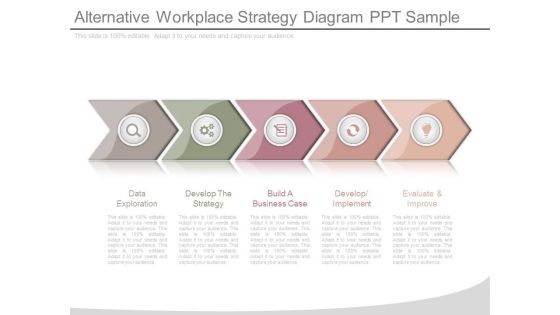
Alternative Workplace Strategy Diagram Ppt Sample
This is a alternative workplace strategy diagram ppt sample. This is a five stage process. The stages in this process are data exploration, develop the strategy, build a business case, develop implement, evaluate and improve.
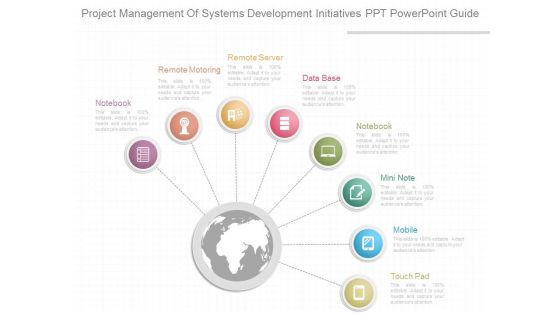
Project Management Of Systems Development Initiatives Ppt Powerpoint Guide
This is a project management of systems development initiatives ppt powerpoint guide. This is a eight stage process. The stages in this process are notebook, remote motoring, remote server, data base, mini note, mobile, touch pad.
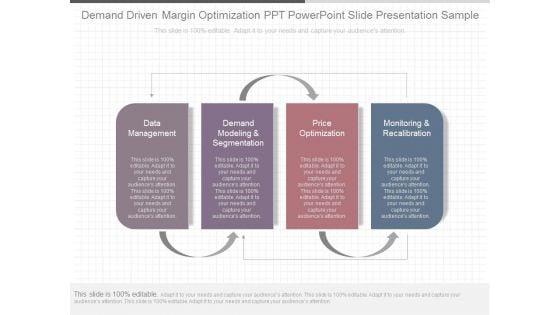
Demand Driven Margin Optimization Ppt Powerpoint Slide Presentation Sample
This is a demand driven margin optimization ppt powerpoint slide presentation sample. This is a four stage process. The stages in this process are data management, demand modeling and segmentation, price optimization, monitoring and recalibration.
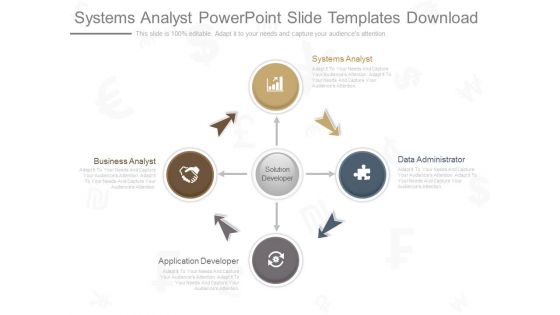
Systems Analyst Powerpoint Slide Templates Download
This is a systems analyst powerpoint slide templates download. This is a four stage process. The stages in this process are solution developer, business analyst, application developer, data administrator, systems analyst.
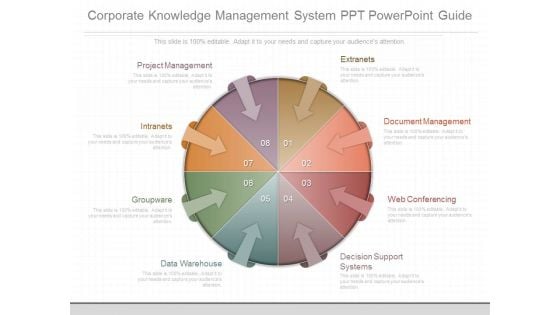
Corporate Knowledge Management System Ppt Powerpoint Guide
This is a corporate knowledge management system ppt powerpoint guide. This is a eight stage process. The stages in this process are extranets, document management, web conferencing, decision support systems, data warehouse, groupware, intranets, project management.
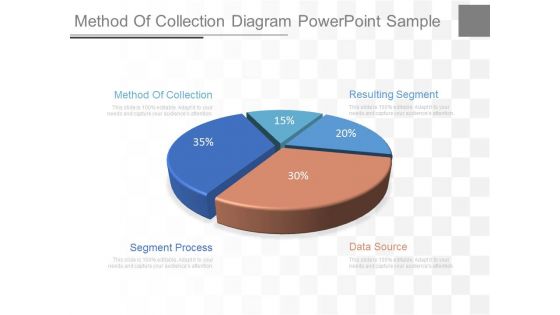
Method Of Collection Diagram Powerpoint Sample
This is a method of collection diagram powerpoint sample. This is a five stage process. The stages in this process are method of collection, segment process, data source, resulting segment.
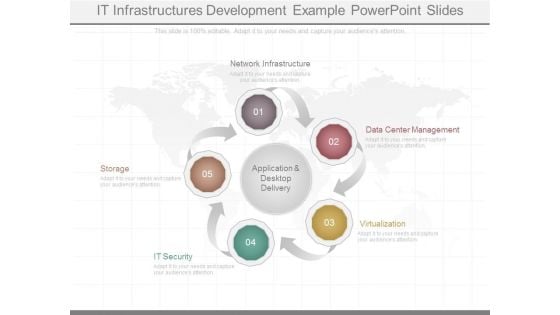
It Infrastructures Development Example Powerpoint Slides
This is a it infrastructures development example powerpoint slides. This is a five stage process. The stages in this process are application and desktop delivery, network infrastructure, data center management, storage, it security, virtualization.
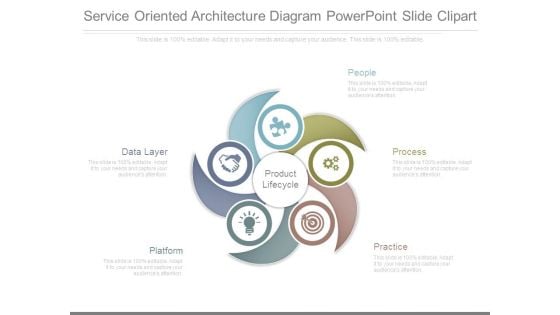
Service Oriented Architecture Diagram Powerpoint Slide Clipart
This is a service oriented architecture diagram powerpoint slide clipart. This is a five stage process. The stages in this process are product lifecycle, data layer, platform, people, process, practice.
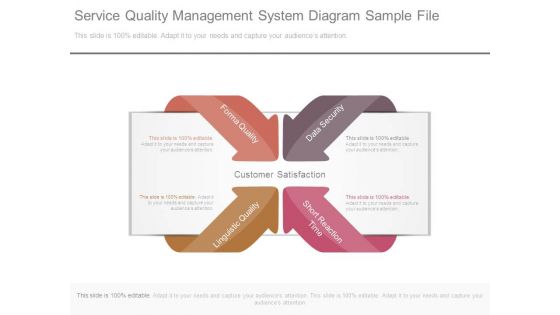
Service Quality Management System Diagram Sample File
This is a service quality management system diagram sample file. This is a four stage process. The stages in this process are forma quality, linguistic quality, data security, short reaction time.
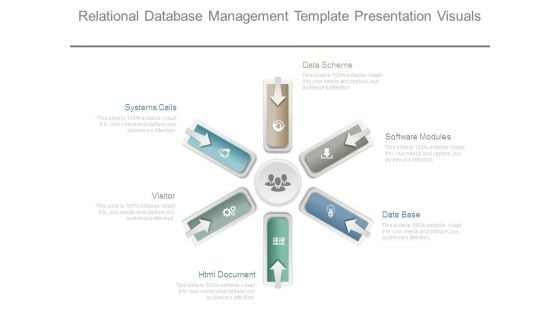
Relational Database Management Template Presentation Visuals
This is a relational database management template presentation visuals. This is a six stage process. The stages in this process are systems calls, visitor, html document, database, software modules, data scheme.
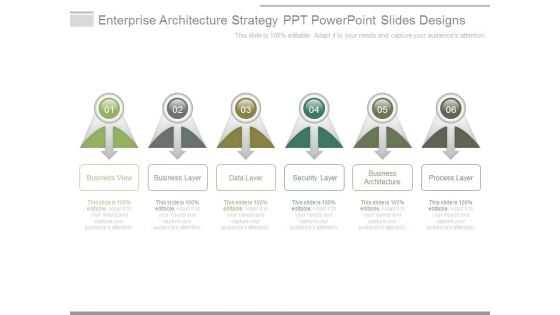
Enterprise Architecture Strategy Ppt Powerpoint Slides Designs
This is a enterprise architecture strategy ppt powerpoint slides designs. This is a six stage process. The stages in this process are business view, business layer, data layer, security layer, business architecture, process layer.
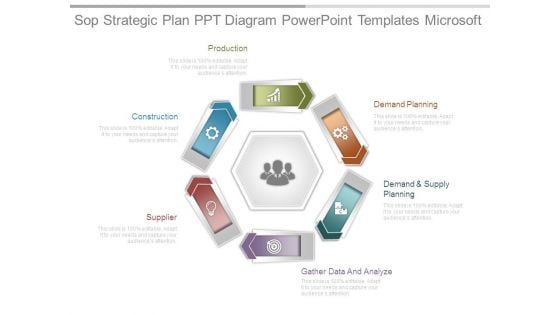
Sop Strategic Plan Ppt Diagram Powerpoint Templates Microsoft
This is a sop strategic plan ppt diagram powerpoint templates microsoft. This is a six stage process. The stages in this process are production, construction, supplier, gather data and analyze, demand and supply, demand planning.


 Continue with Email

 Home
Home


