Data Dashboard
Kpi Dashboard Best Practices For Project Management Ppt Powerpoint Presentation Outline Samples
This is a kpi dashboard best practices for project management ppt powerpoint presentation outline samples. This is a three stage process. The stages in this process are business metrics, business kpi, business dashboard.
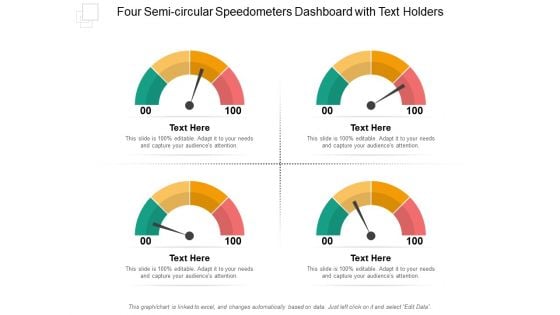
Four Semi Circular Speedometers Dashboard With Text Holders Ppt PowerPoint Presentation File Layouts
This is a four semi circular speedometers dashboard with text holders ppt powerpoint presentation file layouts. This is a four stage process. The stages in this process are fuel gauge, gas gauge, fuel containers.

Three Dashboard Speed Indicators With Text Holders Ppt PowerPoint Presentation Summary Layout
This is a three dashboard speed indicators with text holders ppt powerpoint presentation summary layout. This is a three stage process. The stages in this process are fuel gauge, gas gauge, fuel containers.
Pitch Deck For Seed Financing Dashboard Ppt Icon Graphic Tips PDF
Deliver and pitch your topic in the best possible manner with this pitch deck for seed financing dashboard ppt icon graphic tips pdf. Use them to share invaluable insights on low, medium, high and impress your audience. This template can be altered and modified as per your expectations. So, grab it now.
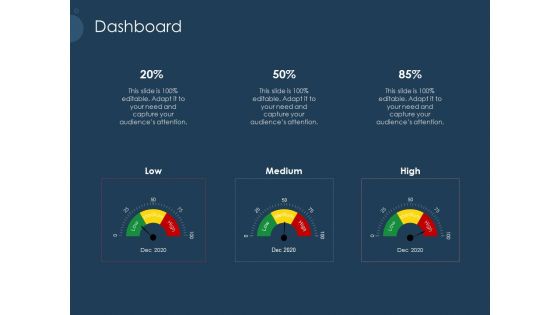
Pitch Deck To Gather Funding From Initial Capital Dashboard Graphics PDF
Deliver and pitch your topic in the best possible manner with this pitch deck to gather funding from initial capital dashboard graphics pdf. Use them to share invaluable insights on low, medium, high and impress your audience. This template can be altered and modified as per your expectations. So, grab it now.

Key Performance Indicator Analytics Dashboard Ppt PowerPoint Presentation Model Example Topics
This is a key performance indicator analytics dashboard ppt powerpoint presentation model example topics. This is a five stage process. The stages in this process are kpi proposal, kpi plan, kpi scheme.

Market Entry Strategy Clubs Industry Analytics Dashboard For Gym Health And Fitness Clubs Summary PDF
This slide covers the Key performance indicators for analysing social media platforms, email campaigns and website performance. Presenting market entry strategy clubs industry analytics dashboard for gym health and fitness clubs summary pdf to provide visual cues and insights. Share and navigate important information on seven stages that need your due attention. This template can be used to pitch topics like Analytics Dashboard for Gym Health and Fitness Clubs. In addtion, this PPT design contains high-resolution images, graphics, etc, that are easily editable and available for immediate download.

Car Dashboard And Speedometer Graphics Ppt PowerPoint Presentation File Graphics Template
This is a car dashboard and speedometer graphics ppt powerpoint presentation file graphics template. This is a four stage process. The stages in this process are fuel gauge, gas gauge, fuel containers.
Semi Circular Fuel Dashboard With Pointer In Centre Ppt PowerPoint Presentation Outline Visuals
This is a semi circular fuel dashboard with pointer in centre ppt powerpoint presentation outline visuals. This is a three stage process. The stages in this process are fuel gauge, gas gauge, fuel containers.
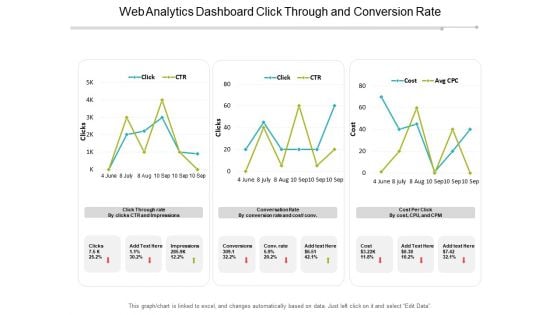
Web Analytics Dashboard Click Through And Conversion Rate Ppt PowerPoint Presentation Professional
This is a web analytics dashboard click through and conversion rate ppt powerpoint presentation professional. This is a three stage process. The stages in this process are marketing analytics, marketing performance, marketing discovery.
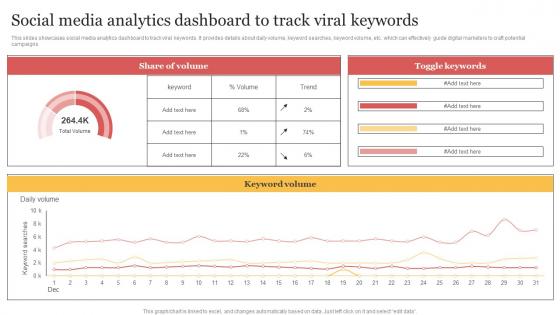
Social Media Analytics Dashboard To Track Viral Keywords Organizing Buzzworthy Social Themes Pdf
This slides showcases social media analytics dashboard to track viral keywords. It provides details about daily volume, keyword searches, keyword volume, etc. which can effectively guide digital marketers to craft potential campaigns. The Social Media Analytics Dashboard To Track Viral Keywords Organizing Buzzworthy Social Themes Pdf is a compilation of the most recent design trends as a series of slides. It is suitable for any subject or industry presentation, containing attractive visuals and photo spots for businesses to clearly express their messages. This template contains a variety of slides for the user to input data, such as structures to contrast two elements, bullet points, and slides for written information. Slidegeeks is prepared to create an impression. This slides showcases social media analytics dashboard to track viral keywords. It provides details about daily volume, keyword searches, keyword volume, etc. which can effectively guide digital marketers to craft potential campaigns.
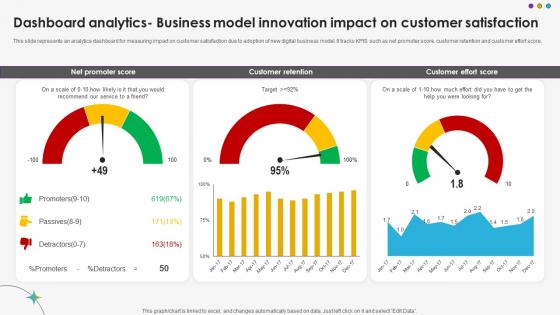
Dashboard Analytics Business Model Innovation Impact On Customer Satisfaction DT SS V
This slide represents an analytics dashboard for measuring impact on customer satisfaction due to adoption of new digital business model. It tracks KPIS such as net promoter score, customer retention and customer effort score.The Dashboard Analytics Business Model Innovation Impact On Customer Satisfaction DT SS V is a compilation of the most recent design trends as a series of slides. It is suitable for any subject or industry presentation, containing attractive visuals and photo spots for businesses to clearly express their messages. This template contains a variety of slides for the user to input data, such as structures to contrast two elements, bullet points, and slides for written information. Slidegeeks is prepared to create an impression. This slide represents an analytics dashboard for measuring impact on customer satisfaction due to adoption of new digital business model. It tracks KPIS such as net promoter score, customer retention and customer effort score.
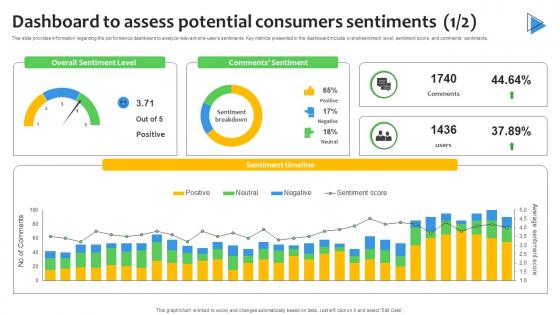
Dashboard To Assess Potential Consumers Sentiment Analysis Demystified Understanding AI SS V
This slide provides information regarding the performance dashboard to analyze relevant end-users sentiments. Key metrics presented in the dashboard include overall sentiment level, sentiment score, and comments sentiments. Do you have an important presentation coming up Are you looking for something that will make your presentation stand out from the rest Look no further than Dashboard To Assess Potential Consumers Sentiment Analysis Demystified Understanding AI SS V. With our professional designs, you can trust that your presentation will pop and make delivering it a smooth process. And with Slidegeeks, you can trust that your presentation will be unique and memorable. So why wait Grab Dashboard To Assess Potential Consumers Sentiment Analysis Demystified Understanding AI SS V today and make your presentation stand out from the rest This slide provides information regarding the performance dashboard to analyze relevant end-users sentiments. Key metrics presented in the dashboard include overall sentiment level, sentiment score, and comments sentiments.
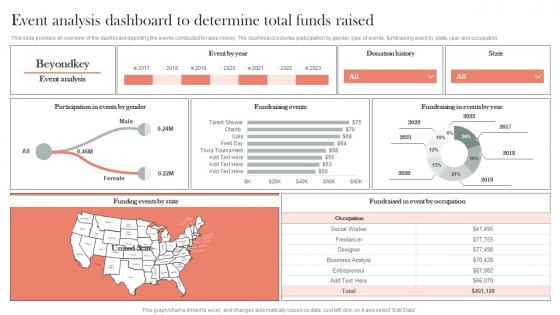
Event Analysis Dashboard To Determine Total Funds Raised Efficient Nonprofit Marketing Clipart Pdf
This slide provides an overview of the dashboard depicting the events conducted to raise money. The dashboard includes participation by gender, type of events, fundraising event by state, year and occupation.This Event Analysis Dashboard To Determine Total Funds Raised Efficient Nonprofit Marketing Clipart Pdf is perfect for any presentation, be it in front of clients or colleagues. It is a versatile and stylish solution for organizing your meetings. The Event Analysis Dashboard To Determine Total Funds Raised Efficient Nonprofit Marketing Clipart Pdf features a modern design for your presentation meetings. The adjustable and customizable slides provide unlimited possibilities for acing up your presentation. Slidegeeks has done all the homework before launching the product for you. So, do not wait, grab the presentation templates today This slide provides an overview of the dashboard depicting the events conducted to raise money. The dashboard includes participation by gender, type of events, fundraising event by state, year and occupation.
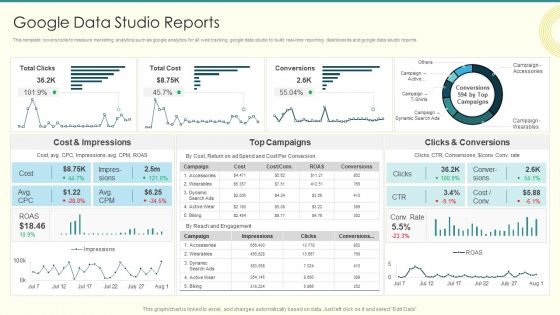
Security And Performance Digital Marketing Google Data Studio Reports Brochure PDF
This template covers tools to measure marketing analytics such as google analytics for all web tracking, google data studio to build real-time reporting dashboards and google data studio reports.Deliver an awe inspiring pitch with this creative Security And Performance Digital Marketing Google Data Studio Reports Brochure PDF bundle. Topics like Impressions, Clicks Conversions, Cost Impressions can be discussed with this completely editable template. It is available for immediate download depending on the needs and requirements of the user.
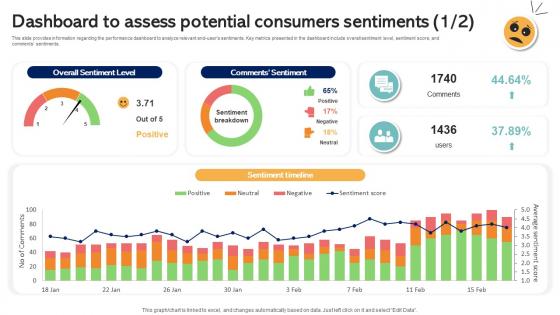
Dashboard To Assess Potential Consumers Sentiments Emotionally Intelligent Insights Leveraging AI SS V
This slide provides information regarding the performance dashboard to analyze relevant end-users sentiments. Key metrics presented in the dashboard include overall sentiment level, sentiment score, and comments sentiments. Do you have an important presentation coming up Are you looking for something that will make your presentation stand out from the rest Look no further than Dashboard To Assess Potential Consumers Sentiments Emotionally Intelligent Insights Leveraging AI SS V. With our professional designs, you can trust that your presentation will pop and make delivering it a smooth process. And with Slidegeeks, you can trust that your presentation will be unique and memorable. So why wait Grab Dashboard To Assess Potential Consumers Sentiments Emotionally Intelligent Insights Leveraging AI SS V today and make your presentation stand out from the rest This slide provides information regarding the performance dashboard to analyze relevant end-users sentiments. Key metrics presented in the dashboard include overall sentiment level, sentiment score, and comments sentiments.
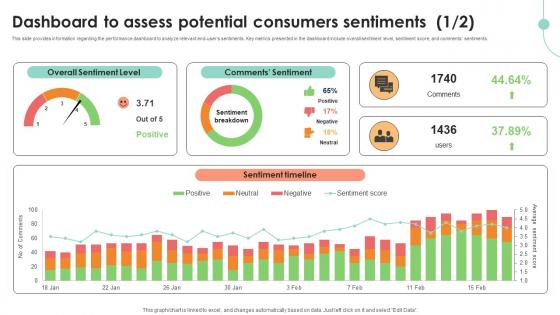
Dashboard To Assess Potential Consumers Decoding User Emotions In Depth Exploration AI SS V
This slide provides information regarding the performance dashboard to analyze relevant end-users sentiments. Key metrics presented in the dashboard include overall sentiment level, sentiment score, and comments sentiments. Do you have an important presentation coming up Are you looking for something that will make your presentation stand out from the rest Look no further than Dashboard To Assess Potential Consumers Decoding User Emotions In Depth Exploration AI SS V. With our professional designs, you can trust that your presentation will pop and make delivering it a smooth process. And with Slidegeeks, you can trust that your presentation will be unique and memorable. So why wait Grab Dashboard To Assess Potential Consumers Decoding User Emotions In Depth Exploration AI SS V today and make your presentation stand out from the rest This slide provides information regarding the performance dashboard to analyze relevant end-users sentiments. Key metrics presented in the dashboard include overall sentiment level, sentiment score, and comments sentiments.
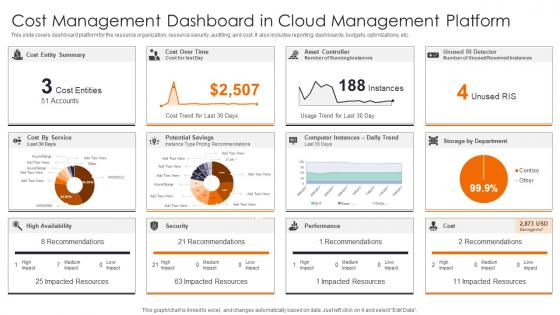
Cost Management Dashboard Enhancing Workload Efficiency Through Cloud Architecture Pictures Pdf
This slide covers dashboard platform for the resource organization, resource security, auditing, and cost. It also includes reporting, dashboards, budgets, optimizations, etc. Explore a selection of the finest Cost Management Dashboard Enhancing Workload Efficiency Through Cloud Architecture Pictures Pdf here. With a plethora of professionally designed and pre made slide templates, you can quickly and easily find the right one for your upcoming presentation. You can use our Cost Management Dashboard Enhancing Workload Efficiency Through Cloud Architecture Pictures Pdf to effectively convey your message to a wider audience. Slidegeeks has done a lot of research before preparing these presentation templates. The content can be personalized and the slides are highly editable. Grab templates today from Slidegeeks. This slide covers dashboard platform for the resource organization, resource security, auditing, and cost. It also includes reporting, dashboards, budgets, optimizations, etc.

Predictive Maintained Dashboard To Determine Engine Details Optimizing Inventory Management IoT SS V
This slide provides an overview of the predictive maintenance dashboard used to track engine status. The dashboard includes normal, warning and critical engines, optimal condition, etc. Explore a selection of the finest Predictive Maintained Dashboard To Determine Engine Details Optimizing Inventory Management IoT SS V here. With a plethora of professionally designed and pre-made slide templates, you can quickly and easily find the right one for your upcoming presentation. You can use our Predictive Maintained Dashboard To Determine Engine Details Optimizing Inventory Management IoT SS V to effectively convey your message to a wider audience. Slidegeeks has done a lot of research before preparing these presentation templates. The content can be personalized and the slides are highly editable. Grab templates today from Slidegeeks. This slide provides an overview of the predictive maintenance dashboard used to track engine status. The dashboard includes normal, warning and critical engines, optimal condition, etc.
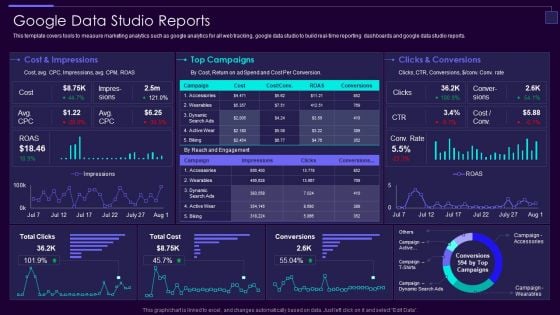
Social Media Brand Promotion Instructions Playbook Google Data Studio Reports Formats PDF
This template covers tools to measure marketing analytics such as google analytics for all web tracking, google data studio to build real-time reporting dashboards and google data studio reports.Deliver an awe inspiring pitch with this creative Social Media Brand Promotion Instructions Playbook Google Data Studio Reports Formats PDF bundle. Topics like Conversions, Cost And Impressions, Top Campaigns can be discussed with this completely editable template. It is available for immediate download depending on the needs and requirements of the user.
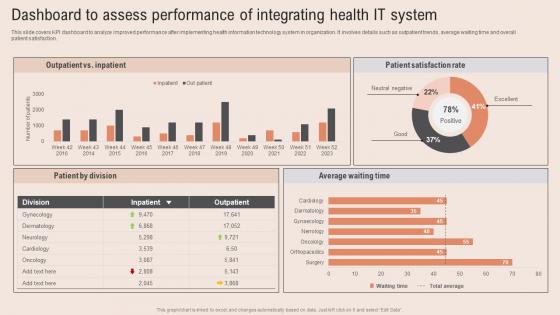
Dashboard Assess Performance Healthcare Information Tech To Enhance Medical Facilities Professional Pdf
This slide covers KPI dashboard to analyze improved performance after implementing health information technology system in organization. It involves details such as outpatient trends, average waiting time and overall patient satisfaction. Present like a pro with Dashboard Assess Performance Healthcare Information Tech To Enhance Medical Facilities Professional Pdf Create beautiful presentations together with your team, using our easy to use presentation slides. Share your ideas in real time and make changes on the fly by downloading our templates. So whether you are in the office, on the go, or in a remote location, you can stay in sync with your team and present your ideas with confidence. With Slidegeeks presentation got a whole lot easier. Grab these presentations today. This slide covers KPI dashboard to analyze improved performance after implementing health information technology system in organization. It involves details such as outpatient trends, average waiting time and overall patient satisfaction.

Dashboard Assess Healthcare Service Healthcare Information Tech Enhance Medical Facilities Microsoft Pdf
This slide covers KPI dashboard to assess performance f medical services. It involves details such as patient stay length, admission rate, average treatment costs and cost analysis of stays. From laying roadmaps to briefing everything in detail, our templates are perfect for you. You can set the stage with your presentation slides. All you have to do is download these easy to edit and customizable templates. Dashboard Assess Healthcare Service Healthcare Information Tech Enhance Medical Facilities Microsoft Pdf will help you deliver an outstanding performance that everyone would remember and praise you for. Do download this presentation today. This slide covers KPI dashboard to assess performance f medical services. It involves details such as patient stay length, admission rate, average treatment costs and cost analysis of stays.
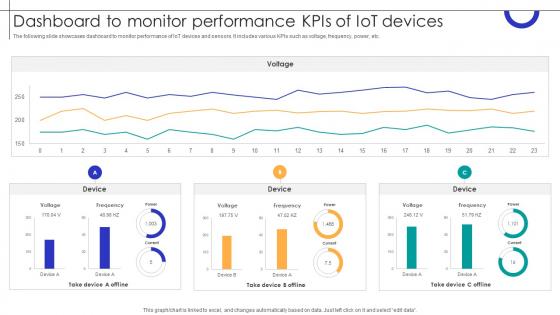
Dashboard To Monitor Performance KPIS Of IOT Devices Streamlining Production Ppt Powerpoint
The following slide showcases dashboard to monitor performance of IoT devices and sensors. It includes various KPIs such as voltage, frequency, power, etc. Formulating a presentation can take up a lot of effort and time, so the content and message should always be the primary focus. The visuals of the PowerPoint can enhance the presenters message, so our Dashboard To Monitor Performance KPIS Of IOT Devices Streamlining Production Ppt Powerpoint was created to help save time. Instead of worrying about the design, the presenter can concentrate on the message while our designers work on creating the ideal templates for whatever situation is needed. Slidegeeks has experts for everything from amazing designs to valuable content, we have put everything into Dashboard To Monitor Performance KPIS Of IOT Devices Streamlining Production Ppt Powerpoint The following slide showcases dashboard to monitor performance of IoT devices and sensors. It includes various KPIs such as voltage, frequency, power, etc.
Sales Improvement Leading Metrics Dashboard Icon Ppt Summary Design Inspiration Pdf
Showcasing this set of slides titled Sales Improvement Leading Metrics Dashboard Icon Ppt Summary Design Inspiration Pdf. The topics addressed in these templates are Sales Improvement Leading, Metrics Dashboard, Icon. All the content presented in this PPT design is completely editable. Download it and make adjustments in color, background, font etc. as per your unique business setting. Our Sales Improvement Leading Metrics Dashboard Icon Ppt Summary Design Inspiration Pdf are topically designed to provide an attractive backdrop to any subject. Use them to look like a presentation pro.
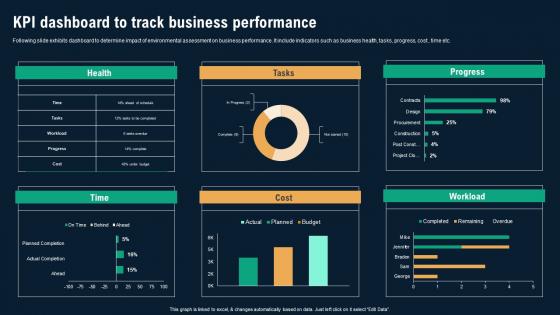
KPI Dashboard To Track Business Performance Business Environmental Analysis Formats Pdf
Following slide exhibits dashboard to determine impact of environmental assessment on business performance. It include indicators such as business health, tasks, progress, cost , time etc. The KPI Dashboard To Track Business Performance Business Environmental Analysis Formats Pdf is a compilation of the most recent design trends as a series of slides. It is suitable for any subject or industry presentation, containing attractive visuals and photo spots for businesses to clearly express their messages. This template contains a variety of slides for the user to input data, such as structures to contrast two elements, bullet points, and slides for written information. Slidegeeks is prepared to create an impression. Following slide exhibits dashboard to determine impact of environmental assessment on business performance. It include indicators such as business health, tasks, progress, cost , time etc.
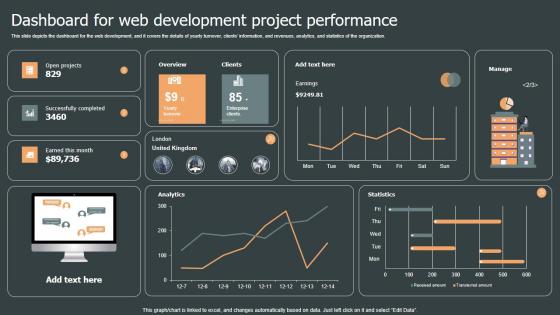
Dashboard For Web Development Role Web Designing User Engagement Topics PDF
This slide depicts the dashboard for the web development, and it covers the details of yearly turnover, clients information, and revenues, analytics, and statistics of the organization. There are so many reasons you need a Dashboard For Web Development Role Web Designing User Engagement Topics PDF. The first reason is you can not spend time making everything from scratch, Thus, Slidegeeks has made presentation templates for you too. You can easily download these templates from our website easily. This slide depicts the dashboard for the web development, and it covers the details of yearly turnover, clients information, and revenues, analytics, and statistics of the organization.
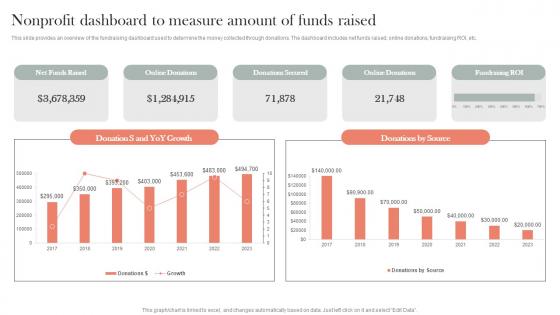
Non profit Dashboard To Measure Amount Of Funds Efficient Nonprofit Marketing Background Pdf
This slide provides an overview of the fundraising dashboard used to determine the money collected through donations. The dashboard includes net funds raised, online donations, fundraising ROI, etc.Boost your pitch with our creative Non profit Dashboard To Measure Amount Of Funds Efficient Nonprofit Marketing Background Pdf. Deliver an awe-inspiring pitch that will mesmerize everyone. Using these presentation templates you will surely catch everyones attention. You can browse the ppts collection on our website. We have researchers who are experts at creating the right content for the templates. So you do not have to invest time in any additional work. Just grab the template now and use them. This slide provides an overview of the fundraising dashboard used to determine the money collected through donations. The dashboard includes net funds raised, online donations, fundraising ROI, etc.
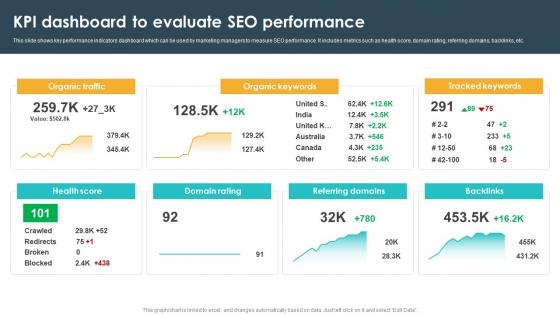
Kpi Dashboard To Evaluate Seo Performance Seo Content Plan To Drive Strategy SS V
This slide shows key performance indicators dashboard which can be used by marketing managers to measure SEO performance. It includes metrics such as health score, domain rating, referring domains, backlinks, etc. Welcome to our selection of the Kpi Dashboard To Evaluate Seo Performance Seo Content Plan To Drive Strategy SS V These are designed to help you showcase your creativity and bring your sphere to life. Planning and Innovation are essential for any business that is just starting out. This collection contains the designs that you need for your everyday presentations. All of our PowerPoints are 100Percent editable, so you can customize them to suit your needs. This multi-purpose template can be used in various situations. Grab these presentation templates today. This slide shows key performance indicators dashboard which can be used by marketing managers to measure SEO performance. It includes metrics such as health score, domain rating, referring domains, backlinks, etc.
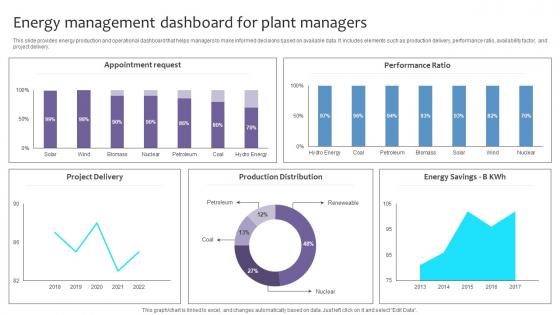
Empowering The Future Energy Management Dashboard For Plant Managers IoT SS V
This slide provides energy production and operational dashboard that helps managers to make informed decisions based on available data. It includes elements such as production delivery, performance ratio, availability factor, and project delivery. Crafting an eye-catching presentation has never been more straightforward. Let your presentation shine with this tasteful yet straightforward Empowering The Future Energy Management Dashboard For Plant Managers IoT SS V template. It offers a minimalistic and classy look that is great for making a statement. The colors have been employed intelligently to add a bit of playfulness while still remaining professional. Construct the ideal Empowering The Future Energy Management Dashboard For Plant Managers IoT SS V that effortlessly grabs the attention of your audience Begin now and be certain to wow your customers This slide provides energy production and operational dashboard that helps managers to make informed decisions based on available data. It includes elements such as production delivery, performance ratio, availability factor, and project delivery.
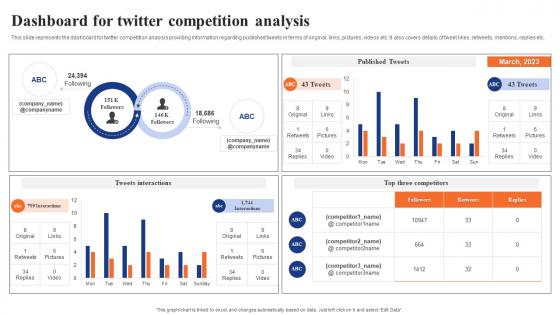
Digital Advertising Using Twitter Dashboard For Twitter Competition Analysis Information Pdf
This slide represents the dashboard for twitter competition analysis providing information regarding published tweets in terms of original, links, pictures, videos etc. It also covers details of tweet likes, retweets, mentions, replies etc. Get a simple yet stunning designed Digital Advertising Using Twitter Dashboard For Twitter Competition Analysis Information Pdf. It is the best one to establish the tone in your meetings. It is an excellent way to make your presentations highly effective. So, download this PPT today from Slidegeeks and see the positive impacts. Our easy to edit Digital Advertising Using Twitter Dashboard For Twitter Competition Analysis Information Pdf can be your go to option for all upcoming conferences and meetings. So, what are you waiting for Grab this template today. This slide represents the dashboard for twitter competition analysis providing information regarding published tweets in terms of original, links, pictures, videos etc. It also covers details of tweet likes, retweets, mentions, replies etc.
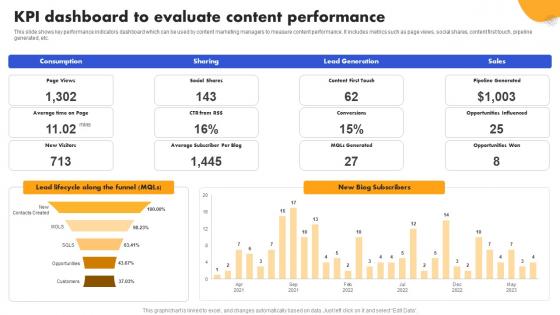
SEO Strategy To Improve ROI KPI Dashboard To Evaluate Content Strategy SS V
This slide shows key performance indicators dashboard which can be used by content marketing managers to measure content performance. It includes metrics such as page views, social shares, content first touch, pipeline generated, etc. Welcome to our selection of the SEO Strategy To Improve ROI KPI Dashboard To Evaluate Content Strategy SS V. These are designed to help you showcase your creativity and bring your sphere to life. Planning and Innovation are essential for any business that is just starting out. This collection contains the designs that you need for your everyday presentations. All of our PowerPoints are 100Percent editable, so you can customize them to suit your needs. This multi-purpose template can be used in various situations. Grab these presentation templates today. This slide shows key performance indicators dashboard which can be used by content marketing managers to measure content performance. It includes metrics such as page views, social shares, content first touch, pipeline generated, etc.
Online Learning And Improvement KPI Training Sessions Dashboard Icon Graphics Pdf
Pitch your topic with ease and precision using this Online Learning And Improvement KPI Training Sessions Dashboard Icon Graphics Pdf. This layout presents information on Online Learning, Improvement KPI, Training Sessions, Dashboard Icon. It is also available for immediate download and adjustment. So, changes can be made in the color, design, graphics or any other component to create a unique layout. Our Online Learning And Improvement KPI Training Sessions Dashboard Icon Graphics Pdf are topically designed to provide an attractive backdrop to any subject. Use them to look like a presentation pro.
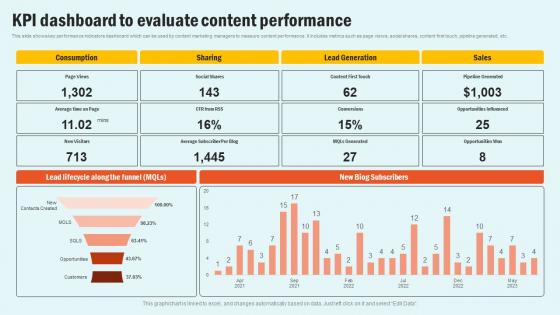
KPI Dashboard To Evaluate Enhancing Website Performance With Search Engine Content Pictures Pdf
This slide shows key performance indicators dashboard which can be used by content marketing managers to measure content performance. It includes metrics such as page views, social shares, content first touch, pipeline generated, etc. This KPI Dashboard To Evaluate Enhancing Website Performance With Search Engine Content Pictures Pdf is perfect for any presentation, be it in front of clients or colleagues. It is a versatile and stylish solution for organizing your meetings. The KPI Dashboard To Evaluate Enhancing Website Performance With Search Engine Content Pictures Pdf features a modern design for your presentation meetings. The adjustable and customizable slides provide unlimited possibilities for acing up your presentation. Slidegeeks has done all the homework before launching the product for you. So, do not wait, grab the presentation templates today This slide shows key performance indicators dashboard which can be used by content marketing managers to measure content performance. It includes metrics such as page views, social shares, content first touch, pipeline generated, etc.
Overall Brand Performance Tracking Dashboard Toolkit For Brand Planning Information Pdf
This slide provides information regarding brand performance tracking dashboard capturing KPIs such as brand metric, brand commitment, advertising metrics, and purchase metrics. Here you can discover an assortment of the finest PowerPoint and Google Slides templates. With these templates, you can create presentations for a variety of purposes while simultaneously providing your audience with an eye catching visual experience. Download Overall Brand Performance Tracking Dashboard Toolkit For Brand Planning Information Pdf to deliver an impeccable presentation. These templates will make your job of preparing presentations much quicker, yet still, maintain a high level of quality. Slidegeeks has experienced researchers who prepare these templates and write high quality content for you. Later on, you can personalize the content by editing the Overall Brand Performance Tracking Dashboard Toolkit For Brand Planning Information Pdf. This slide provides information regarding brand performance tracking dashboard capturing KPIs such as brand metric, brand commitment, advertising metrics, and purchase metrics.
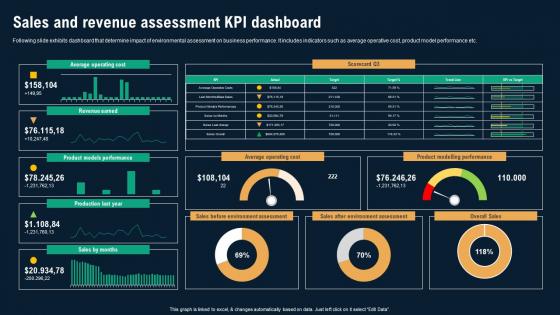
Sales And Revenue Assessment KPI Dashboard Business Environmental Analysis Ideas Pdf
Following slide exhibits dashboard that determine impact of environmental assessment on business performance. It includes indicators such as average operative cost, product model performance etc. There are so many reasons you need a Sales And Revenue Assessment KPI Dashboard Business Environmental Analysis Ideas Pdf The first reason is you can not spend time making everything from scratch, Thus, Slidegeeks has made presentation templates for you too. You can easily download these templates from our website easily. Following slide exhibits dashboard that determine impact of environmental assessment on business performance. It includes indicators such as average operative cost, product model performance etc.
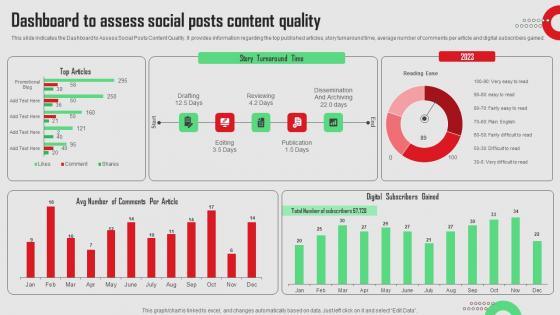
Dashboard To Assess Social Posts Content Quality Social Media Platforms Performance Designs Pdf
This slide indicates the Dashboard to Assess Social Posts Content Quality. It provides information regarding the top published articles, story turnaround time, average number of comments per article and digital subscribers gained.Want to ace your presentation in front of a live audience Our Dashboard To Assess Social Posts Content Quality Social Media Platforms Performance Designs Pdf can help you do that by engaging all the users towards you.. Slidegeeks experts have put their efforts and expertise into creating these impeccable powerpoint presentations so that you can communicate your ideas clearly. Moreover, all the templates are customizable, and easy-to-edit and downloadable. Use these for both personal and commercial use. This slide indicates the Dashboard to Assess Social Posts Content Quality. It provides information regarding the top published articles, story turnaround time, average number of comments per article and digital subscribers gained.
Dashboard For Tracking Impact Of Warehouse Leveraging Logistics Automation Information Pdf
This slide covers the dashboard with after automation warehouse overview. It include KPIs such as autonomous robots status, robotic arms status, battery level, performance, time to return, etc.Get a simple yet stunning designed Dashboard For Tracking Impact Of Warehouse Leveraging Logistics Automation Information Pdf. It is the best one to establish the tone in your meetings. It is an excellent way to make your presentations highly effective. So, download this PPT today from Slidegeeks and see the positive impacts. Our easy-to-edit Dashboard For Tracking Impact Of Warehouse Leveraging Logistics Automation Information Pdf can be your go-to option for all upcoming conferences and meetings. So, what are you waiting for Grab this template today. This slide covers the dashboard with after automation warehouse overview. It include KPIs such as autonomous robots status, robotic arms status, battery level, performance, time to return, etc.
Kpi Dashboard For Tracking Enhance Client Engagement With Interactive Advertising Background Pdf
This slide shows KPI dashboard for assessing performance of social media platforms. It provides information about followers, likes, clicks, shares, impressions, engaged users, new followers, etc. The Kpi Dashboard For Tracking Enhance Client Engagement With Interactive Advertising Background Pdf is a compilation of the most recent design trends as a series of slides. It is suitable for any subject or industry presentation, containing attractive visuals and photo spots for businesses to clearly express their messages. This template contains a variety of slides for the user to input data, such as structures to contrast two elements, bullet points, and slides for written information. Slidegeeks is prepared to create an impression. This slide shows KPI dashboard for assessing performance of social media platforms. It provides information about followers, likes, clicks, shares, impressions, engaged users, new followers, etc.
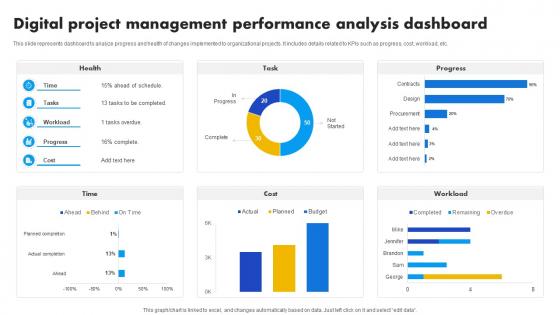
Digital Project Management Performance Analysis Dashboard Strategies For Success In Digital
This slide represents dashboard to analyze progress and health of changes implemented to organizational projects. It includes details related to KPIs such as progress, cost, workload, etc. Whether you have daily or monthly meetings, a brilliant presentation is necessary. Digital Project Management Performance Analysis Dashboard Strategies For Success In Digital can be your best option for delivering a presentation. Represent everything in detail using Digital Project Management Performance Analysis Dashboard Strategies For Success In Digital and make yourself stand out in meetings. The template is versatile and follows a structure that will cater to your requirements. All the templates prepared by Slidegeeks are easy to download and edit. Our research experts have taken care of the corporate themes as well. So, give it a try and see the results. This slide represents dashboard to analyze progress and health of changes implemented to organizational projects. It includes details related to KPIs such as progress, cost, workload, etc.
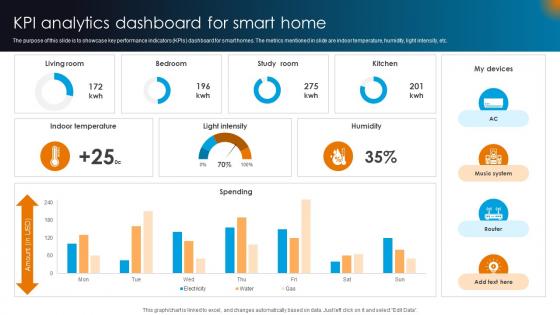
Integrating AI With IoT Kpi Analytics Dashboard For Smart Home IoT SS V
The purpose of this slide is to showcase key performance indicators KPIs dashboard for smart homes. The metrics mentioned in slide are indoor temperature, humidity, light intensity, etc. Are you searching for a Integrating AI With IoT Kpi Analytics Dashboard For Smart Home IoT SS V that is uncluttered, straightforward, and original Its easy to edit, and you can change the colors to suit your personal or business branding. For a presentation that expresses how much effort you have put in, this template is ideal With all of its features, including tables, diagrams, statistics, and lists, its perfect for a business plan presentation. Make your ideas more appealing with these professional slides. Download Integrating AI With IoT Kpi Analytics Dashboard For Smart Home IoT SS V from Slidegeeks today. The purpose of this slide is to showcase key performance indicators KPIs dashboard for smart homes. The metrics mentioned in slide are indoor temperature, humidity, light intensity, etc.
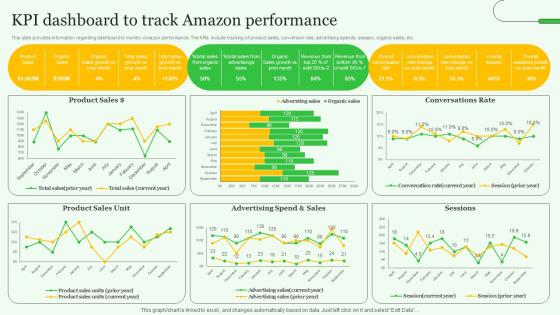
KPI Dashboard To Track Amazon Exploring Amazons Global Business Model Growth Themes Pdf
This slide provides information regarding dashboard to monitor Amazon performance. The KPIs include tracking of product sales, conversion rate, advertising spends, session, organic sales, etc. Are you searching for a KPI Dashboard To Track Amazon Exploring Amazons Global Business Model Growth Themes Pdf that is uncluttered, straightforward, and original Its easy to edit, and you can change the colors to suit your personal or business branding. For a presentation that expresses how much effort you have put in, this template is ideal With all of its features, including tables, diagrams, statistics, and lists, its perfect for a business plan presentation. Make your ideas more appealing with these professional slides. Download KPI Dashboard To Track Amazon Exploring Amazons Global Business Model Growth Themes Pdf from Slidegeeks today. This slide provides information regarding dashboard to monitor Amazon performance. The KPIs include tracking of product sales, conversion rate, advertising spends, session, organic sales, etc.
Firewall As A Service Performance Tracking Dashboard Network Security Guidelines Pdf
This slide represents the dashboard to track the performance of Firewall-as-a-Service deployed by different organizations. The purpose of this slide is to showcase the overall performance of FWaaS by demonstrating statistics of monthly threat status, etc. Crafting an eye-catching presentation has never been more straightforward. Let your presentation shine with this tasteful yet straightforward Firewall As A Service Performance Tracking Dashboard Network Security Guidelines Pdf template. It offers a minimalistic and classy look that is great for making a statement. The colors have been employed intelligently to add a bit of playfulness while still remaining professional. Construct the ideal Firewall As A Service Performance Tracking Dashboard Network Security Guidelines Pdf that effortlessly grabs the attention of your audience Begin now and be certain to wow your customers This slide represents the dashboard to track the performance of Firewall-as-a-Service deployed by different organizations. The purpose of this slide is to showcase the overall performance of FWaaS by demonstrating statistics of monthly threat status, etc.
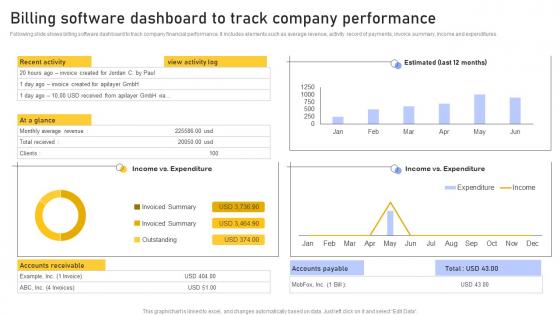
Billing Software Dashboard Enhancing Customer Service Operations Using CRM Technology Microsoft Pdf
Following slide shows billing software dashboard to track company financial performance. It includes elements such as average revenue, activity record of payments, invoice summary, income and expenditures. Create an editable Billing Software Dashboard Enhancing Customer Service Operations Using CRM Technology Microsoft Pdf that communicates your idea and engages your audience. Whether you are presenting a business or an educational presentation, pre designed presentation templates help save time. Billing Software Dashboard Enhancing Customer Service Operations Using CRM Technology Microsoft Pdf is highly customizable and very easy to edit, covering many different styles from creative to business presentations. Slidegeeks has creative team members who have crafted amazing templates. So, go and get them without any delay. Following slide shows billing software dashboard to track company financial performance. It includes elements such as average revenue, activity record of payments, invoice summary, income and expenditures.
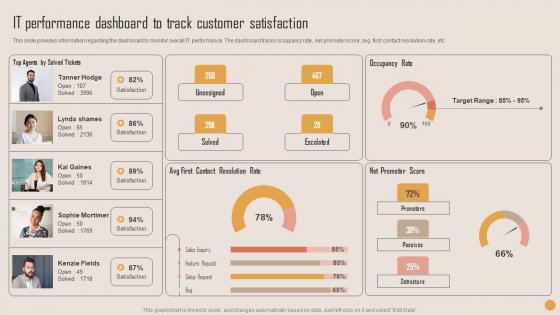
IT Performance Dashboard Playbook For Strategic Actions To Improve IT Performance Rules Pdf
This slide provides information regarding the dashboard to monitor overall IT performance. The dashboard tracks occupancy rate, net promoter score, avg. first contact resolution rate, etc. Presenting this PowerPoint presentation, titled IT Performance Dashboard Playbook For Strategic Actions To Improve IT Performance Rules Pdf, with topics curated by our researchers after extensive research. This editable presentation is available for immediate download and provides attractive features when used. Download now and captivate your audience. Presenting this IT Performance Dashboard Playbook For Strategic Actions To Improve IT Performance Rules Pdf. Our researchers have carefully researched and created these slides with all aspects taken into consideration. This is a completely customizable IT Performance Dashboard Playbook For Strategic Actions To Improve IT Performance Rules Pdf that is available for immediate downloading. Download now and make an impact on your audience. Highlight the attractive features available with our PPTs. This slide provides information regarding the dashboard to monitor overall IT performance. The dashboard tracks occupancy rate, net promoter score, avg. first contact resolution rate, etc.
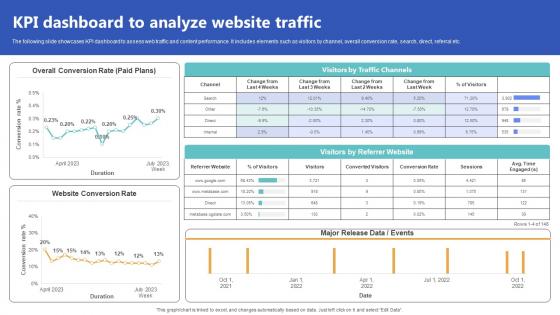
KPI Dashboard To Analyze Website Traffic Top Of The Funnel Digital Content Strategy SS V
The following slide showcases KPI dashboard to assess web traffic and content performance. It includes elements such as visitors by channel, overall conversion rate, search, direct, referral etc. Explore a selection of the finest KPI Dashboard To Analyze Website Traffic Top Of The Funnel Digital Content Strategy SS V here. With a plethora of professionally designed and pre-made slide templates, you can quickly and easily find the right one for your upcoming presentation. You can use our KPI Dashboard To Analyze Website Traffic Top Of The Funnel Digital Content Strategy SS V to effectively convey your message to a wider audience. Slidegeeks has done a lot of research before preparing these presentation templates. The content can be personalized and the slides are highly editable. Grab templates today from Slidegeeks. The following slide showcases KPI dashboard to assess web traffic and content performance. It includes elements such as visitors by channel, overall conversion rate, search, direct, referral etc.
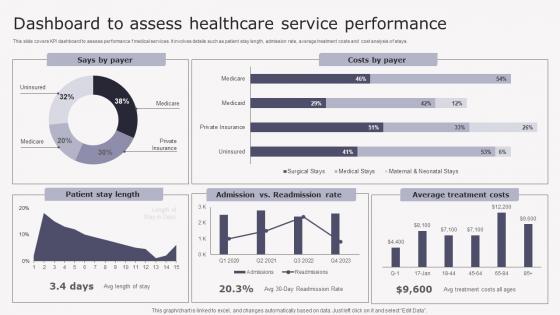
Dashboard To Assess Healthcare Transforming Medicare Services Using Health Background Pdf
This slide covers KPI dashboard to assess performance f medical services. It involves details such as patient stay length, admission rate, average treatment costs and cost analysis of stays. There are so many reasons you need a Dashboard To Assess Healthcare Transforming Medicare Services Using Health Background Pdf. The first reason is you can not spend time making everything from scratch, Thus, Slidegeeks has made presentation templates for you too. You can easily download these templates from our website easily. This slide covers KPI dashboard to assess performance f medical services. It involves details such as patient stay length, admission rate, average treatment costs and cost analysis of stays.
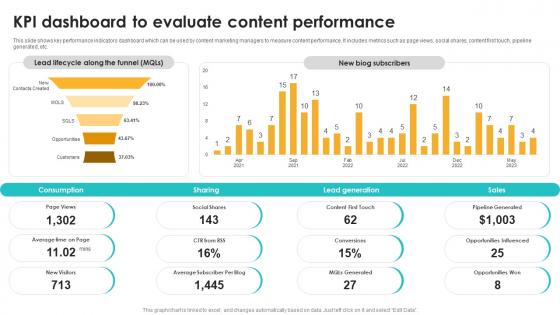
Kpi Dashboard To Evaluate Content Performance Seo Content Plan To Drive Strategy SS V
This slide shows key performance indicators dashboard which can be used by content marketing managers to measure content performance. It includes metrics such as page views, social shares, content first touch, pipeline generated, etc. This Kpi Dashboard To Evaluate Content Performance Seo Content Plan To Drive Strategy SS V is perfect for any presentation, be it in front of clients or colleagues. It is a versatile and stylish solution for organizing your meetings. The Kpi Dashboard To Evaluate Content Performance Seo Content Plan To Drive Strategy SS V features a modern design for your presentation meetings. The adjustable and customizable slides provide unlimited possibilities for acing up your presentation. Slidegeeks has done all the homework before launching the product for you. So, do not wait, grab the presentation templates today This slide shows key performance indicators dashboard which can be used by content marketing managers to measure content performance. It includes metrics such as page views, social shares, content first touch, pipeline generated, etc.
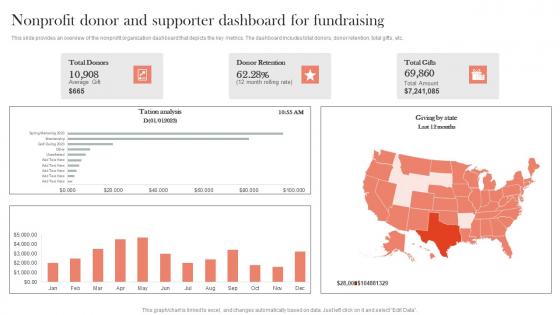
Non profit Donor And Supporter Dashboard For Efficient Nonprofit Marketing Template Pdf
This slide provides an overview of the nonprofit organization dashboard that depicts the key metrics. The dashboard includes total donors, donor retention, total gifts, etc.Create an editable Non profit Donor And Supporter Dashboard For Efficient Nonprofit Marketing Template Pdf that communicates your idea and engages your audience. Whether you are presenting a business or an educational presentation, pre-designed presentation templates help save time. Non profit Donor And Supporter Dashboard For Efficient Nonprofit Marketing Template Pdf is highly customizable and very easy to edit, covering many different styles from creative to business presentations. Slidegeeks has creative team members who have crafted amazing templates. So, go and get them without any delay. This slide provides an overview of the nonprofit organization dashboard that depicts the key metrics. The dashboard includes total donors, donor retention, total gifts, etc.
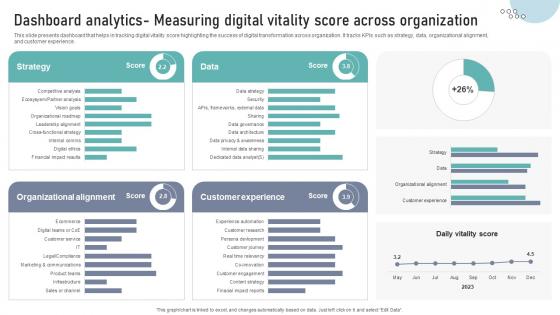
Dashboard Analytics Measuring Digital Vitality Score Across Organization DT SS V
This slide presents dashboard that helps in tracking digital vitality score highlighting the success of digital transformation across organization. It tracks KPIs such as strategy, data, organizational alignment,and customer experience.Make sure to capture your audiences attention in your business displays with our gratis customizable Dashboard Analytics Measuring Digital Vitality Score Across Organization DT SS V. These are great for business strategies, office conferences, capital raising or task suggestions. If you desire to acquire more customers for your tech business and ensure they stay satisfied, create your own sales presentation with these plain slides. This slide presents dashboard that helps in tracking digital vitality score highlighting the success of digital transformation across organization. It tracks KPIs such as strategy, data, organizational alignment,and customer experience.
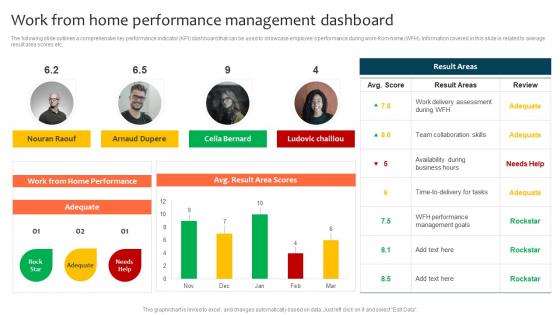
Work From Home Performance Management Dashboard Optimizing Staff Retention Rate Topics Pdf
The following slide outlines a comprehensive key performance indicator KPI dashboard that can be used to showcase employees performance during work-from-home WFH. Information covered in this slide is related to average result area scores etc. This Work From Home Performance Management Dashboard Optimizing Staff Retention Rate Topics Pdf is perfect for any presentation, be it in front of clients or colleagues. It is a versatile and stylish solution for organizing your meetings. The Work From Home Performance Management Dashboard Optimizing Staff Retention Rate Topics Pdf features a modern design for your presentation meetings. The adjustable and customizable slides provide unlimited possibilities for acing up your presentation. Slidegeeks has done all the homework before launching the product for you. So, do not wait, grab the presentation templates today The following slide outlines a comprehensive key performance indicator KPI dashboard that can be used to showcase employees performance during work-from-home WFH. Information covered in this slide is related to average result area scores etc.
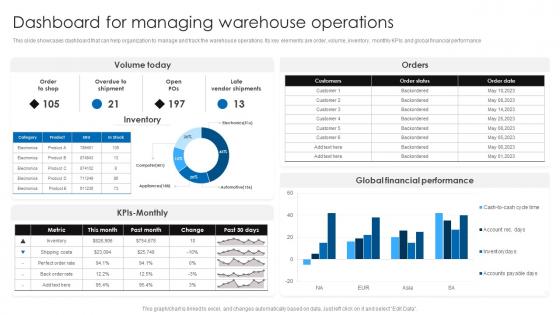
Dashboard For Managing Warehouse Operations Retail Stock Administration Strategies Formats Pdf
This slide showcases dashboard that can help organization to manage and track the warehouse operations. Its key elements are order, volume, inventory, monthly KPIs and global financial performance.Formulating a presentation can take up a lot of effort and time, so the content and message should always be the primary focus. The visuals of the PowerPoint can enhance the presenters message, so our Dashboard For Managing Warehouse Operations Retail Stock Administration Strategies Formats Pdf was created to help save time. Instead of worrying about the design, the presenter can concentrate on the message while our designers work on creating the ideal templates for whatever situation is needed. Slidegeeks has experts for everything from amazing designs to valuable content, we have put everything into Dashboard For Managing Warehouse Operations Retail Stock Administration Strategies Formats Pdf This slide showcases dashboard that can help organization to manage and track the warehouse operations. Its key elements are order, volume, inventory, monthly KPIs and global financial performance
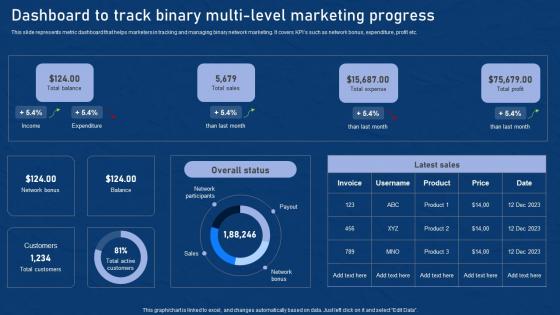
Dashboard To Track Binary Multi Level Effective Network Marketing Promotion Tactics Infographics Pdf
This slide represents metric dashboard that helps marketers in tracking and managing binary network marketing. It covers KPIs such as network bonus, expenditure, profit etc. Here you can discover an assortment of the finest PowerPoint and Google Slides templates. With these templates, you can create presentations for a variety of purposes while simultaneously providing your audience with an eye catching visual experience. Download Dashboard To Track Binary Multi Level Effective Network Marketing Promotion Tactics Infographics Pdf to deliver an impeccable presentation. These templates will make your job of preparing presentations much quicker, yet still, maintain a high level of quality. Slidegeeks has experienced researchers who prepare these templates and write high quality content for you. Later on, you can personalize the content by editing the Dashboard To Track Binary Multi Level Effective Network Marketing Promotion Tactics Infographics Pdf. This slide represents metric dashboard that helps marketers in tracking and managing binary network marketing. It covers KPIs such as network bonus, expenditure, profit etc.
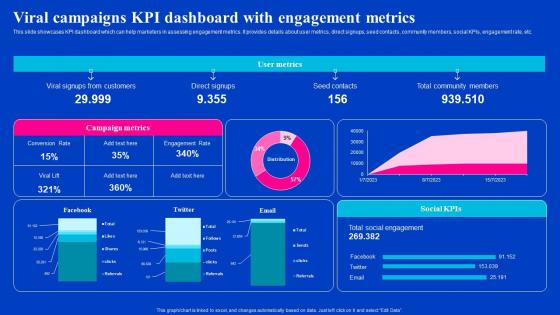
Viral Campaigns KPI Dashboard With Engagement Metrics Viral Video Outreach Plan Diagrams Pdf
This slide showcases KPI dashboard which can help marketers in assessing engagement metrics. It provides details about user metrics, direct signups, seed contacts, community members, social KPIs, engagement rate, etc. Find highly impressive Viral Campaigns KPI Dashboard With Engagement Metrics Viral Video Outreach Plan Diagrams Pdf on Slidegeeks to deliver a meaningful presentation. You can save an ample amount of time using these presentation templates. No need to worry to prepare everything from scratch because Slidegeeks experts have already done a huge research and work for you. You need to download Viral Campaigns KPI Dashboard With Engagement Metrics Viral Video Outreach Plan Diagrams Pdf for your upcoming presentation. All the presentation templates are 100Precent editable and you can change the color and personalize the content accordingly. Download now. This slide showcases KPI dashboard which can help marketers in assessing engagement metrics. It provides details about user metrics, direct signups, seed contacts, community members, social KPIs, engagement rate, etc.
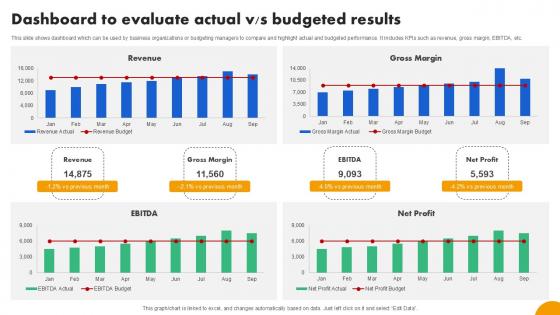
Dashboard To Evaluate Actual Strategies To Develop Effective Ppt PowerPoint Fin SS V
This slide shows dashboard which can be used by business organizations or budgeting managers to compare and highlight actual and budgeted performance. It includes KPIs such as revenue, gross margin, EBITDA, etc. Find highly impressive Dashboard To Evaluate Actual Strategies To Develop Effective Ppt PowerPoint Fin SS V on Slidegeeks to deliver a meaningful presentation. You can save an ample amount of time using these presentation templates. No need to worry to prepare everything from scratch because Slidegeeks experts have already done a huge research and work for you. You need to download Dashboard To Evaluate Actual Strategies To Develop Effective Ppt PowerPoint Fin SS V for your upcoming presentation. All the presentation templates are 100 percent editable and you can change the color and personalize the content accordingly. Download now This slide shows dashboard which can be used by business organizations or budgeting managers to compare and highlight actual and budgeted performance. It includes KPIs such as revenue, gross margin, EBITDA, etc.
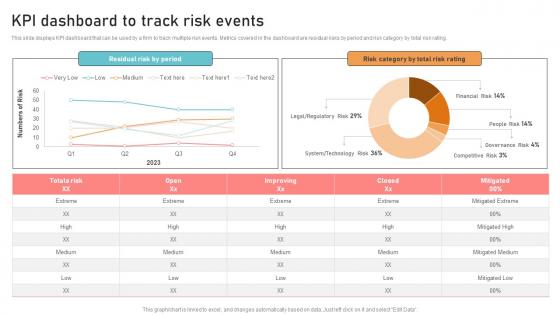
Optimizing Business Integration KPI Dashboard To Track Risk Events Designs Pdf
This slide displays KPI dashboard that can be used by a firm to track multiple risk events. Metrics covered in the dashboard are residual risks by period and risk category by total risk rating. Crafting an eye catching presentation has never been more straightforward. Let your presentation shine with this tasteful yet straightforward Optimizing Business Integration KPI Dashboard To Track Risk Events Designs Pdf template. It offers a minimalistic and classy look that is great for making a statement. The colors have been employed intelligently to add a bit of playfulness while still remaining professional. Construct the ideal Optimizing Business Integration KPI Dashboard To Track Risk Events Designs Pdf that effortlessly grabs the attention of your audience. Begin now and be certain to wow your customers. This slide displays KPI dashboard that can be used by a firm to track multiple risk events. Metrics covered in the dashboard are residual risks by period and risk category by total risk rating.
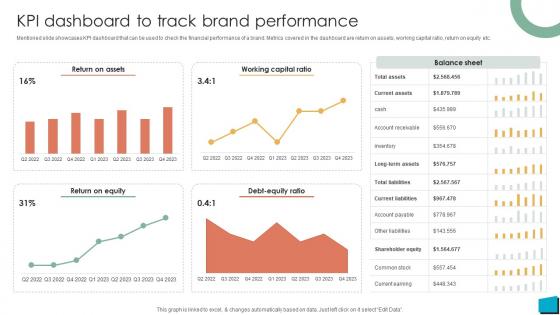
Brand Authority KPI Dashboard To Track Brand Performance Strategy SS V
Mentioned slide showcases KPI dashboard that can be used to check the financial performance of a brand. Metrics covered in the dashboard are return on assets, working capital ratio, return on equity etc. This Brand Authority KPI Dashboard To Track Brand Performance Strategy SS V is perfect for any presentation, be it in front of clients or colleagues. It is a versatile and stylish solution for organizing your meetings. The Brand Authority KPI Dashboard To Track Brand Performance Strategy SS V features a modern design for your presentation meetings. The adjustable and customizable slides provide unlimited possibilities for acing up your presentation. Slidegeeks has done all the homework before launching the product for you. So, do not wait, grab the presentation templates today Mentioned slide showcases KPI dashboard that can be used to check the financial performance of a brand. Metrics covered in the dashboard are return on assets, working capital ratio, return on equity etc.
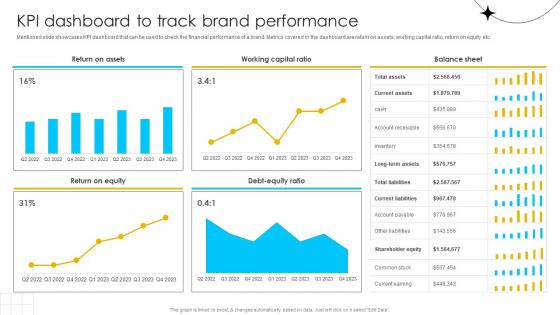
Brand Influence KPI Dashboard To Track Brand Performance Strategy SS V
Mentioned slide showcases KPI dashboard that can be used to check the financial performance of a brand. Metrics covered in the dashboard are return on assets, working capital ratio, return on equity etc. This Brand Influence KPI Dashboard To Track Brand Performance Strategy SS V is perfect for any presentation, be it in front of clients or colleagues. It is a versatile and stylish solution for organizing your meetings. The Brand Influence KPI Dashboard To Track Brand Performance Strategy SS V features a modern design for your presentation meetings. The adjustable and customizable slides provide unlimited possibilities for acing up your presentation. Slidegeeks has done all the homework before launching the product for you. So, do not wait, grab the presentation templates today Mentioned slide showcases KPI dashboard that can be used to check the financial performance of a brand. Metrics covered in the dashboard are return on assets, working capital ratio, return on equity etc.
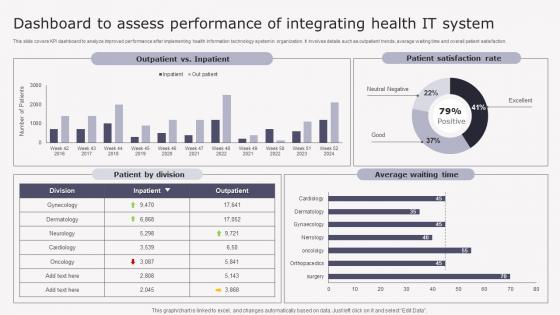
Transforming Medicare Services Using Health Dashboard To Assess Performance Introduction Pdf
This slide covers KPI dashboard to analyze improved performance after implementing health information technology system in organization. It involves details such as outpatient trends, average waiting time and overall patient satisfaction. Do you have to make sure that everyone on your team knows about any specific topic I yes, then you should give Transforming Medicare Services Using Health Dashboard To Assess Performance Introduction Pdf a try. Our experts have put a lot of knowledge and effort into creating this impeccable Transforming Medicare Services Using Health Dashboard To Assess Performance Introduction Pdf. You can use this template for your upcoming presentations, as the slides are perfect to represent even the tiniest detail. You can download these templates from the Slidegeeks website and these are easy to edit. So grab these today This slide covers KPI dashboard to analyze improved performance after implementing health information technology system in organization. It involves details such as outpatient trends, average waiting time and overall patient satisfaction.
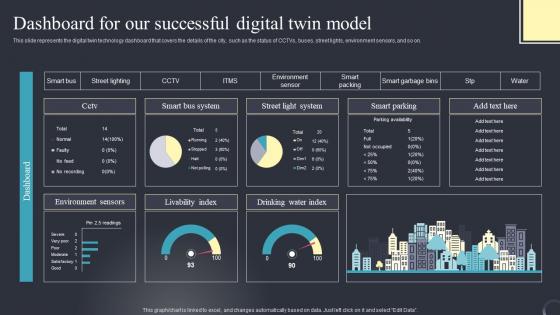
Dashboard For Our Successful Industrial Transformation Using Digital Twin Pictures Pdf
This slide represents the digital twin technology dashboard that covers the details of the city, such as the status of CCTVs, buses, street lights, environment sensors, and so on. Do you have an important presentation coming up Are you looking for something that will make your presentation stand out from the rest Look no further than Dashboard For Our Successful Industrial Transformation Using Digital Twin Pictures Pdf. With our professional designs, you can trust that your presentation will pop and make delivering it a smooth process. And with Slidegeeks, you can trust that your presentation will be unique and memorable. So why wait Grab Dashboard For Our Successful Industrial Transformation Using Digital Twin Pictures Pdf today and make your presentation stand out from the rest This slide represents the digital twin technology dashboard that covers the details of the city, such as the status of CCTVs, buses, street lights, environment sensors, and so on.
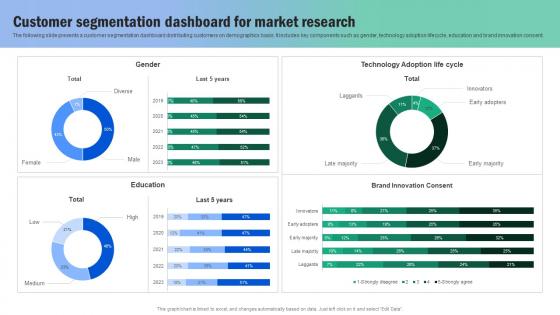
Customer Segmentation Dashboard For Market Research Guide For Segmenting And Formulating Designs Pdf
The following slide presents a customer segmentation dashboard distributing customers on demographics basis. It includes key components such as gender, technology adoption lifecycle, education and brand innovation consent. Do you have to make sure that everyone on your team knows about any specific topic I yes, then you should give Customer Segmentation Dashboard For Market Research Guide For Segmenting And Formulating Designs Pdf a try. Our experts have put a lot of knowledge and effort into creating this impeccable Customer Segmentation Dashboard For Market Research Guide For Segmenting And Formulating Designs Pdf. You can use this template for your upcoming presentations, as the slides are perfect to represent even the tiniest detail. You can download these templates from the Slidegeeks website and these are easy to edit. So grab these today. The following slide presents a customer segmentation dashboard distributing customers on demographics basis. It includes key components such as gender, technology adoption lifecycle, education and brand innovation consent.


 Continue with Email

 Home
Home


