Data
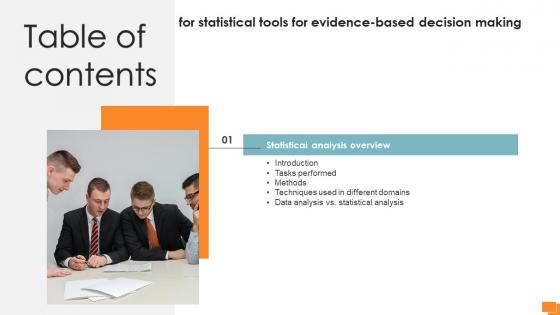
Table Of Contents Statistical Tools For Evidence Based Decision Making
Do you have an important presentation coming up Are you looking for something that will make your presentation stand out from the rest Look no further than Table Of Contents Statistical Tools For Evidence Based Decision Making. With our professional designs, you can trust that your presentation will pop and make delivering it a smooth process. And with Slidegeeks, you can trust that your presentation will be unique and memorable. So why wait Grab Table Of Contents Statistical Tools For Evidence Based Decision Making today and make your presentation stand out from the rest Our Table Of Contents Statistical Tools For Evidence Based Decision Making are topically designed to provide an attractive backdrop to any subject. Use them to look like a presentation pro.
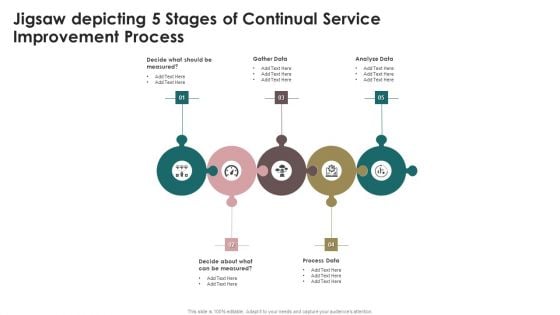
Jigsaw Depicting 5 Stages Of Continual Service Improvement Process Elements PDF
Presenting Jigsaw Depicting 5 Stages Of Continual Service Improvement Process Elements PDF to dispense important information. This template comprises five stages. It also presents valuable insights into the topics including Gather Data, Analyze Data, Process Data. This is a completely customizable PowerPoint theme that can be put to use immediately. So, download it and address the topic impactfully.
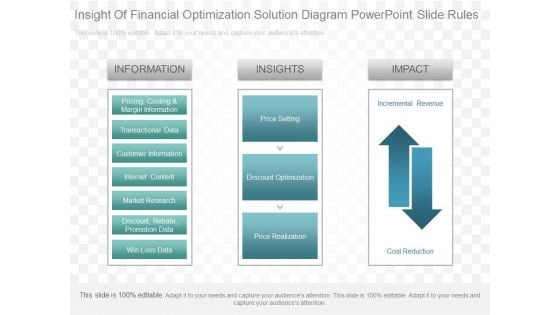
Insight Of Financial Optimization Solution Diagram Powerpoint Slide Rules
This is a insight of financial optimization solution diagram powerpoint slide rules. This is a three stage process. The stages in this process are information, pricing, costing and margin information, transactional data, customer information, internet content, market research, discount, rebate, promotion data, win loss data, insights, price setting, discount optimization, price realization, impact, incremental revenue, cost reduction.
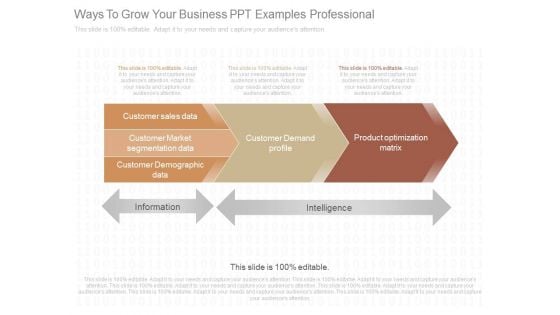
Ways To Grow Your Business Ppt Examples Professional
This is a ways to grow your business ppt examples professional. This is a three stage process. The stages in this process are information, intelligence, customer sales data, customer market segmentation data, customer demographic data, customer demand profile, product optimization matrix.
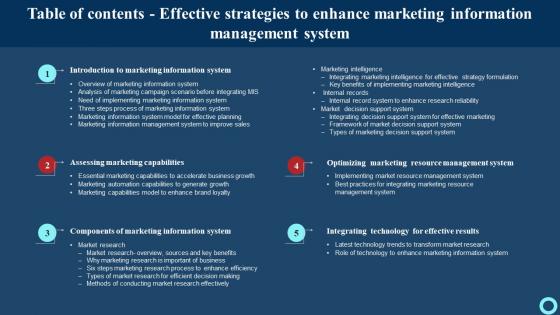
Table Of Contents Effective Strategies To Enhance Marketing Information Management System Pictures Pdf
Retrieve professionally designed Table Of Contents Effective Strategies To Enhance Marketing Information Management System Pictures Pdf to effectively convey your message and captivate your listeners. Save time by selecting pre-made slideshows that are appropriate for various topics, from business to educational purposes. These themes come in many different styles, from creative to corporate, and all of them are easily adjustable and can be edited quickly. Access them as PowerPoint templates or as Google Slides themes. You do not have to go on a hunt for the perfect presentation because Slidegeeks got you covered from everywhere. Our Table Of Contents Effective Strategies To Enhance Marketing Information Management System Pictures Pdf are topically designed to provide an attractive backdrop to any subject. Use them to look like a presentation pro.
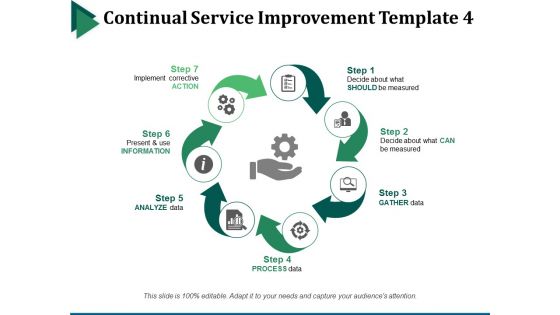
Continual Service Improvement Template 4 Ppt PowerPoint Presentation Portfolio Styles
This is a continual service improvement template 4 ppt powerpoint presentation portfolio styles. This is a seven stage process. The stages in this process are decide about what should be measured, decide about what can be measured, gather data, process data, analyze data.
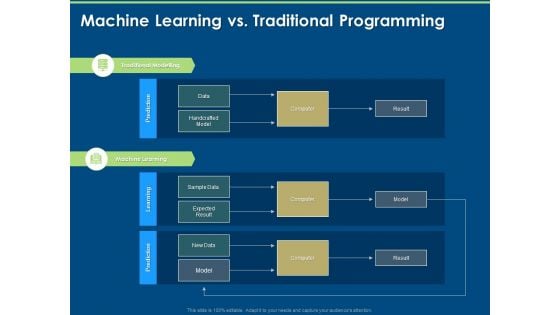
Machine Learning Implementation And Case Studymachine Learning Vs Traditional Programming Ppt Pictures Graphics Tutorials PDF
Presenting this set of slides with name machine learning implementation and case studymachine learning vs traditional programming ppt pictures graphics tutorials pdf. This is a one stage process. The stages in this process are data, handcrafted, model, sample data, expected, new data, computer, prediction, learning. This is a completely editable PowerPoint presentation and is available for immediate download. Download now and impress your audience.
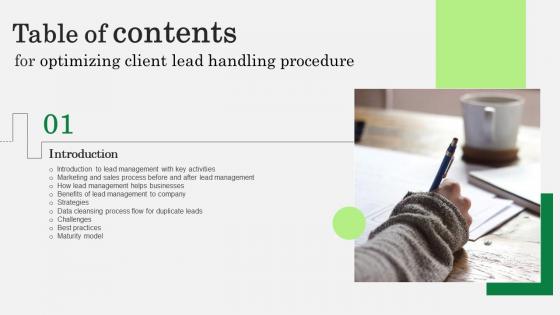
Optimizing Client Lead Handling Procedure Table Of Contents Infographics Pdf
There are so many reasons you need a Optimizing Client Lead Handling Procedure Table Of Contents Infographics Pdf. The first reason is you can not spend time making everything from scratch, Thus, Slidegeeks has made presentation templates for you too. You can easily download these templates from our website easily. Our Optimizing Client Lead Handling Procedure Table Of Contents Infographics Pdf are topically designed to provide an attractive backdrop to any subject. Use them to look like a presentation pro.
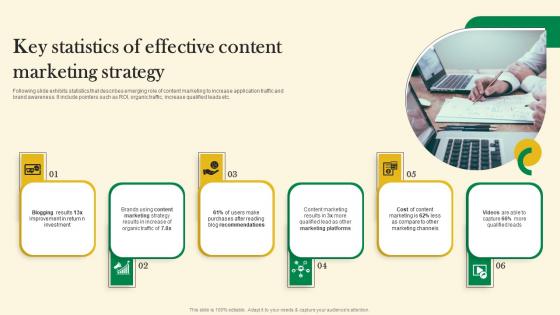
Key Statistics Of Effective Content Marketing Strategy Online Customer Acquisition Brochure Pdf
Following slide exhibits statistics that describes emerging role of content marketing to increase application traffic and brand awareness. It include pointers such as ROI, organic traffic, increase qualified leads etc. Find highly impressive Key Statistics Of Effective Content Marketing Strategy Online Customer Acquisition Brochure Pdf on Slidegeeks to deliver a meaningful presentation. You can save an ample amount of time using these presentation templates. No need to worry to prepare everything from scratch because Slidegeeks experts have already done a huge research and work for you. You need to download Key Statistics Of Effective Content Marketing Strategy Online Customer Acquisition Brochure Pdf for your upcoming presentation. All the presentation templates are 100 percent editable and you can change the color and personalize the content accordingly. Download now. Following slide exhibits statistics that describes emerging role of content marketing to increase application traffic and brand awareness. It include pointers such as ROI, organic traffic, increase qualified leads etc.
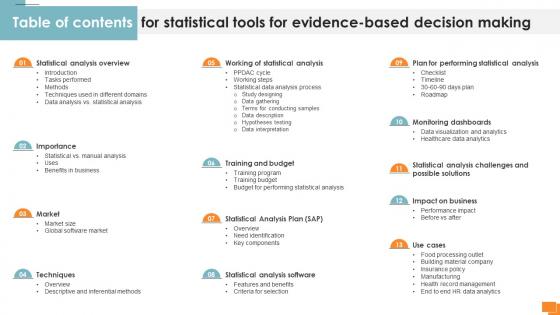
Table Of Contents For Statistical Tools For Evidence Based Decision Making
Slidegeeks is here to make your presentations a breeze with Table Of Contents For Statistical Tools For Evidence Based Decision Making With our easy-to-use and customizable templates, you can focus on delivering your ideas rather than worrying about formatting. With a variety of designs to choose from, you are sure to find one that suits your needs. And with animations and unique photos, illustrations, and fonts, you can make your presentation pop. So whether you are giving a sales pitch or presenting to the board, make sure to check out Slidegeeks first Our Table Of Contents For Statistical Tools For Evidence Based Decision Making are topically designed to provide an attractive backdrop to any subject. Use them to look like a presentation pro.
Key Statistics And Figures Of Referral Promotional Program Icons PDF
This slide provides an overview of the referral advertising stats. Major stats covered are generate the best leads, ensure high conversion, referrals from family and friends are more trusted, influences buying decisions, etc. Want to ace your presentation in front of a live audience Our Key Statistics And Figures Of Referral Promotional Program Icons PDF can help you do that by engaging all the users towards you.. Slidegeeks experts have put their efforts and expertise into creating these impeccable powerpoint presentations so that you can communicate your ideas clearly. Moreover, all the templates are customizable, and easy-to-edit and downloadable. Use these for both personal and commercial use.

Key Statistics Associated With Marketing Technology Comprehensive Guide For Marketing Technology
Mentioned slide provides information about key stats associated with marketing technology. It includes statistics such as average number of marketing tools user per enterprise, marketing tools vendors, industry growth, etc.Want to ace your presentation in front of a live audience Our Key Statistics Associated With Marketing Technology Comprehensive Guide For Marketing Technology can help you do that by engaging all the users towards you. Slidegeeks experts have put their efforts and expertise into creating these impeccable powerpoint presentations so that you can communicate your ideas clearly. Moreover, all the templates are customizable, and easy-to-edit and downloadable. Use these for both personal and commercial use. Mentioned slide provides information about key stats associated with marketing technology. It includes statistics such as average number of marketing tools user per enterprise, marketing tools vendors, industry growth, etc.
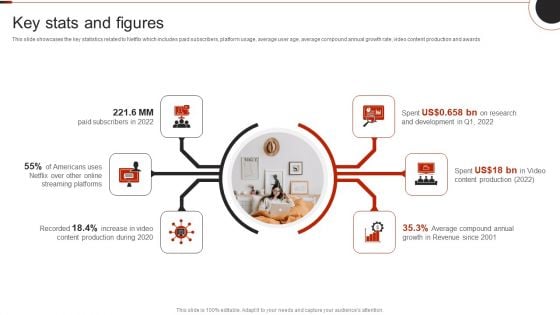
Netflix Company Outline Key Stats And Figures Formats PDF
This slide showcases the key statistics related to Netflix which includes paid subscribers, platform usage, average user age, average compound annual growth rate, video content production and awards.This is a Netflix Company Outline Key Stats And Figures Formats PDF template with various stages. Focus and dispense information on six stages using this creative set, that comes with editable features. It contains large content boxes to add your information on topics like Streaming Platforms, Content Production, Average Compound. You can also showcase facts, figures, and other relevant content using this PPT layout. Grab it now.
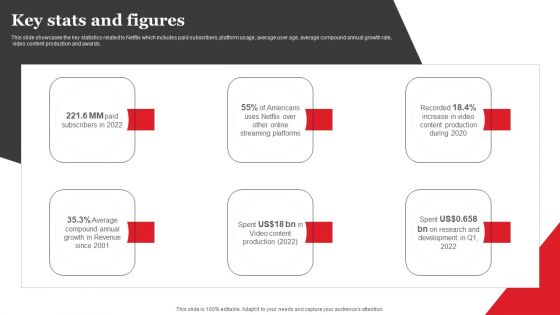
Streaming Platform Company Outline Key Stats And Figures Background PDF
This slide showcases the key statistics related to Netflix which includes paid subscribers, platform usage, average user age, average compound annual growth rate, video content production and awards. There are so many reasons you need a Streaming Platform Company Outline Key Stats And Figures Background PDF. The first reason is you can not spend time making everything from scratch, Thus, Slidegeeks has made presentation templates for you too. You can easily download these templates from our website easily.
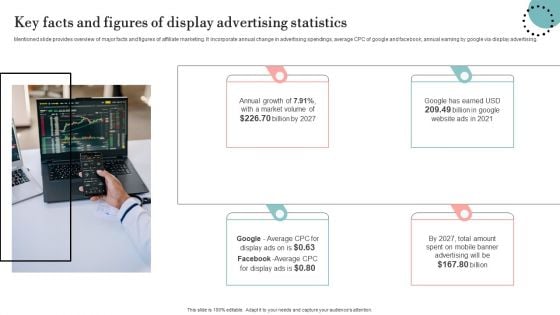
Key Facts And Figures Of Display Advertising Statistics Brochure PDF
Mentioned slide provides overview of major facts and figures of affiliate marketing. It incorporate annual change in advertising spendings, average CPC of google and facebook, annual earning by google via display advertising. Slidegeeks has constructed Key Facts And Figures Of Display Advertising Statistics Brochure PDF after conducting extensive research and examination. These presentation templates are constantly being generated and modified based on user preferences and critiques from editors. Here, you will find the most attractive templates for a range of purposes while taking into account ratings and remarks from users regarding the content. This is an excellent jumping off point to explore our content and will give new users an insight into our top notch PowerPoint Templates.
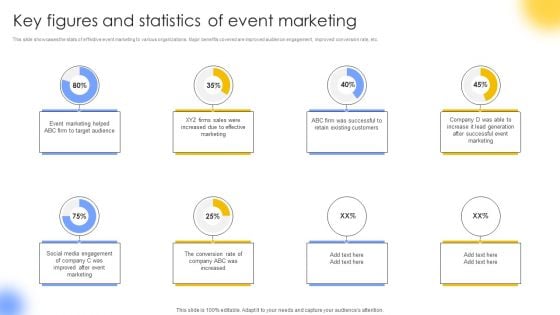
Key Figures And Statistics Of Event Marketing Portrait PDF
This slide showcases the stats of effective event marketing to various organizations. Major benefits covered are improved audience engagement, improved conversion rate, etc. If you are looking for a format to display your unique thoughts, then the professionally designed Key Figures And Statistics Of Event Marketing Portrait PDF is the one for you. You can use it as a Google Slides template or a PowerPoint template. Incorporate impressive visuals, symbols, images, and other charts. Modify or reorganize the text boxes as you desire. Experiment with shade schemes and font pairings. Alter, share or cooperate with other people on your work. Download Key Figures And Statistics Of Event Marketing Portrait PDF and find out how to give a successful presentation. Present a perfect display to your team and make your presentation unforgettable.
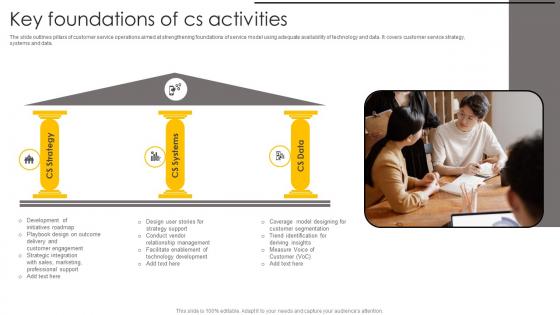
Key Foundations Of Cs Activities Mockup Pdf
The slide outlines pillars of customer service operations aimed at strengthening foundations of service model using adequate availability of technology and data. It covers customer service strategy, systems and data. Showcasing this set of slides titled Key Foundations Of Cs Activities Mockup Pdf. The topics addressed in these templates are Strategy, Systems, Data. All the content presented in this PPT design is completely editable. Download it and make adjustments in color, background, font etc. as per your unique business setting. The slide outlines pillars of customer service operations aimed at strengthening foundations of service model using adequate availability of technology and data. It covers customer service strategy, systems and data.
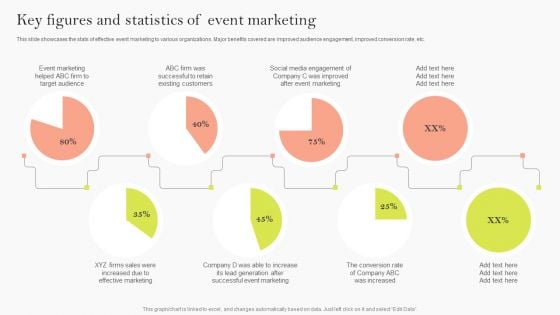
Key Figures And Statistics Of Event Marketing Ppt Backgrounds PDF
This slide showcases the stats of effective event marketing to various organizations. Major benefits covered are improved audience engagement, improved conversion rate, etc. Are you in need of a template that can accommodate all of your creative concepts This one is crafted professionally and can be altered to fit any style. Use it with Google Slides or PowerPoint. Include striking photographs, symbols, depictions, and other visuals. Fill, move around, or remove text boxes as desired. Test out color palettes and font mixtures. Edit and save your work, or work with colleagues. Download Key Figures And Statistics Of Event Marketing Ppt Backgrounds PDF and observe how to make your presentation outstanding. Give an impeccable presentation to your group and make your presentation unforgettable.
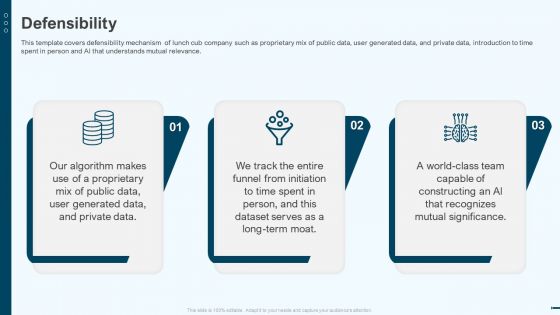
Defensibility Lunchclub Investor Capitalizing Elevator Clipart Pdf
This template covers defensibility mechanism of lunch cub company such as proprietary mix of public data, user generated data, and private data, introduction to time spent in person and Al that understands mutual relevance. Presenting defensibility lunchclub investor capitalizing elevator clipart pdf to provide visual cues and insights. Share and navigate important information on three stages that need your due attention. This template can be used to pitch topics like private data, public data, defensibility. In addtion, this PPT design contains high resolution images, graphics, etc, that are easily editable and available for immediate download.
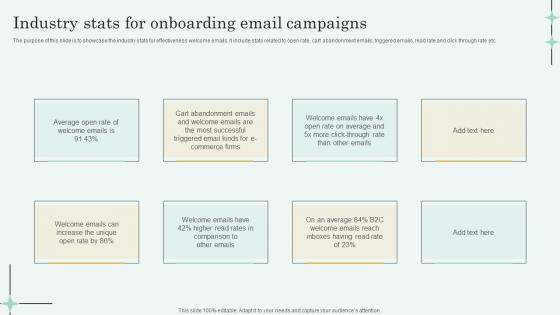
Industry Stats For Onboarding Email Campaigns Information Pdf
The purpose of this slide is to showcase the industry stats for effectiveness welcome emails. It include stats related to open rate, cart abandonment emails, triggered emails, read rate and click through rate etc. Pitch your topic with ease and precision using this Industry Stats For Onboarding Email Campaigns Information Pdf. This layout presents information on Average Open Rate, Cart Abandonment Emails, Welcome Emails Increase. It is also available for immediate download and adjustment. So, changes can be made in the color, design, graphics or any other component to create a unique layout. The purpose of this slide is to showcase the industry stats for effectiveness welcome emails. It include stats related to open rate, cart abandonment emails, triggered emails, read rate and click through rate etc.
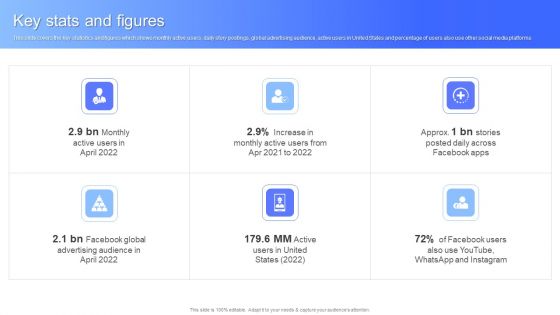
Key Stats And Figures Facebook Business Outline Sample PDF
This slide covers the key statistics and figures which shows monthly active users, daily story postings, global advertising audience, active users in United States and percentage of users also use other social media platforms. Presenting Key Stats And Figures Facebook Business Outline Sample PDF to provide visual cues and insights. Share and navigate important information on six stages that need your due attention. This template can be used to pitch topics like Key Stats And Figures. In addtion, this PPT design contains high resolution images, graphics, etc, that are easily editable and available for immediate download.
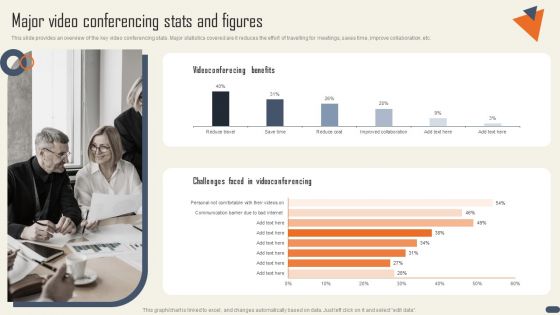
Networking Events Major Video Conferencing Stats And Figures Summary PDF
This slide provides an overview of the key video conferencing stats. Major statistics covered are it reduces the effort of travelling for meetings, saves time, improve collaboration, etc. The best PPT templates are a great way to save time, energy, and resources. Slidegeeks have 100 percent editable powerpoint slides making them incredibly versatile. With these quality presentation templates, you can create a captivating and memorable presentation by combining visually appealing slides and effectively communicating your message. Download Networking Events Major Video Conferencing Stats And Figures Summary PDF from Slidegeeks and deliver a wonderful presentation.
Twitter Company Summary Key Stats And Figures Icons PDF
This slide represents the key stats and figures related to Twitter which includes total active users from United States, average session time, percentage of businesses use Twitter, etc. Presenting Twitter Company Summary Key Stats And Figures Icons PDF to provide visual cues and insights. Share and navigate important information on six stages that need your due attention. This template can be used to pitch topics like Average, digital marketing tool, expand professional network. In addtion, this PPT design contains high resolution images, graphics, etc, that are easily editable and available for immediate download.
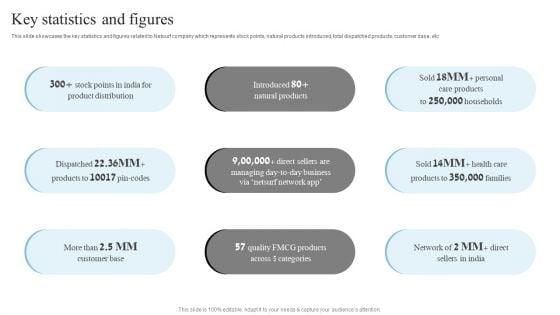
Network Marketing Company Profile Key Statistics And Figures Professional PDF
This slide showcases the key statistics and figures related to Netsurf company which represents stock points, natural products introduced, total dispatched products, customer base, etc Slidegeeks is one of the best resources for PowerPoint templates. You can download easily and regulate Network Marketing Company Profile Key Statistics And Figures Professional PDF for your personal presentations from our wonderful collection. A few clicks is all it takes to discover and get the most relevant and appropriate templates. Use our Templates to add a unique zing and appeal to your presentation and meetings. All the slides are easy to edit and you can use them even for advertisement purposes.

Overview And Key Statistics Of Content Marketing Paid Marketing Approach Template Pdf
Following slide provide information about content marketing strategy to increase application organic traffic. It further covers description, benefits such as better market position, brand awareness etc. Boost your pitch with our creative Overview And Key Statistics Of Content Marketing Paid Marketing Approach Template Pdf Deliver an awe-inspiring pitch that will mesmerize everyone. Using these presentation templates you will surely catch everyones attention. You can browse the ppts collection on our website. We have researchers who are experts at creating the right content for the templates. So you do not have to invest time in any additional work. Just grab the template now and use them. Following slide provide information about content marketing strategy to increase application organic traffic. It further covers description, benefits such as better market position, brand awareness etc.
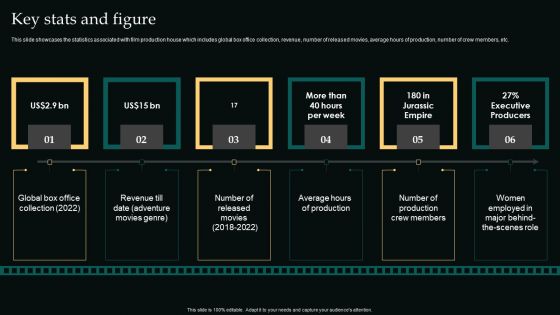
Key Stats And Figure Movie Editing Company Outline Ideas PDF
This slide showcases the statistics associated with film production house which includes global box office collection, revenue, number of released movies, average hours of production, number of crew members, etc. Retrieve professionally designed Key Stats And Figure Movie Editing Company Outline Ideas PDF to effectively convey your message and captivate your listeners. Save time by selecting pre-made slideshows that are appropriate for various topics, from business to educational purposes. These themes come in many different styles, from creative to corporate, and all of them are easily adjustable and can be edited quickly. Access them as PowerPoint templates or as Google Slides themes. You donot have to go on a hunt for the perfect presentation because Slidegeeks got you covered from everywhere.
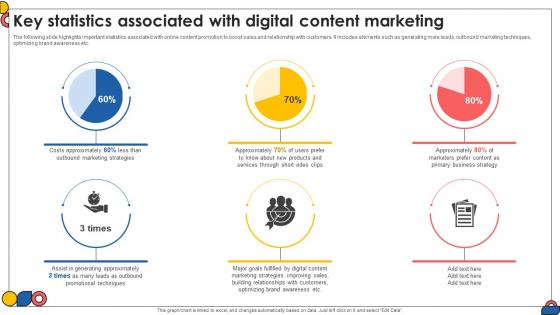
Key Statistics Associated With Digital Content Marketing Comprehensive Guide To Implement Strategy SS V
The following slide highlights important statistics associated with online content promotion to boost sales and relationship with customers. It includes elements such as generating more leads, outbound marketing techniques, optimizing brand awareness etc. Explore a selection of the finest Key Statistics Associated With Digital Content Marketing Comprehensive Guide To Implement Strategy SS V here. With a plethora of professionally designed and pre-made slide templates, you can quickly and easily find the right one for your upcoming presentation. You can use our Key Statistics Associated With Digital Content Marketing Comprehensive Guide To Implement Strategy SS V to effectively convey your message to a wider audience. Slidegeeks has done a lot of research before preparing these presentation templates. The content can be personalized and the slides are highly editable. Grab templates today from Slidegeeks. The following slide highlights important statistics associated with online content promotion to boost sales and relationship with customers. It includes elements such as generating more leads, outbound marketing techniques, optimizing brand awareness etc.
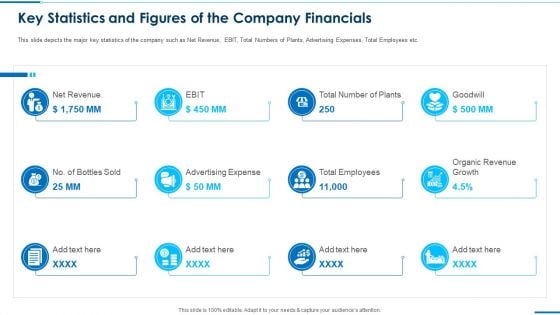
Key Statistics And Figures Of The Company Financials Pictures Pdf
This is a key statistics and figures of the company financials pictures pdf. template with various stages. Focus and dispense information on tweleve stages using this creative set, that comes with editable features. It contains large content boxes to add your information on topics like net revenue, advertising expense, total employees, organic revenue growth, ebit. You can also showcase facts, figures, and other relevant content using this PPT layout. Grab it now.
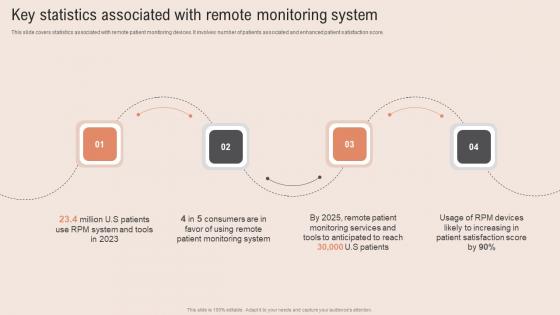
Key Statistics Associated Healthcare Information Tech To Enhance Medical Facilities Rules Pdf
This slide covers process to optimize patient portal system to improve medical efficiency. It involves key steps such as determine portals features, gather skilled developer team and plan project and control execution. This slide covers statistics associated with remote patient monitoring devices. It involves number of patients associated and enhanced patient satisfaction score. The Key Statistics Associated Healthcare Information Tech To Enhance Medical Facilities Rules Pdf is a compilation of the most recent design trends as a series of slides. It is suitable for any subject or industry presentation, containing attractive visuals and photo spots for businesses to clearly express their messages. This template contains a variety of slides for the user to input data, such as structures to contrast two elements, bullet points, and slides for written information. Slidegeeks is prepared to create an impression. This slide covers process to optimize patient portal system to improve medical efficiency. It involves key steps such as determine portals features, gather skilled developer team and plan project and control execution.This slide covers statistics associated with remote patient monitoring devices. It involves number of patients associated and enhanced patient satisfaction score.

Statistical Tools For Evidence Before Vs After Performing Statistical Analysis
This slide shows the before vs. after comparison of statistical analysis of business data. The different aspects compared in this slide are decision-making, operational efficiency, customer insights, product quality, revenue generation, supply chain efficiency, etc. Get a simple yet stunning designed Statistical Tools For Evidence Before Vs After Performing Statistical Analysis. It is the best one to establish the tone in your meetings. It is an excellent way to make your presentations highly effective. So, download this PPT today from Slidegeeks and see the positive impacts. Our easy-to-edit Statistical Tools For Evidence Before Vs After Performing Statistical Analysis can be your go-to option for all upcoming conferences and meetings. So, what are you waiting for Grab this template today. This slide shows the before vs. after comparison of statistical analysis of business data. The different aspects compared in this slide are decision-making, operational efficiency, customer insights, product quality, revenue generation, supply chain efficiency, etc.

SEO Strategy To Improve ROI Quarterly SEO Content Audit Action Plan Strategy SS V
The following slide highlights quarter wise SEO content audit approaches to optimize site reach. It includes major activities such as developing unique brand identity, drafting and executing strategy, planning administration framework etc. Slidegeeks has constructed SEO Strategy To Improve ROI Quarterly SEO Content Audit Action Plan Strategy SS V after conducting extensive research and examination. These presentation templates are constantly being generated and modified based on user preferences and critiques from editors. Here, you will find the most attractive templates for a range of purposes while taking into account ratings and remarks from users regarding the content. This is an excellent jumping-off point to explore our content and will give new users an insight into our top-notch PowerPoint Templates. The following slide highlights quarter wise SEO content audit approaches to optimize site reach. It includes major activities such as developing unique brand identity, drafting and executing strategy, planning administration framework etc.
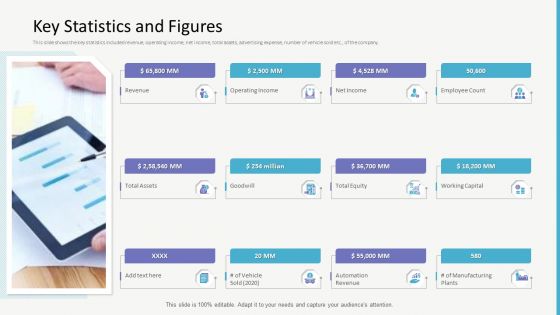
Investor Gap Financing Key Statistics And Figures Structure PDF
This slide shows the key statistics included revenue, operating income, net income, total assets, advertising expense, number of vehicle sold etc., of the company. This is a investor gap financing key statistics and figures structure pdf template with various stages. Focus and dispense information on twelve stages using this creative set, that comes with editable features. It contains large content boxes to add your information on topics like revenue, operating income, employee count. You can also showcase facts, figures, and other relevant content using this PPT layout. Grab it now.
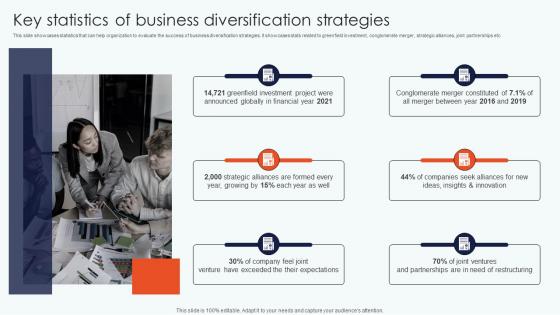
Key Statistics Business Diversification Leveraging Horizontal Vertical Diversification Entering Topics Pdf
This slide showcases statistics that can help organization to evaluate the success of business diversification strategies. It showcases stats related to greenfield investment, conglomerate merger, strategic alliances, joint partnerships etc The best PPT templates are a great way to save time, energy, and resources. Slidegeeks have 100 percent editable powerpoint slides making them incredibly versatile. With these quality presentation templates, you can create a captivating and memorable presentation by combining visually appealing slides and effectively communicating your message. Download Key Statistics Business Diversification Leveraging Horizontal Vertical Diversification Entering Topics Pdf from Slidegeeks and deliver a wonderful presentation. This slide showcases statistics that can help organization to evaluate the success of business diversification strategies. It showcases stats related to greenfield investment, conglomerate merger, strategic alliances, joint partnerships etc
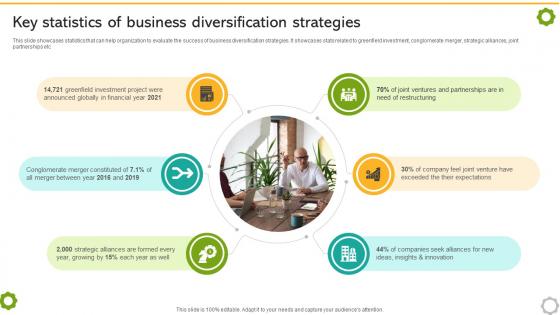
Related And Unrelated Business Key Statistics Of Business Diversification Strategies Strategy SS V
This slide showcases statistics that can help organization to evaluate the success of business diversification strategies. It showcases stats related to greenfield investment, conglomerate merger, strategic alliances, joint partnerships etc. Retrieve professionally designed Related And Unrelated Business Key Statistics Of Business Diversification Strategies Strategy SS V to effectively convey your message and captivate your listeners. Save time by selecting pre-made slideshows that are appropriate for various topics, from business to educational purposes. These themes come in many different styles, from creative to corporate, and all of them are easily adjustable and can be edited quickly. Access them as PowerPoint templates or as Google Slides themes. You do not have to go on a hunt for the perfect presentation because Slidegeeks got you covered from everywhere. This slide showcases statistics that can help organization to evaluate the success of business diversification strategies. It showcases stats related to greenfield investment, conglomerate merger, strategic alliances, joint partnerships etc.
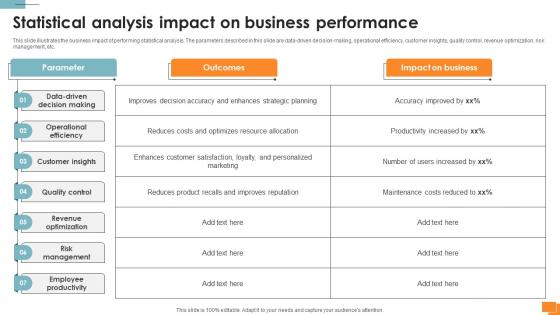
Statistical Tools For Evidence Statistical Analysis Impact On Business Performance
This slide illustrates the business impact of performing statistical analysis. The parameters described in this slide are data-driven decision-making, operational efficiency, customer insights, quality control, revenue optimization, risk management, etc. Do you know about Slidesgeeks Statistical Tools For Evidence Statistical Analysis Impact On Business Performance These are perfect for delivering any kind od presentation. Using it, create PowerPoint presentations that communicate your ideas and engage audiences. Save time and effort by using our pre-designed presentation templates that are perfect for a wide range of topic. Our vast selection of designs covers a range of styles, from creative to business, and are all highly customizable and easy to edit. Download as a PowerPoint template or use them as Google Slides themes. This slide illustrates the business impact of performing statistical analysis. The parameters described in this slide are data-driven decision-making, operational efficiency, customer insights, quality control, revenue optimization, risk management, etc.

Word Of Mouth Marketing Statistics Techniques For Generating Brand Awareness Designs Pdf
This slide covers current WOM marketing stats such as percent of customers believing suggestions from friends and family, percent of small businesses selecting software based on recommendations, percent spending of consumers acquired through WOM, annual global spending through word of mouth marketing, etc. Find highly impressive Word Of Mouth Marketing Statistics Techniques For Generating Brand Awareness Designs Pdf on Slidegeeks to deliver a meaningful presentation. You can save an ample amount of time using these presentation templates. No need to worry to prepare everything from scratch because Slidegeeks experts have already done a huge research and work for you. You need to download Word Of Mouth Marketing Statistics Techniques For Generating Brand Awareness Designs Pdf for your upcoming presentation. All the presentation templates are 100 percent editable and you can change the color and personalize the content accordingly. Download now This slide covers current WOM marketing stats such as percent of customers believing suggestions from friends and family, percent of small businesses selecting software based on recommendations, percent spending of consumers acquired through WOM, annual global spending through word of mouth marketing, etc.

Quarterly Product Impact Assessment Timeline Through Business Strategies Demonstration Pdf
This slide shows the assessment timeline for quarterly product impact via business strategies. The purpose of this slide is to launch expected product on market deadlines. It includes the process of ideation, concept, testing and release on quarterly basis. Pitch your topic with ease and precision using this Quarterly Product Impact Assessment Timeline Through Business Strategies Demonstration Pdf This layout presents information on Ideation, Concept, Release, Testing It is also available for immediate download and adjustment. So, changes can be made in the color, design, graphics or any other component to create a unique layout. This slide shows the assessment timeline for quarterly product impact via business strategies. The purpose of this slide is to launch expected product on market deadlines. It includes the process of ideation, concept, testing and release on quarterly basis.
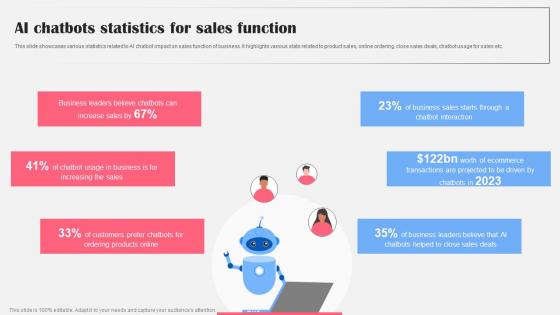
AI Chatbots Statistics For Sales Function AI Bot Application For Various Industries Download Pdf
This slide showcases various statistics related to AI chatbot impact on sales function of business. It highlights various stats related to product sales, online ordering, close sales deals, chatbot usage for sales etc. Do you have to make sure that everyone on your team knows about any specific topic I yes, then you should give AI Chatbots Statistics For Sales Function AI Bot Application For Various Industries Download Pdf a try. Our experts have put a lot of knowledge and effort into creating this impeccable AI Chatbots Statistics For Sales Function AI Bot Application For Various Industries Download Pdf. You can use this template for your upcoming presentations, as the slides are perfect to represent even the tiniest detail. You can download these templates from the Slidegeeks website and these are easy to edit. So grab these today This slide showcases various statistics related to AI chatbot impact on sales function of business. It highlights various stats related to product sales, online ordering, close sales deals, chatbot usage for sales etc.
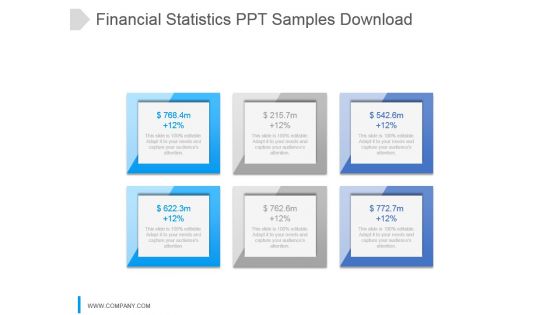
Financial Statistics Ppt Samples Download
This is a financial statistics ppt samples download. This is a six stage process. The stages in this process are business, finance, percentage, dollar, data.
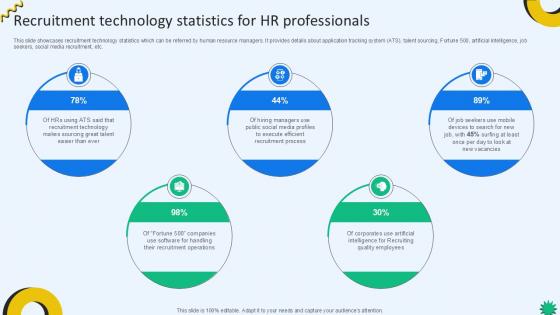
Recruitment Technology Statistics Cloud Recruiting Technologies PPT PowerPoint
This slide showcases recruitment technology statistics which can be referred by human resource managers. It provides details about application tracking system ATS, talent sourcing, Fortune 500, artificial intelligence, job seekers, social media recruitment, etc. Slidegeeks has constructed Recruitment Technology Statistics Cloud Recruiting Technologies PPT PowerPoint after conducting extensive research and examination. These presentation templates are constantly being generated and modified based on user preferences and critiques from editors. Here, you will find the most attractive templates for a range of purposes while taking into account ratings and remarks from users regarding the content. This is an excellent jumping-off point to explore our content and will give new users an insight into our top-notch PowerPoint Templates. This slide showcases recruitment technology statistics which can be referred by human resource managers. It provides details about application tracking system ATS, talent sourcing, Fortune 500, artificial intelligence, job seekers, social media recruitment, etc.
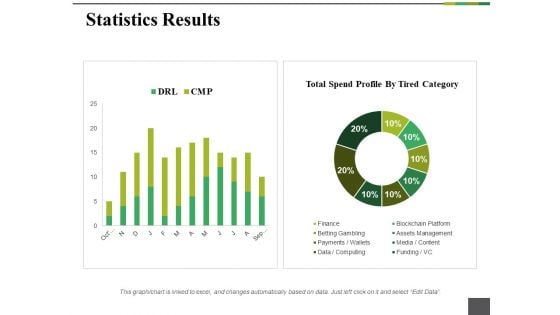
Statistics Results Ppt PowerPoint Presentation Summary Example
This is a statistics results ppt powerpoint presentation summary example. This is a two stage process. The stages in this process are finance, media, data, assets, funding.
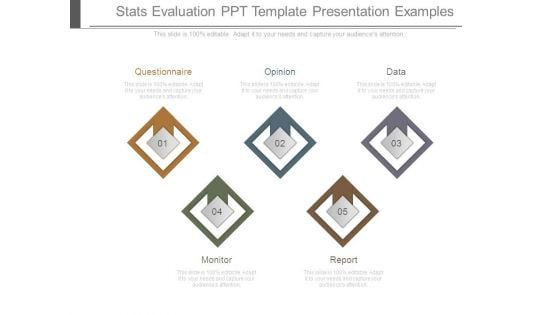
Stats Evaluation Ppt Template Presentation Examples
This is a stats evaluation ppt template presentation examples. This is a five stage process. The stages in this process are questionnaire, opinion, data, monitor, report.
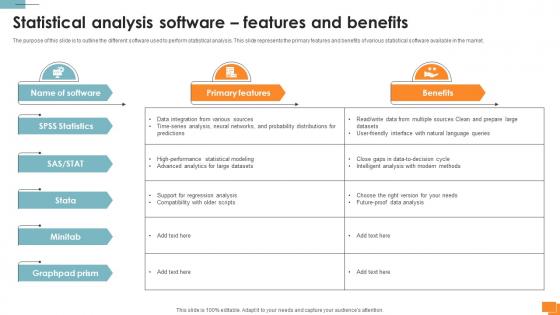
Statistical Tools For Evidence Statistical Analysis Software Features And Benefits
The purpose of this slide is to outline the different software used to perform statistical analysis. This slide represents the primary features and benefits of various statistical software available in the market. Boost your pitch with our creative Statistical Tools For Evidence Statistical Analysis Software Features And Benefits. Deliver an awe-inspiring pitch that will mesmerize everyone. Using these presentation templates you will surely catch everyones attention. You can browse the ppts collection on our website. We have researchers who are experts at creating the right content for the templates. So you do not have to invest time in any additional work. Just grab the template now and use them. The purpose of this slide is to outline the different software used to perform statistical analysis. This slide represents the primary features and benefits of various statistical software available in the market.
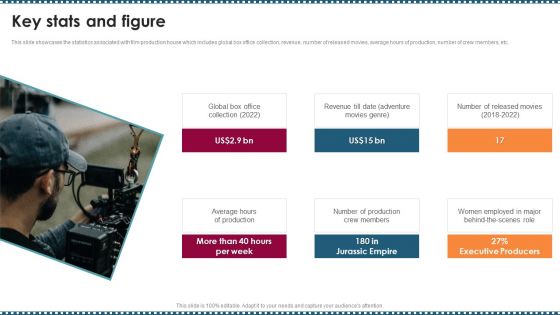
Feature Film Production Company Profile Key Stats And Figure Information PDF
This slide showcases the statistics associated with film production house which includes global box office collection, revenue, number of released movies, average hours of production, number of crew members, etc. Deliver and pitch your topic in the best possible manner with this Feature Film Production Company Profile Key Stats And Figure Information PDF Use them to share invaluable insights on Media Production, Advertising Journalism, Production Manages and impress your audience. This template can be altered and modified as per your expectations. So, grab it now.
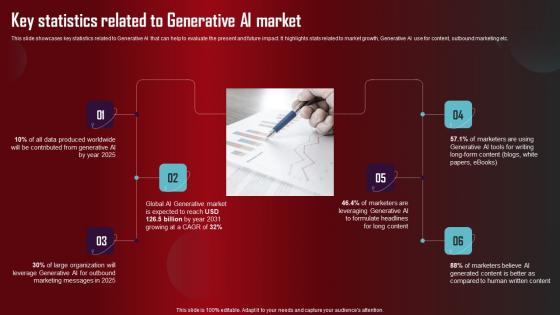
Key Statistics Related To Generative Role Of Generative AI Tools Across Information Pdf
This slide showcases key statistics related to Generative AI that can help to evaluate the present and future impact. It highlights stats related to market growth, Generative AI use for content, outbound marketing etc. There are so many reasons you need a Key Statistics Related To Generative Role Of Generative AI Tools Across Information Pdf. The first reason is you can not spend time making everything from scratch, Thus, Slidegeeks has made presentation templates for you too. You can easily download these templates from our website easily. This slide showcases key statistics related to Generative AI that can help to evaluate the present and future impact. It highlights stats related to market growth, Generative AI use for content, outbound marketing etc.
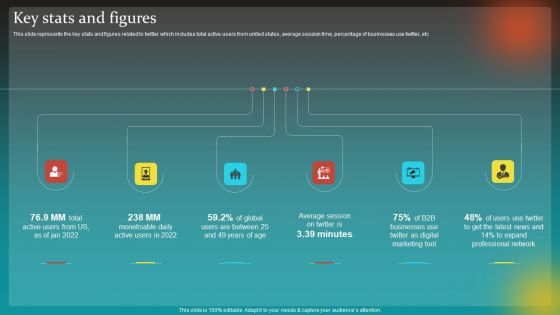
Social Network Business Summary Key Stats And Figures Ideas PDF
This slide represents the key stats and figures related to twitter which includes total active users from united states, average session time, percentage of businesses use twitter, etc Find a pre designed and impeccable Social Network Business Summary Key Stats And Figures Ideas PDF. The templates can ace your presentation without additional effort. You can download these easy to edit presentation templates to make your presentation stand out from others. So, what are you waiting for Download the template from Slidegeeks today and give a unique touch to your presentation.

Statistical Tools For Evidence Benefits Of Statistical Analysis Software Over Manual Analysis
This slide highlights the drawbacks of manual analysis process. The purpose of this slide is to represent how statistical analysis solves the limitations of manual analysis. The drawbacks are error in sampling, oversimplified solutions, causation, etc. From laying roadmaps to briefing everything in detail, our templates are perfect for you. You can set the stage with your presentation slides. All you have to do is download these easy-to-edit and customizable templates. Statistical Tools For Evidence Benefits Of Statistical Analysis Software Over Manual Analysis will help you deliver an outstanding performance that everyone would remember and praise you for. Do download this presentation today. This slide highlights the drawbacks of manual analysis process. The purpose of this slide is to represent how statistical analysis solves the limitations of manual analysis. The drawbacks are error in sampling, oversimplified solutions, causation, etc.
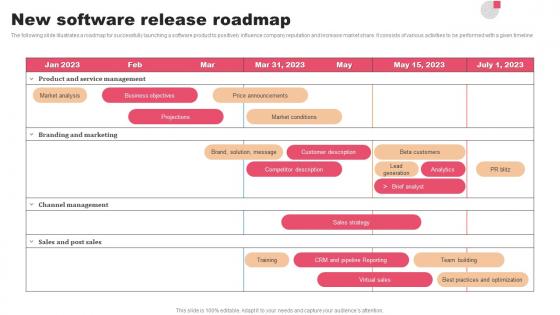
New Software Release Roadmap Template Pdf
The following slide illustrates a roadmap for successfully launching a software product to positively influence company reputation and increase market share. It consists of various activities to be performed with a given timeline Pitch your topic with ease and precision using this New Software Release Roadmap Template Pdf This layout presents information on Business Objectives, Channel Management, Sales And Post It is also available for immediate download and adjustment. So, changes can be made in the color, design, graphics or any other component to create a unique layout. The following slide illustrates a roadmap for successfully launching a software product to positively influence company reputation and increase market share. It consists of various activities to be performed with a given timeline
Statistic For Email Delivery Frequency Icon Guidelines Pdf
Showcasing this set of slides titled Statistic For Email Delivery Frequency Icon Guidelines Pdf. The topics addressed in these templates are Statistic Email, Delivery, Frequency. All the content presented in this PPT design is completely editable. Download it and make adjustments in color, background, font etc. as per your unique business setting. Our Statistic For Email Delivery Frequency Icon Guidelines Pdf are topically designed to provide an attractive backdrop to any subject. Use them to look like a presentation pro.
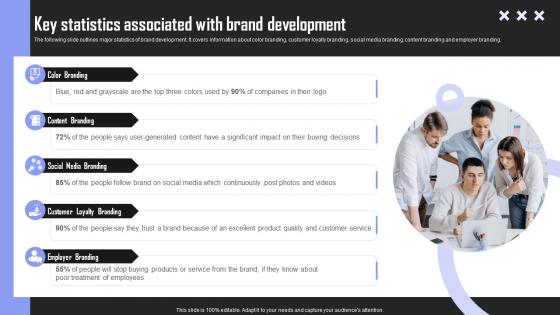
Key Statistics Associated Brand Building Techniques To Gain Competitive Edge Infographics Pdf
The following slide outlines major statistics of brand development. It covers information about color branding, customer loyalty branding, social media branding, content branding and employer branding. Welcome to our selection of the Key Statistics Associated Brand Building Techniques To Gain Competitive Edge Infographics Pdf. These are designed to help you showcase your creativity and bring your sphere to life. Planning and Innovation are essential for any business that is just starting out. This collection contains the designs that you need for your everyday presentations. All of our PowerPoints are 100 percent editable, so you can customize them to suit your needs. This multi purpose template can be used in various situations. Grab these presentation templates today The following slide outlines major statistics of brand development. It covers information about color branding, customer loyalty branding, social media branding, content branding and employer branding.
Icon For Email Marketing Campaign Statistics Ideas Pdf
Pitch your topic with ease and precision using this Icon For Email Marketing Campaign Statistics Ideas Pdf. This layout presents information on Email Marketing, Campaign, Statistics. It is also available for immediate download and adjustment. So, changes can be made in the color, design, graphics or any other component to create a unique layout. Our Icon For Email Marketing Campaign Statistics Ideas Pdf are topically designed to provide an attractive backdrop to any subject. Use them to look like a presentation pro.

Machine Learning Implementation And Case Study Why Is Machine Learning Important Ppt Styles Grid PDF
Presenting this set of slides with name machine learning implementation and case study why is machine learning important ppt styles grid pdf. This is a one stage process. The stages in this process are training, data, model, new data, prediction, predicted data, learning, error analysis, pre processing. This is a completely editable PowerPoint presentation and is available for immediate download. Download now and impress your audience.
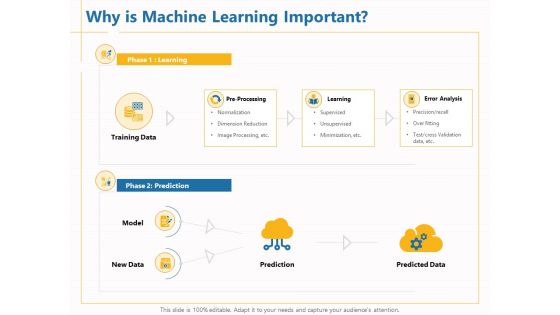
Boosting Machine Learning Why Is Machine Learning Important Ppt PowerPoint Presentation Infographics Graphics Download PDF
Presenting this set of slides with name boosting machine learning why is machine learning important ppt powerpoint presentation infographics graphics download pdf. This is a three stage process. The stages in this process are pre processing, learning, error analysis, training data, prediction, predicted data, new data, model. This is a completely editable PowerPoint presentation and is available for immediate download. Download now and impress your audience.

Managing Technical And Non Key Statistics Associated With Company Operations
Mentioned slide provides insights into key statistics associated with company working. It includes key statistics such as website designed, mobile applications designed, employee base, global presence, customer base, and number of offices globally. Here you can discover an assortment of the finest PowerPoint and Google Slides templates. With these templates, you can create presentations for a variety of purposes while simultaneously providing your audience with an eye-catching visual experience. Download Managing Technical And Non Key Statistics Associated With Company Operations to deliver an impeccable presentation. These templates will make your job of preparing presentations much quicker, yet still, maintain a high level of quality. Slidegeeks has experienced researchers who prepare these templates and write high-quality content for you. Later on, you can personalize the content by editing the Managing Technical And Non Key Statistics Associated With Company Operations. Mentioned slide provides insights into key statistics associated with company working. It includes key statistics such as website designed, mobile applications designed, employee base, global presence, customer base, and number of offices globally.
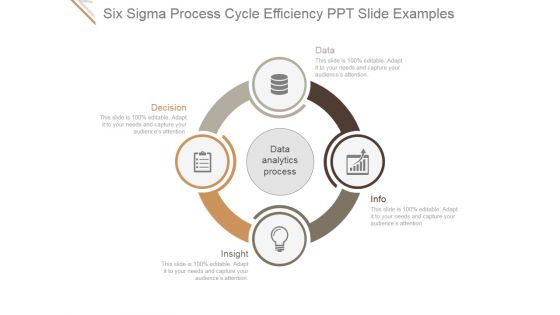
Six Sigma Process Cycle Efficiency Ppt PowerPoint Presentation Ideas
This is a six sigma process cycle efficiency ppt powerpoint presentation ideas. This is a four stage process. The stages in this process are data, info, insight, decision.
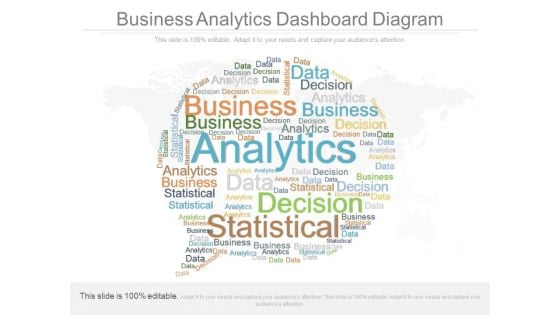
Business Analytics Dashboard Diagram
This is a business analytics dashboard diagram. This is a one stage process. The stages in this process are analytics, decision, data, business, statistics.
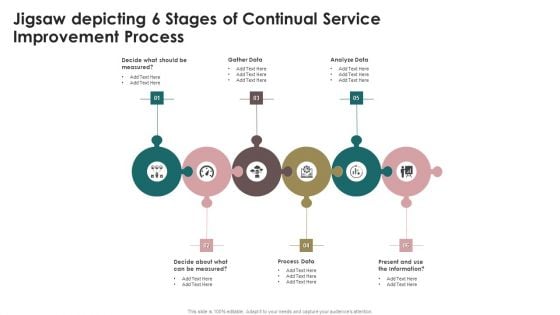
Jigsaw Depicting 6 Stages Of Continual Service Improvement Process Brochure PDF
Persuade your audience using this Jigsaw Depicting 6 Stages Of Continual Service Improvement Process Brochure PDF. This PPT design covers six stages, thus making it a great tool to use. It also caters to a variety of topics including Gather Data, Analyze Data, Process Data. Download this PPT design now to present a convincing pitch that not only emphasizes the topic but also showcases your presentation skills.
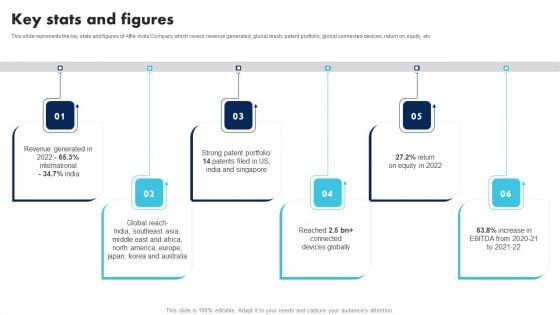
Information Technology Solutions Company Outline Key Stats And Figures Download PDF
This slide represents the key stats and figures of Affle India Company which covers revenue generated, global reach, patent portfolio, global connected devices, return on equity, etc If you are looking for a format to display your unique thoughts, then the professionally designed Information Technology Solutions Company Outline Key Stats And Figures Download PDF is the one for you. You can use it as a Google Slides template or a PowerPoint template. Incorporate impressive visuals, symbols, images, and other charts. Modify or reorganize the text boxes as you desire. Experiment with shade schemes and font pairings. Alter, share or cooperate with other people on your work. Download Information Technology Solutions Company Outline Key Stats And Figures Download PDF and find out how to give a successful presentation. Present a perfect display to your team and make your presentation unforgettable.
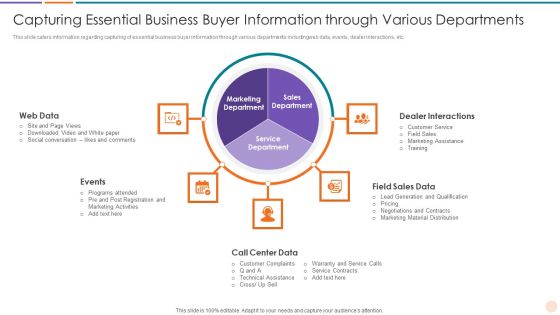
Improving Lead Generation Capturing Essential Business Buyer Information Through Slides PDF
This slide caters information regarding capturing of essential business buyer information through various departments includingweb data, events, dealer interactions, etc. This is a improving lead generation capturing essential business buyer information through slides pdf template with various stages. Focus and dispense information on five stages using this creative set, that comes with editable features. It contains large content boxes to add your information on topics like web data, events, call center data, field sales data, dealer interactions. You can also showcase facts, figures, and other relevant content using this PPT layout. Grab it now.
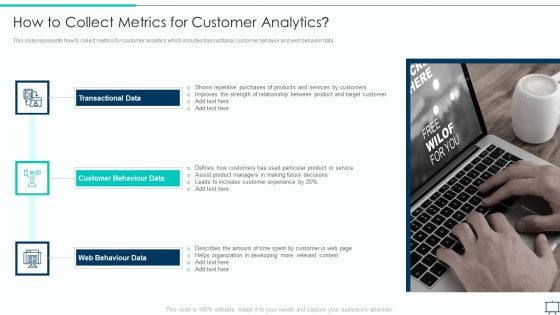
Formulating Competitive Plan Of Action For Effective Product Leadership How To Collect Metrics Infographics PDF
This slide represents how to collect metrics for customer analytics which includes transactional, customer behavior and web behavior data. This is a formulating competitive plan of action for effective product leadership how to collect metrics infographics pdf template with various stages. Focus and dispense information on three stages using this creative set, that comes with editable features. It contains large content boxes to add your information on topics like transactional data, customer behaviour data, web behaviour data. You can also showcase facts, figures, and other relevant content using this PPT layout. Grab it now.


 Continue with Email

 Home
Home


