Data
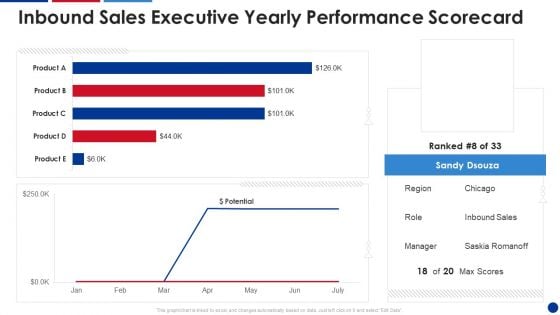
Inbound Sales Executive Yearly Performance Scorecard Information PDF
This graph or chart is linked to excel, and changes automatically based on data. Just left click on it and select Edit Data. Deliver and pitch your topic in the best possible manner with this Inbound Sales Executive Yearly Performance Scorecard Information PDF. Use them to share invaluable insights on Inbound Sales, Executive Yearly, Performance Scorecard and impress your audience. This template can be altered and modified as per your expectations. So, grab it now.
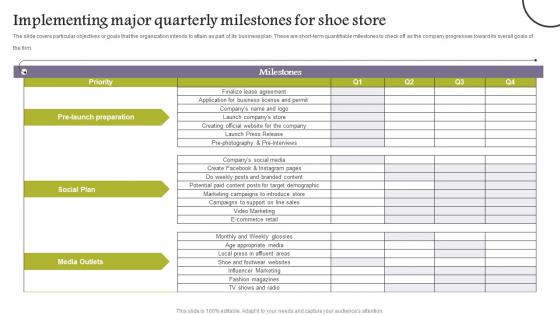
Company Analysis Of Shoe Store Implementing Major Quarterly Milestones Rules Pdf
The slide covers particular objectives or goals that the organization intends to attain as part of its business plan. These are short term quantifiable milestones to check off as the company progresses toward its overall goals of the firm. Do you know about Slidesgeeks Company Analysis Of Shoe Store Implementing Major Quarterly Milestones Rules Pdf These are perfect for delivering any kind od presentation. Using it, create PowerPoint presentations that communicate your ideas and engage audiences. Save time and effort by using our pre designed presentation templates that are perfect for a wide range of topic. Our vast selection of designs covers a range of styles, from creative to business, and are all highly customizable and easy to edit. Download as a PowerPoint template or use them as Google Slides themes. The slide covers particular objectives or goals that the organization intends to attain as part of its business plan. These are short term quantifiable milestones to check off as the company progresses toward its overall goals of the firm.
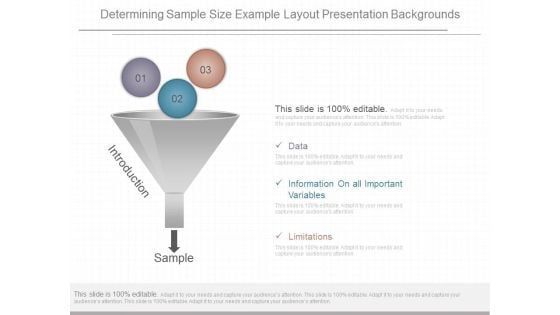
Determining Sample Size Example Layout Presentation Backgrounds
This is a determining sample size example layout presentation backgrounds. This is a three stage process. The stages in this process are data, information on all important variables, limitations, introduction, sample.
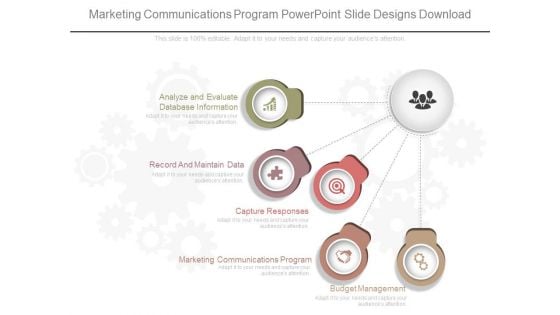
Marketing Communications Program Powerpoint Slide Designs Download
This is a marketing communications program powerpoint slide designs download. This is a five stage process. The stages in this process are budget management, marketing communications program, capture responses, record and maintain data, analyze and evaluate database information.
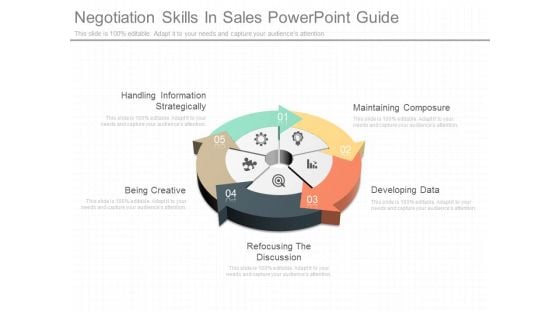
Negotiation Skills In Sales Powerpoint Guide
This is a negotiation skills in sales powerpoint guide. This is a five stage process. The stages in this process are handling information strategically, maintaining composure, developing data, refocusing the discussion, being creative.
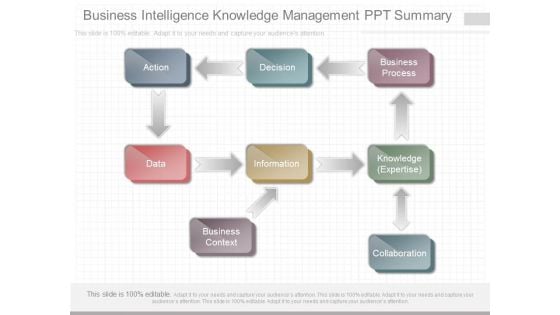
Business Intelligence Knowledge Management Ppt Summary
This is a business intelligence knowledge management ppt summary. This is a eight stage process. The stages in this process are business process, knowledge, information, decision, action, data, business context, collaboration.
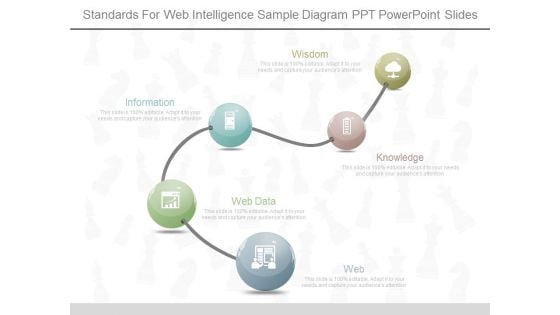
Standards For Web Intelligence Sample Diagram Ppt Powerpoint Slides
This is a standards for web intelligence sample diagram ppt powerpoint slides. This is a five stage process. The stages in this process are web, web data, information, knowledge, wisdom.
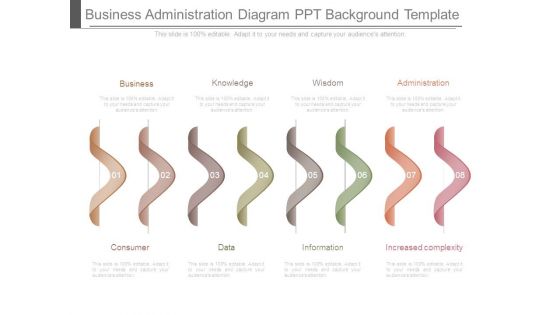
Business Administration Diagram Ppt Background Template
This is a business administration diagram ppt background template. This is a eight stage process. The stages in this process are business, consumer, knowledge, data, wisdom, information, administration, increased complexity.
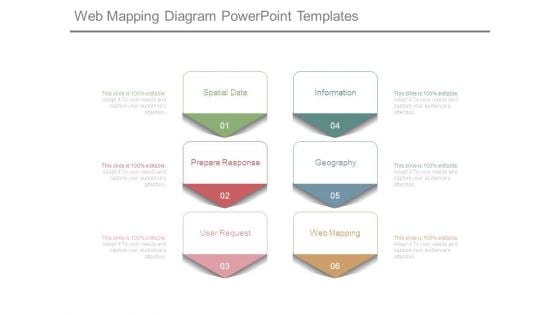
Web Mapping Diagram Powerpoint Templates
This is a web mapping diagram powerpoint templates. This is a six stage process. The stages in this process are spatial data, prepare response, user request, information, geography, web mapping.
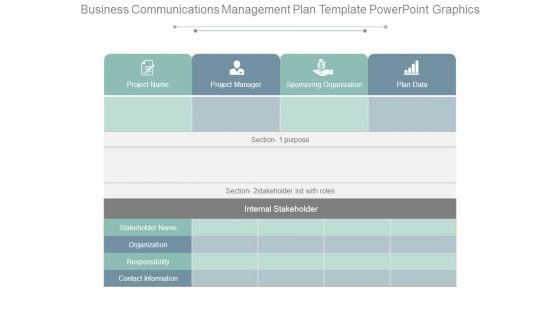
Business Communications Management Plan Template Powerpoint Graphics
This is a business communications management plan template powerpoint graphics. This is a four stage process. The stages in this process are Project Name, Project Manager, Sponsoring Organization, Plan Data, Stakeholder Name, Organization, Responsibility, Contact Information, Internal Stakeholder.
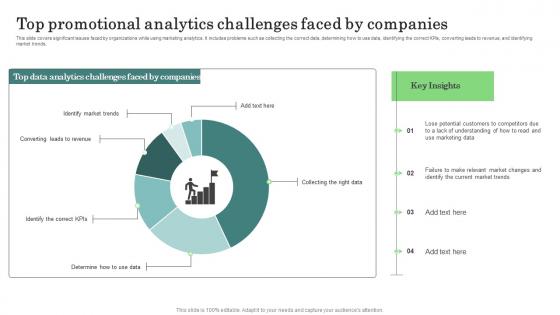
Major Promotional Analytics Future Trends Top Promotional Analytics Ideas Pdf
This slide covers significant issues faced by organizations while using marketing analytics. It includes problems such as collecting the correct data, determining how to use data, identifying the correct KPIs, converting leads to revenue, and identifying market trends. qSlidegeeks has constructed Major Promotional Analytics Future Trends Top Promotional Analytics Ideas Pdf after conducting extensive research and examination. These presentation templates are constantly being generated and modified based on user preferences and critiques from editors. Here, you will find the most attractive templates for a range of purposes while taking into account ratings and remarks from users regarding the content. This is an excellent jumping off point to explore our content and will give new users an insight into our top notch PowerPoint Templates. This slide covers significant issues faced by organizations while using marketing analytics. It includes problems such as collecting the correct data, determining how to use data, identifying the correct KPIs, converting leads to revenue, and identifying market trends.
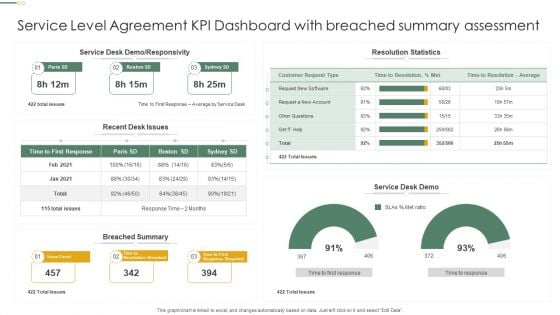
Service Level Agreement KPI Dashboard With Breached Summary Assessment Professional PDF
This graph or chart is linked to excel, and changes automatically based on data. Just left click on it and select Edit Data. Pitch your topic with ease and precision using this Service Level Agreement KPI Dashboard With Breached Summary Assessment Professional PDF. This layout presents information on Resolution Statistics, Service Desk Demo, Breached Summary. It is also available for immediate download and adjustment. So, changes can be made in the color, design, graphics or any other component to create a unique layout.
Impact Of Change Management Assessment Timeline On Quarterly Basis Demonstration Pdf
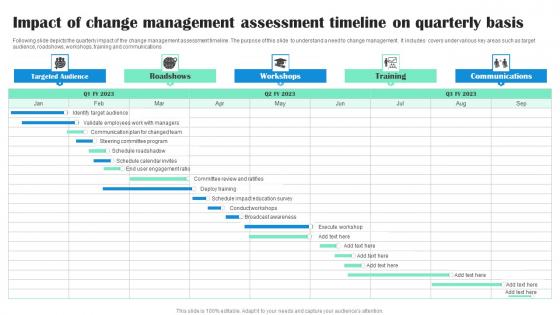
Following slide depicts the quarterly impact of the change management assessment timeline. The purpose of this slide to understand a need to change management . It includes covers under various key areas such as target audience, roadshows, workshops, training and communications Showcasing this set of slides titled Impact Of Change Management Assessment Timeline On Quarterly Basis Demonstration Pdf The topics addressed in these templates are Targeted Audience, Roadshows, Workshops, Communications All the content presented in this PPT design is completely editable. Download it and make adjustments in color, background, font etc. as per your unique business setting. Following slide depicts the quarterly impact of the change management assessment timeline. The purpose of this slide to understand a need to change management . It includes covers under various key areas such as target audience, roadshows, workshops, training and communications
Comprehensive Manual For Blockchain Statistics Highlighting Importance BCT SS V
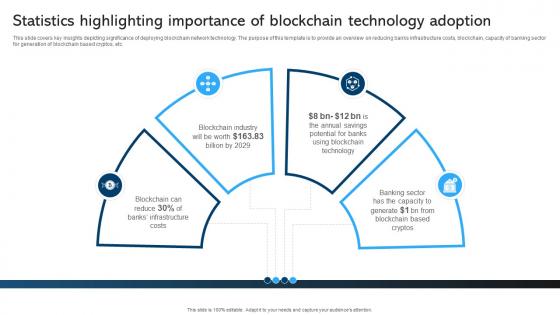
This slide covers key insights depicting significance of deploying blockchain network technology. The purpose of this template is to provide an overview on reducing banks infrastructure costs, blockchain, capacity of banking sector for generation of blockchain based cryptos, etc. Here you can discover an assortment of the finest PowerPoint and Google Slides templates. With these templates, you can create presentations for a variety of purposes while simultaneously providing your audience with an eye-catching visual experience. Download Comprehensive Manual For Blockchain Statistics Highlighting Importance BCT SS V to deliver an impeccable presentation. These templates will make your job of preparing presentations much quicker, yet still, maintain a high level of quality. Slidegeeks has experienced researchers who prepare these templates and write high-quality content for you. Later on, you can personalize the content by editing the Comprehensive Manual For Blockchain Statistics Highlighting Importance BCT SS V. This slide covers key insights depicting significance of deploying blockchain network technology. The purpose of this template is to provide an overview on reducing banks infrastructure costs, blockchain, capacity of banking sector for generation of blockchain based cryptos, etc.
Monthly Company Performance Analysiscompetitor Analysis Market Formats PDF
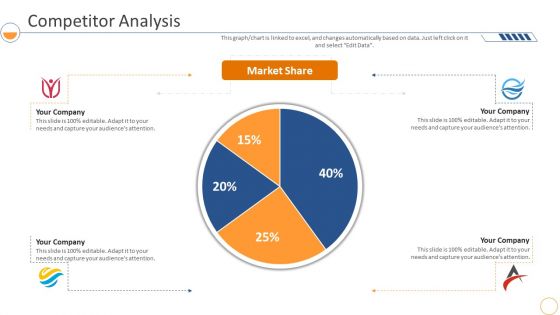
This graph or chart is linked to excel, and changes automatically based on data. Just left click on it and select Edit Data. Deliver an awe inspiring pitch with this creative monthly company performance analysiscompetitor analysis market formats pdf bundle. Topics like competitor analysis, market share can be discussed with this completely editable template. It is available for immediate download depending on the needs and requirements of the user.
Global Auto Sales Scorecard By Market Share Ideas PDF
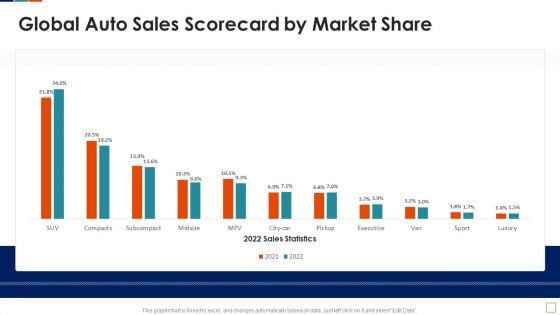
This graph or chart is linked to excel, and changes automatically based on data. Just left click on it and select Edit Data. Deliver an awe inspiring pitch with this creative Global Auto Sales Scorecard By Market Share Ideas PDF bundle. Topics like 2022 Sales Statistics, Global Auto Sales, Scorecard Market Share can be discussed with this completely editable template. It is available for immediate download depending on the needs and requirements of the user.
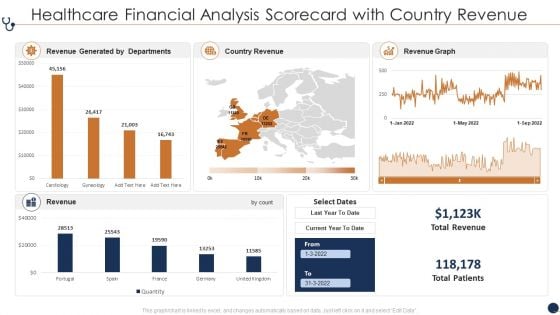
Healthcare Financial Analysis Scorecard With Country Revenue Ppt Layouts PDF
This graph or chart is linked to excel, and changes automatically based on data. Just left click on it and select Edit Data. Deliver an awe inspiring pitch with this creative Healthcare Financial Analysis Scorecard With Country Revenue Ppt Layouts PDF bundle. Topics like Revenue Generated Departments, Country Revenue Current can be discussed with this completely editable template. It is available for immediate download depending on the needs and requirements of the user.
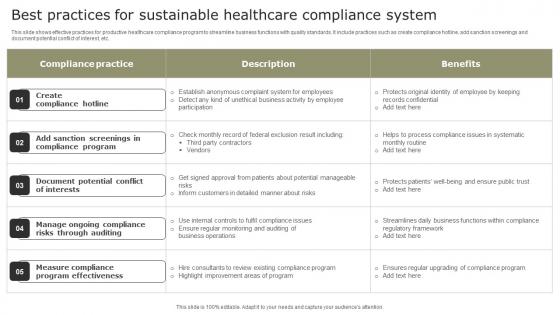
Best Practices For Sustainable Healthcare Compliance System Infographics Pdf
This slide shows effective practices for productive healthcare compliance program to streamline business functions with quality standards. It include practices such as create compliance hotline, add sanction screenings and document potential conflict of interest, etc. Pitch your topic with ease and precision using this Best Practices For Sustainable Healthcare Compliance System Infographics Pdf. This layout presents information on Create Compliance Hotline, Document Potential, Ongoing Compliance. It is also available for immediate download and adjustment. So, changes can be made in the color, design, graphics or any other component to create a unique layout. This slide shows effective practices for productive healthcare compliance program to streamline business functions with quality standards. It include practices such as create compliance hotline, add sanction screenings and document potential conflict of interest, etc.
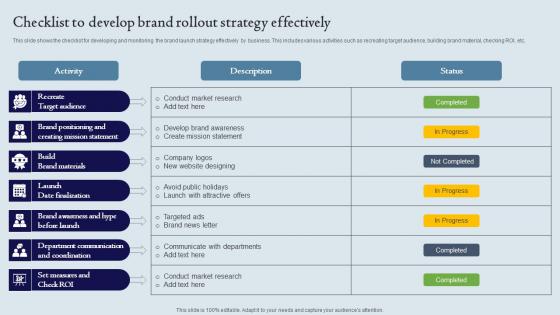
Checklist To Develop Brand Rollout Strategy Effectively Ppt Infographics Deck Pdf
This slide shows the checklist for developing and monitoring the brand launch strategy effectively by business. This includes various activities such as recreating target audience, building brand material, checking ROI, etc. Pitch your topic with ease and precision using this Checklist To Develop Brand Rollout Strategy Effectively Ppt Infographics Deck Pdf. This layout presents information on Target Audience, Building Brand Material, Checking ROI. It is also available for immediate download and adjustment. So, changes can be made in the color, design, graphics or any other component to create a unique layout. This slide shows the checklist for developing and monitoring the brand launch strategy effectively by business. This includes various activities such as recreating target audience, building brand material, checking ROI, etc.
Seeing The Light PowerPoint Icon C
access, business, chrome, close, data, defend, file, folder, fortify, gloss Our Seeing The Light PowerPoint Icon C will ensure you get an A. You will be glad you tried us out.
Business Diagram Concepts Of Business With Icons Diagram PowerPoint Ppt Presentation
This business diagram displays 3d pie chart. It contains graphics of pie chart for business planning. This pie chart is a visual way of displaying data. Use this diagram to make outstanding presentations.
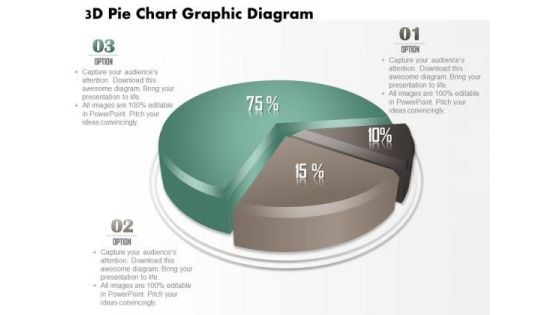
Business Diagram 3d Pie Chart Graphic Diagram PowerPoint Ppt Presentation
This business diagram displays 3d pie chart. It contains pie chart with percentage ratios. This pie chart is a visual way of displaying data. Use this diagram to make outstanding presentations.
Stock Photo Card Board Download Arrow Icon PowerPoint Slide
This image slide is designed with cardboard and download arrow. This image contains the graphic of download icon with cardboard depicting downloading and storage of data. Use this image to make outstanding presentations.
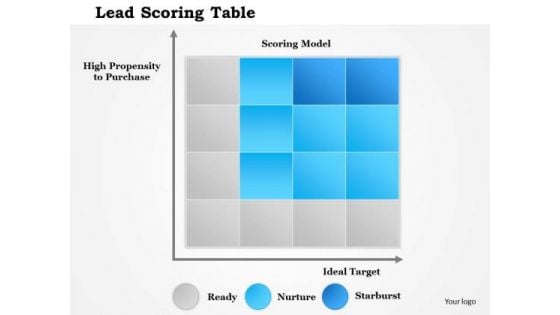
Business Framework Lead Scoring Table PowerPoint Presentation
A graph style cubical chart has been used to decorate this power point template slide. This PPT slide contains the concept of explaining score. Use this score table for displaying any data.

Business Framework Shed Light On Topic Flashlight PowerPoint Presentation
This Power Point template slide has been designed with graphic of torch. This flash light has been used to display the concept of highlighting the any business data. Use this business slide for your technical presentation.
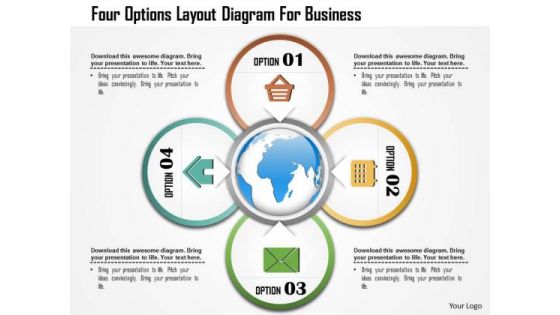
Business Diagram Four Options Layout Diagram For Business Presentation Template
Four options circular diagram is used to design this power point template. This business diagram can be used to compare and present data. Use this diagram to make your presentations more effective.
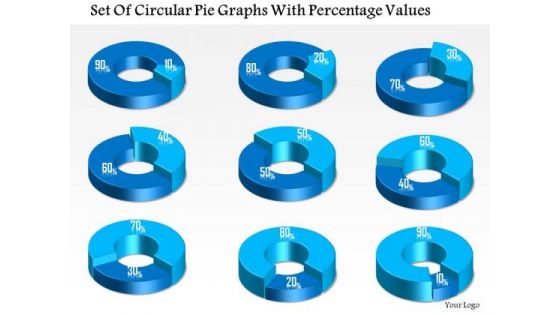
Business Diagram Set Of Circular Pie Graphs With Percentage Values Presentation Template
This business diagram displays set of pie charts. This Power Point template has been designed to compare and present business data. Download this diagram to represent stages of business growth.

Busines Diagram Five Staged Test Tubes For Science Based Values Representation Ppt Template
Five staged test tubes are used to design this business diagram. This business slide contains the concept of value representation based on scientific data. Ideas are best expressed easily with the help of this diagram slide
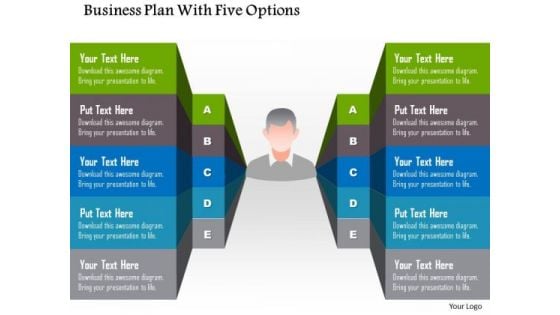
Business Diagram Business Plan With Five Options Presentation Template
This business slide helps to displays business plan with five options. This diagram can help by summarizing the key features of the data. Use this editable diagram for your business and management related presentations.
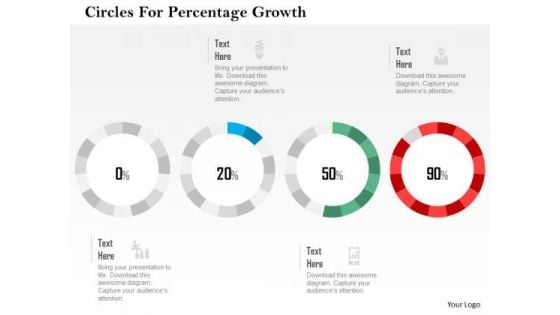
Business Diagram Circles For Percentage Growth Presentation Template
This business slide has been designed with graphics of circles. You may download this diagram to display percentage growth data. This template is innovatively designed to highlight your worthy views
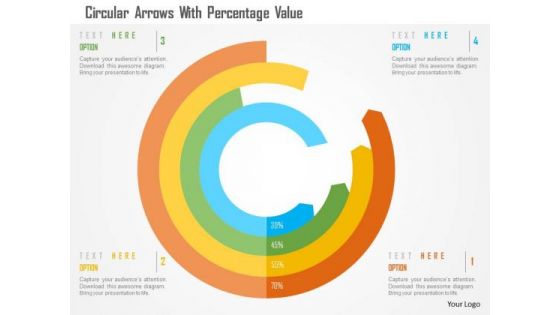
Business Diagram Circular Arrows With Percentage Value Presentation Template
This business slide has been designed with circular arrows. You may download this diagram to display percentage growth data. This template is innovatively designed to highlight your worthy views
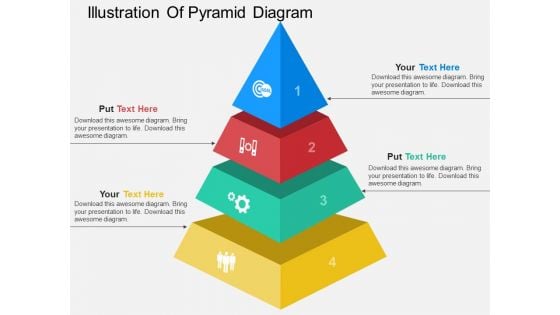
Illustration Of Pyramid Diagram Powerpoint Template
This PowerPoint slide contains illustration of pyramid diagram. This professional slide may be used for visual explanation of data. Adjust the above diagram in your business presentations to give professional impact.
Four Staged Pie Chart With Icons Powerpoint Templates
A good quality PowerPoint template is the foundation for every presentation. This PPT slide contains graphics of pie chart. Download this slide to outline business data. This slide is innovatively designed to highlight your worthy views.

Set Of Seven Vertical Steps Powerpoint Templates
This PowerPoint slide contains graphics of seven vertical steps. This professional slide may be used for visual explanation of data. Adjust the above diagram in your business presentations to give professional impact.
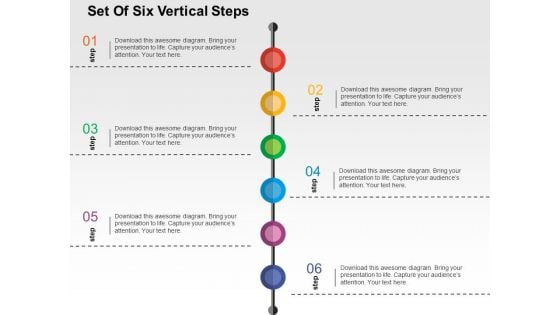
Set Of Six Vertical Steps Powerpoint Templates
This PowerPoint slide contains graphics of six vertical steps. This professional slide may be used for visual explanation of data. Adjust the above diagram in your business presentations to give professional impact.
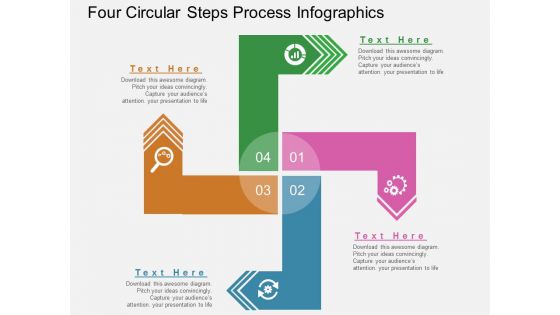
Four Circular Steps Process Infographics Powerpoint Template
This PowerPoint slide contains circular steps process infographic. This professional slide may be used for visual explanation of data. Adjust the above diagram in your business presentations to give professional impact.
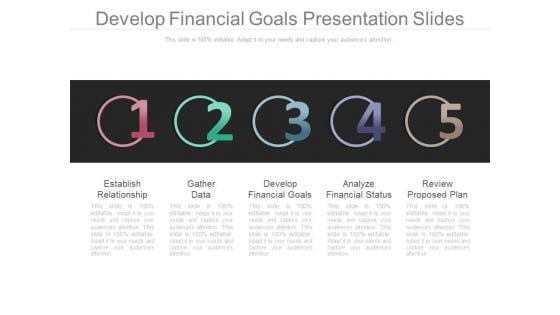
Develop Financial Goals Presentation Slides
This is a develop financial goals presentation slides. This is a five stage process. The stages in this process are establish relationship, gather data, develop financial goals, analyze financial status, review proposed plan.\n\n
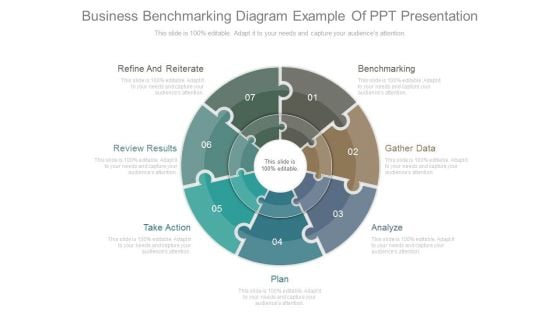
Business Benchmarking Diagram Example Of Ppt Presentation
This is a business benchmarking diagram example of ppt presentation. This is a seven stage process. The stages in this process are refine and reiterate, review results, take action, plan, analyze, gather data, benchmarking.
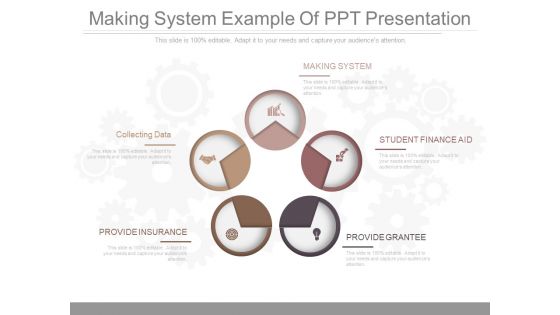
Making System Example Of Ppt Presentation
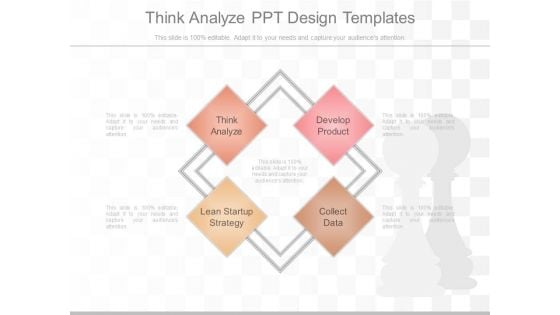
Think Analyze Ppt Design Templates
This is a think analyze ppt design templates. This is a four stage process. The stages in this process are think analyze, lean startup strategy, develop product, collect data.
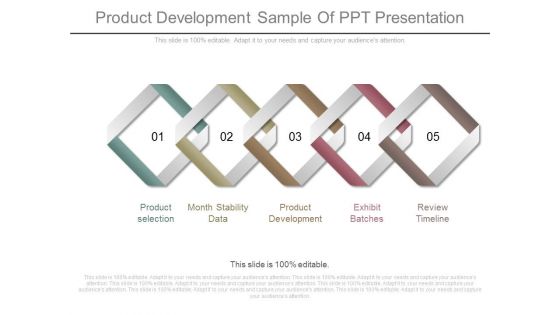
Product Development Sample Of Ppt Presentation
This is a product development sample of ppt presentation. This is a five stage process. The stages in this process are product selection, month stability data, product development, exhibit batches, review timeline.
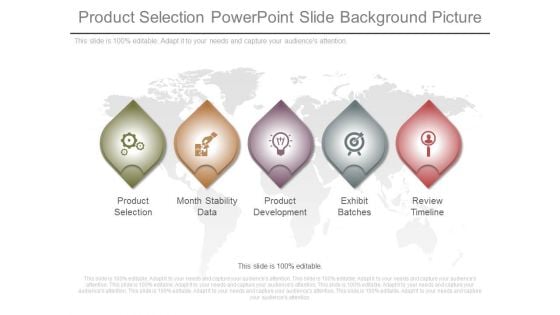
Product Selection Powerpoint Slide Background Picture
This is a product selection powerpoint slide background picture. This is a five stage process. The stages in this process are product selection, month stability data, product development, exhibit batches, review timeline.
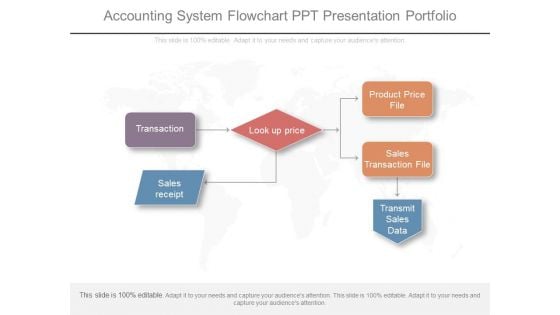
Accounting System Flowchart Ppt Presentation Portfolio
This is an accounting system flowchart ppt presentation portfolio. This is a one stage process. The stages in this process are sales receipt, look up price, product price file, sales transaction file, transmit sales data.
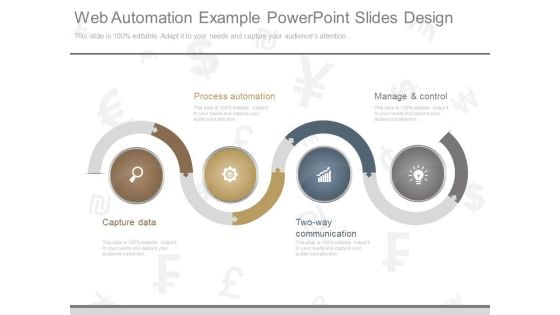
Web Automation Example Powerpoint Slides Design
This is a web automation example powerpoint slides design. This is a four stage process. The stages in this process are process automation, manage and control, capture data, two way communication.
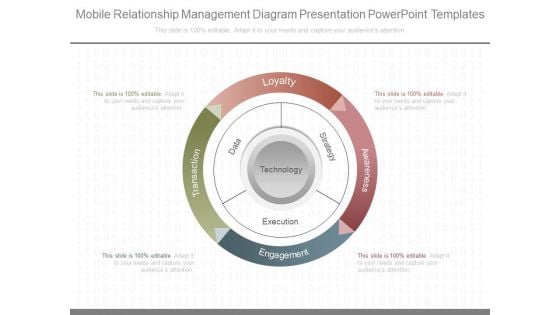
Mobile Relationship Management Diagram Presentation Powerpoint Templates
This is a mobile relationship management diagram presentation powerpoint templates. This is a four stage process. The stages in this process are strategy, execution, data, transaction, engagement, awareness, loyalty.
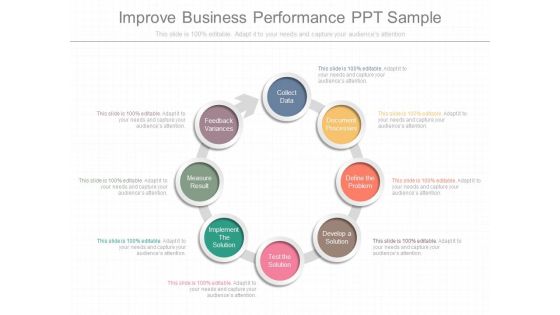
Improve Business Performance Ppt Sample
This is a improve business performance ppt sample. This is a eight stage process. The stages in this process are feedback variances, measure result, implement the solution, test the solution, develop a solution, define the problem, document processes, collect data.
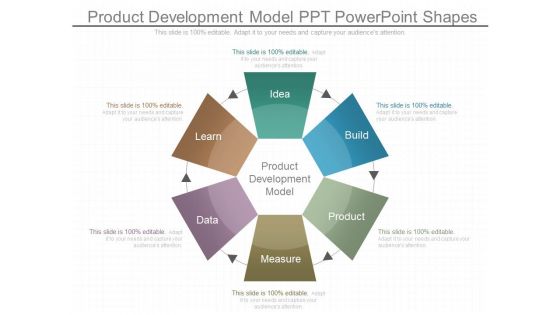
Product Development Model Ppt Powerpoint Shapes
This is a product development model ppt powerpoint shapes. This is a six stage process. The stages in this process are learn, data, idea, build, product, measure, product development model.
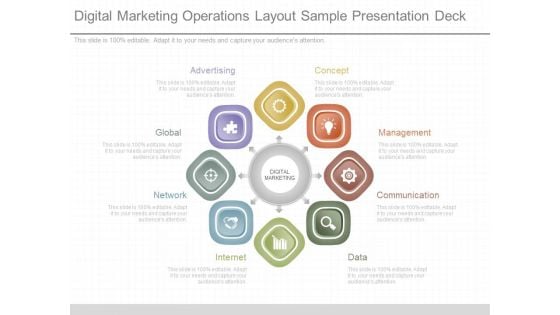
Digital Marketing Operations Layout Sample Presentation Deck
This is a digital marketing operations layout sample presentation deck. This is a eight stage process. The stages in this process are advertising, concept, management, communication, data, internet, network, global, digital marketing.
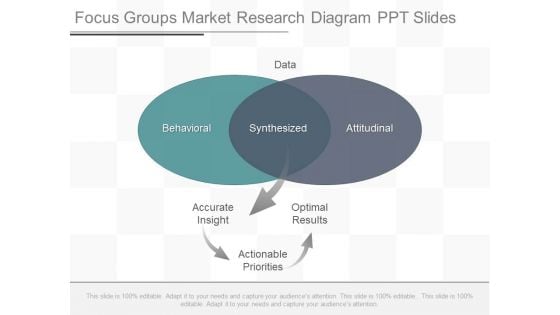
Focus Groups Market Research Diagram Ppt Slides
This is a focus groups market research diagram ppt slides. This is a two stage process. The stages in this process are data, behavioral, synthesized, attitudinal, accurate insight, optimal results, actionable priorities.
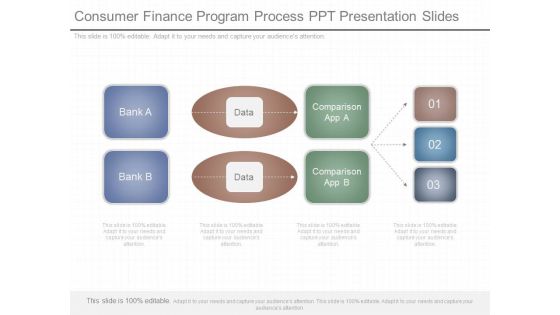
Consumer Finance Program Process Ppt Presentation Slides
This is a consumer finance program process ppt presentation slides. This is a one stage process. The stages in this process are bank a, bank b, data, comparison app a, comparison app b.
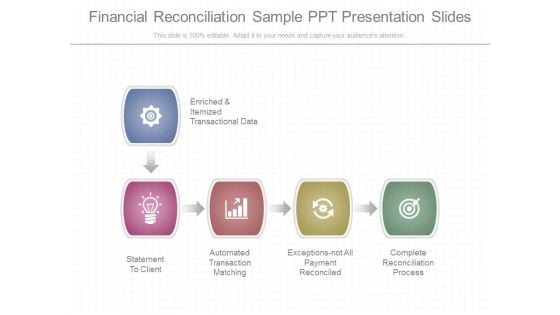
Financial Reconciliation Sample Ppt Presentation Slides
This is a financial reconciliation sample ppt presentation slides. This is a five stage process. The stages in this process are enriched and itemized transactional data, statement to client, automated transaction matching, exceptions not all payment reconciled, complete reconciliation process.\n\n\n\n\n\n\n\n\n\n\n\n\n\n\n\n\n\n
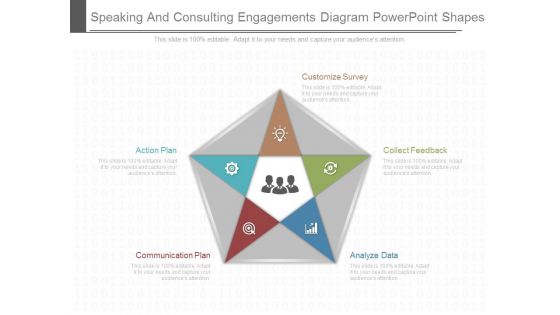
Speaking And Consulting Engagements Diagram Powerpoint Shapes
This is a speaking and consulting engagements diagram powerpoint shapes. This is a five stage process. The stages in this process are customize survey, action plan, collect feedback, communication plan, analyze data.

Higher Proposal Win Rate Presentation Background Images
This is a higher proposal win rate presentation background images. This is a four stage process. The stages in this process are higher proposal win rate, faster follow up, sales feels supported, cost per lead data.

B2b Omni Channel Marketing Strategy Diagram Powerpoint Shapes
This is a b2b omni channel marketing strategy diagram powerpoint shapes. This is a six stage process. The stages in this process are crm, big data, mobile, social media, online, physical store.

Omni Channel Marketing For Online Retailing Diagram Ppt Slides
This is a omni channel marketing for online retailing diagram ppt slides. This is a five stage process. The stages in this process are social media, online, physical store, crm, big data.
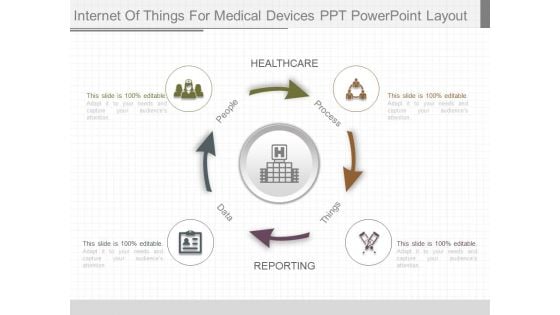
Internet Of Things For Medical Devices Ppt Powerpoint Layout
This is a internet of things for medical devices ppt powerpoint layout. This is a four stage process. The stages in this process are healthcare, reporting, data, things, people, process.
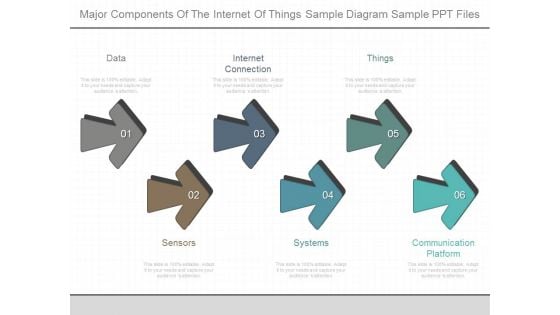
Major Components Of The Internet Of Things Sample Diagram Sample Ppt Files
This is a major components of the internet of things sample diagram sample ppt files. This is a six stage process. The stages in this process are data, internet connection, things, sensors, systems, communication platform.
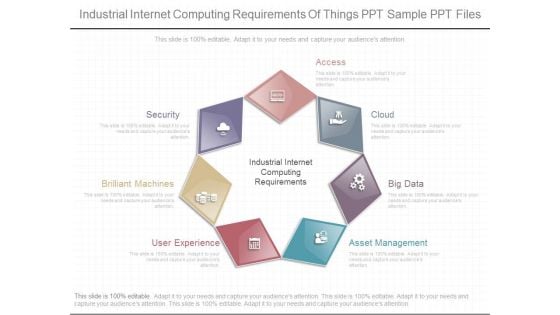
Industrial Internet Computing Requirements Of Things Ppt Sample Ppt Files
This is a industrial internet computing requirements of things ppt sample ppt files. This is a seven stage process. The stages in this process are industrial internet computing requirements, brilliant machines, user experience, asset management, big data, cloud, access, security.
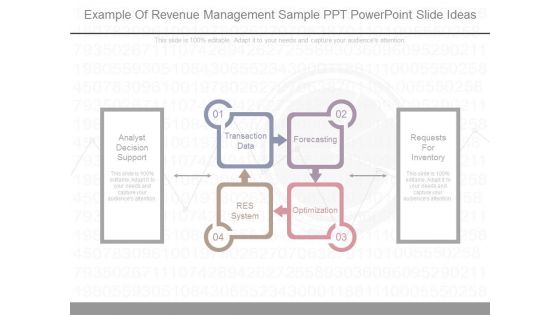
Example Of Revenue Management Sample Ppt Powerpoint Slide Ideas
This is a example of revenue management sample ppt powerpoint slide ideas. This is a four stage process. The stages in this process are transaction data, forecasting, res system, optimization, analyst decision support, requests for inventory.
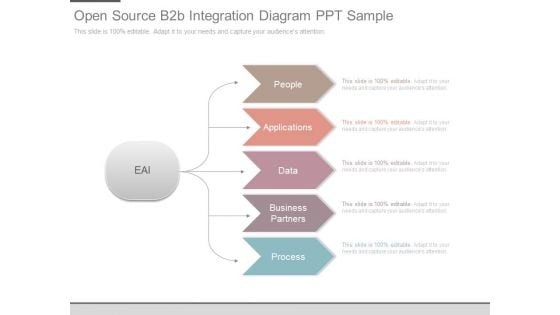
Open Source B2b Integration Diagram Ppt Sample
This is a open source b2b integration diagram ppt sample. This is a five stage process. The stages in this process are eai, people, applications, data, business partners, process.


 Continue with Email

 Home
Home


