Data

Key Facts And Stats Grocery Delivery Company Profile CP SS V
The slide illustrate key stats, facts and figures of the Swiggy organization. It includes monthly active users, restaurant partners count, average weekly orders, company valuation etc. Welcome to our selection of the Key Facts And Stats Grocery Delivery Company Profile CP SS V. These are designed to help you showcase your creativity and bring your sphere to life. Planning and Innovation are essential for any business that is just starting out. This collection contains the designs that you need for your everyday presentations. All of our PowerPoints are 100 percent editable, so you can customize them to suit your needs. This multi-purpose template can be used in various situations. Grab these presentation templates today. The slide illustrate key stats, facts and figures of the Swiggy organization. It includes monthly active users, restaurant partners count, average weekly orders, company valuation etc.
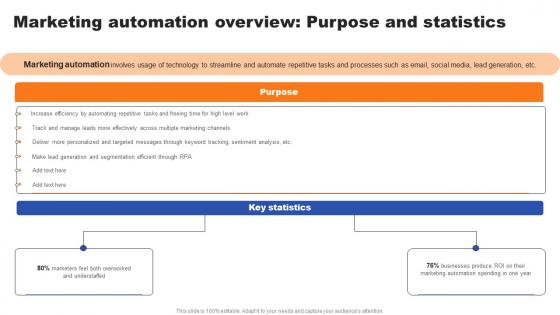
Marketing Automation Overview Purpose And Statistics Ppt File Ideas Pdf
This slide showcases introduction to marketing automation which can provide basic gist of these technologies to marketers. It provides details about email marketing, social media scheduling, lead generation, etc. This modern and well-arranged Marketing Automation Overview Purpose And Statistics Ppt File Ideas Pdf provides lots of creative possibilities. It is very simple to customize and edit with the Powerpoint Software. Just drag and drop your pictures into the shapes. All facets of this template can be edited with Powerpoint, no extra software is necessary. Add your own material, put your images in the places assigned for them, adjust the colors, and then you can show your slides to the world, with an animated slide included. This slide showcases introduction to marketing automation which can provide basic gist of these technologies to marketers. It provides details about email marketing, social media scheduling, lead generation, etc.
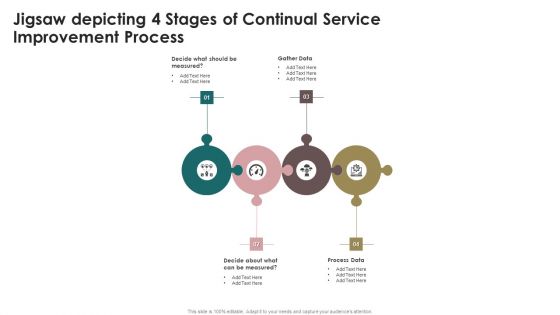
Jigsaw Depicting 4 Stages Of Continual Service Improvement Process Slides PDF
Persuade your audience using this Jigsaw Depicting 4 Stages Of Continual Service Improvement Process Slides PDF. This PPT design covers four stages, thus making it a great tool to use. It also caters to a variety of topics including Measured, Gather Data, Process Data. Download this PPT design now to present a convincing pitch that not only emphasizes the topic but also showcases your presentation skills.
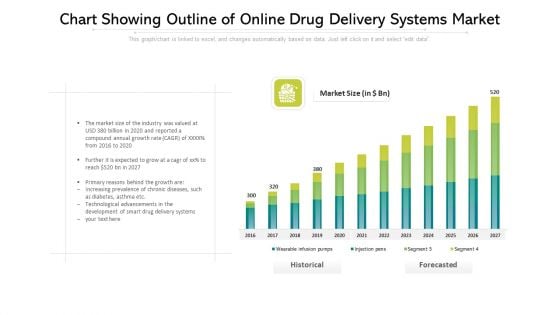
Chart Showing Outline Of Online Drug Delivery Systems Market Ppt PowerPoint Presentation File Clipart PDF
This graph or chart is linked to excel, and changes automatically based on data. Just left click on it and select edit data. Showcasing this set of slides titled chart showing outline of online drug delivery systems market ppt powerpoint presentation file clipart pdf. The topics addressed in these templates are technological, development, growth. All the content presented in this PPT design is completely editable. Download it and make adjustments in color, background, font etc. as per your unique business setting.

Global Digital Education Key Statistics Of The Edtech Industry In Asia Pacific IR SS V
This slide showcases the EdTech industry analysis of Asia-Pacific region which includes key statistics such as percentage of share contributed to edtech industry, largest market, etc. This Global Digital Education Key Statistics Of The Edtech Industry In Asia Pacific IR SS V from Slidegeeks makes it easy to present information on your topic with precision. It provides customization options, so you can make changes to the colors, design, graphics, or any other component to create a unique layout. It is also available for immediate download, so you can begin using it right away. Slidegeeks has done good research to ensure that you have everything you need to make your presentation stand out. Make a name out there for a brilliant performance. This slide showcases the EdTech industry analysis of Asia-Pacific region which includes key statistics such as percentage of share contributed to edtech industry, largest market, etc.
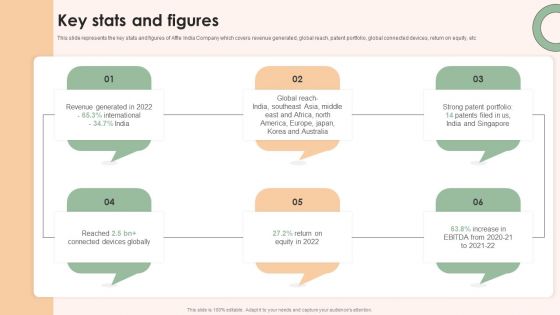
Online Advertising Firm Business Profile Key Stats And Figures Introduction PDF
This slide represents the key stats and figures of Affle India Company which covers revenue generated, global reach, patent portfolio, global connected devices, return on equity, etc Make sure to capture your audiences attention in your business displays with our gratis customizable Online Advertising Firm Business Profile Key Stats And Figures Introduction PDF. These are great for business strategies, office conferences, capital raising or task suggestions. If you desire to acquire more customers for your tech business and ensure they stay satisfied, create your own sales presentation with these plain slides.
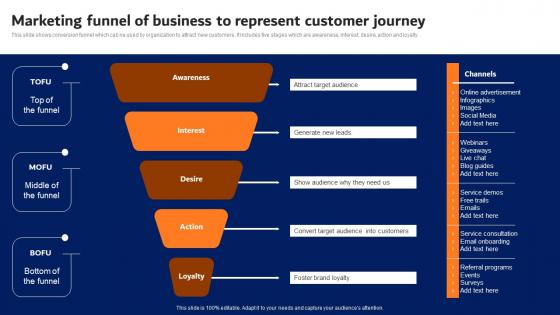
Digital Advertising Strategies Marketing Funnel Of Business Infographics Pdf
This slide shows conversion funnel which cab ne used by organization to attract new customers. It includes five stages which are awareness, interest, desire, action and loyalty. This modern and well arranged Digital Advertising Strategies Marketing Funnel Of Business Infographics Pdf provides lots of creative possibilities. It is very simple to customize and edit with the Powerpoint Software. Just drag and drop your pictures into the shapes. All facets of this template can be edited with Powerpoint no extra software is necessary. Add your own material, put your images in the places assigned for them, adjust the colors, and then you can show your slides to the world, with an animated slide included. This slide shows conversion funnel which cab ne used by organization to attract new customers. It includes five stages which are awareness, interest, desire, action and loyalty.
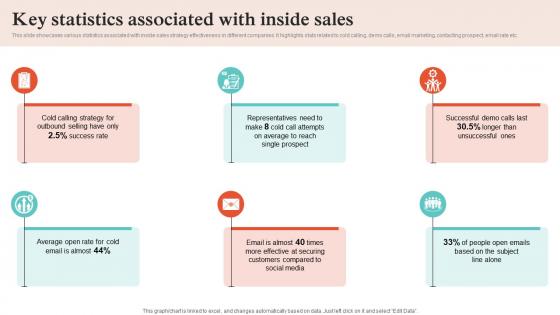
Virtual Sales Strategies Key Statistics Associated With Inside Sales Strategy SS V
This slide showcases various statistics associated with inside sales strategy effectiveness in different companies. It highlights stats related to cold calling, demo calls, email marketing, contacting prospect, email rate etc. Are you searching for a Virtual Sales Strategies Key Statistics Associated With Inside Sales Strategy SS V that is uncluttered, straightforward, and original Its easy to edit, and you can change the colors to suit your personal or business branding. For a presentation that expresses how much effort you have put in, this template is ideal With all of its features, including tables, diagrams, statistics, and lists, its perfect for a business plan presentation. Make your ideas more appealing with these professional slides. Download Virtual Sales Strategies Key Statistics Associated With Inside Sales Strategy SS V from Slidegeeks today. This slide showcases various statistics associated with inside sales strategy effectiveness in different companies. It highlights stats related to cold calling, demo calls, email marketing, contacting prospect, email rate etc.
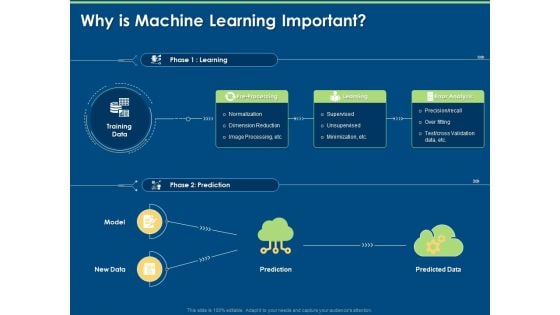
Artificial Intelligence Machine Learning Deep Learning Why Is Machine Learning Important Ppt PowerPoint Presentation Infographics Summary PDF
Presenting this set of slides with name artificial intelligence machine learning deep learning why is machine learning important ppt powerpoint presentation infographics summary pdf. This is a two stage process. The stages in this process are model, prediction, predicted data, precision recall, error analysis, learning, pre processing, normalization, training data. This is a completely editable PowerPoint presentation and is available for immediate download. Download now and impress your audience.
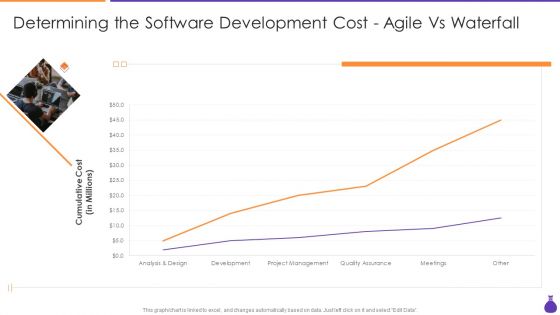
Why Is Agile Cost Effective IT Determining The Software Development Cost Agile Demonstration PDF
This graph or chart is linked to excel, and changes automatically based on data. Just left click on it and select Edit Data. Deliver and pitch your topic in the best possible manner with this Why Is Agile Cost Effective IT Determining The Software Development Cost Agile Demonstration PDF. Use them to share invaluable insights on Analysis And Design, Development, Project Management, Quality Assurance and impress your audience. This template can be altered and modified as per your expectations. So, grab it now.
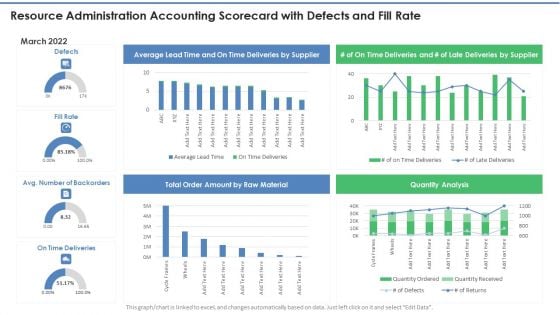
Resource Administration Accounting Scorecard With Defects And Fill Rate Mockup PDF
This graph or chart is linked to excel, and changes automatically based on data. Just left click on it and select Edit Data. Deliver and pitch your topic in the best possible manner with this Resource Administration Accounting Scorecard With Defects And Fill Rate Mockup PDF. Use them to share invaluable insights on Total Order Amount, Raw Material, Quantity Analysis and impress your audience. This template can be altered and modified as per your expectations. So, grab it now.
Business Workflow Automation Facts And Figures Icons PDF
This slide includes statistics and information related to recent and estimated growth of workflow automation in upcoming years. It includes statistics about market of workflow automation, business professional responses etc. This Business Workflow Automation Facts And Figures Icons PDF is perfect for any presentation, be it in front of clients or colleagues. It is a versatile and stylish solution for organizing your meetings. The Business Workflow Automation Facts And Figures Icons PDF features a modern design for your presentation meetings. The adjustable and customizable slides provide unlimited possibilities for acing up your presentation. Slidegeeks has done all the homework before launching the product for you. So, do not wait, grab the presentation templates today
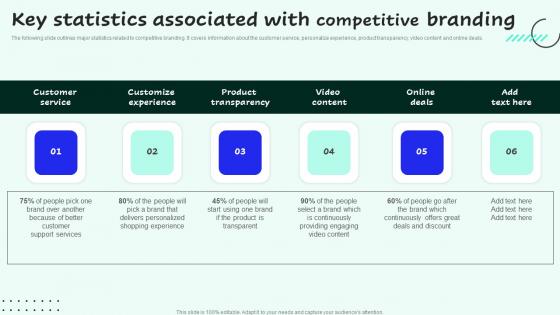
Key Statistics Associated With Competitive Branding Strategies For Enhancing Sales And Sample Pdf
The following slide outlines major statistics related to competitive branding. It covers information about the customer service, personalize experience, product transparency, video content and online deals. Formulating a presentation can take up a lot of effort and time, so the content and message should always be the primary focus. The visuals of the PowerPoint can enhance the presenters message, so our Key Statistics Associated With Competitive Branding Strategies For Enhancing Sales And Sample Pdf was created to help save time. Instead of worrying about the design, the presenter can concentrate on the message while our designers work on creating the ideal templates for whatever situation is needed. Slidegeeks has experts for everything from amazing designs to valuable content, we have put everything into Key Statistics Associated With Competitive Branding Strategies For Enhancing Sales And Sample Pdf The following slide outlines major statistics related to competitive branding. It covers information about the customer service, personalize experience, product transparency, video content and online deals.
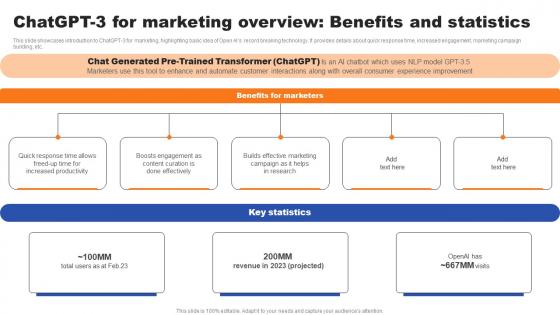
Chatgpt 3 For Marketing Overview Benefits And Statistics Ppt Professional Guide PDF
This slide showcases introduction to ChatGPT-3 for marketing, highlighting basic idea of Open AIs record breaking technology. It provides details about quick response time, increased engagement, marketing campaign building, etc. Are you searching for a Chatgpt 3 For Marketing Overview Benefits And Statistics Ppt Professional Guide PDF that is uncluttered, straightforward, and original Its easy to edit, and you can change the colors to suit your personal or business branding. For a presentation that expresses how much effort you have put in, this template is ideal With all of its features, including tables, diagrams, statistics, and lists, its perfect for a business plan presentation. Make your ideas more appealing with these professional slides. Download Chatgpt 3 For Marketing Overview Benefits And Statistics Ppt Professional Guide PDF from Slidegeeks today. This slide showcases introduction to ChatGPT-3 for marketing, highlighting basic idea of Open AIs record breaking technology. It provides details about quick response time, increased engagement, marketing campaign building, etc.
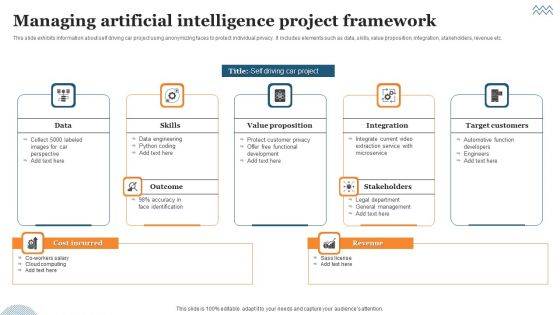
Managing Artificial Intelligence Project Framework Ppt Ideas Backgrounds PDF
This slide exhibits information about self driving car project using anonymizing faces to protect individual privacy. It includes elements such as data, skills, value proposition, integration, stakeholders, revenue etc. Presenting Managing Artificial Intelligence Project Framework Ppt Ideas Backgrounds PDF to dispense important information. This template comprises four stages. It also presents valuable insights into the topics including Data, Value Proposition, Integration. This is a completely customizable PowerPoint theme that can be put to use immediately. So, download it and address the topic impactfully.
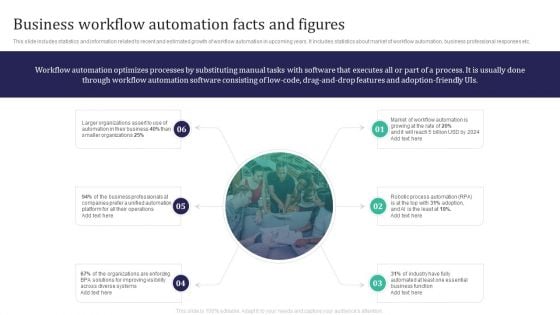
Integration Automation Business Workflow Automation Facts And Figures Elements PDF
This slide includes statistics and information related to recent and estimated growth of workflow automation in upcoming years. It includes statistics about market of workflow automation, business professional responses etc. There are so many reasons you need a Integration Automation Business Workflow Automation Facts And Figures Elements PDF. The first reason is you cant spend time making everything from scratch, Thus, Slidegeeks has made presentation templates for you too. You can easily download these templates from our website easily.

Bar Graph Showing Revenues Generated By Sales Department Ppt Portfolio Graphics Example PDF
This graph or chart is linked to excel, and changes automatically based on data. Just left click on it and select edit data. Showcasing this set of slides titled bar graph showing revenues generated by sales department ppt portfolio graphics example pdf. The topics addressed in these templates are yearly sales revenues, sales team, profits. All the content presented in this PPT design is completely editable. Download it and make adjustments in color, background, font etc. as per your unique business setting.
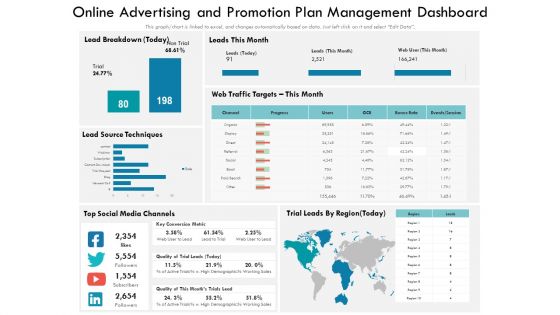
Online Advertising And Promotion Plan Management Dashboard Ppt PowerPoint Presentation Show Tips PDF
This graph chart is linked to excel, and changes automatically based on data. Just left click on it and select Edit Data. Showcasing this set of slides titled online advertising and promotion plan management dashboard ppt powerpoint presentation show tips pdf. The topics addressed in these templates are source techniques, social media channels, traffic targets. All the content presented in this PPT design is completely editable. Download it and make adjustments in color, background, font etc. as per your unique business setting.
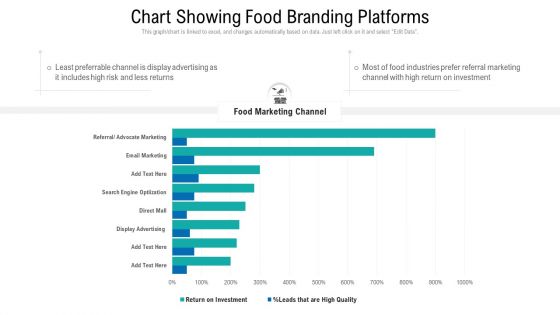
Chart Showing Food Branding Platforms Ppt Summary Gridlines PDF
This graph or chart is linked to excel, and changes automatically based on data. Just left click on it and select Edit Data. Showcasing this set of slides titled chart showing food branding platforms ppt summary gridlines pdf. The topics addressed in these templates are chart showing food branding platforms. All the content presented in this PPT design is completely editable. Download it and make adjustments in color, background, font etc. as per your unique business setting.
Finance Metrics Dashboard Illustrating Gross And Operating Profit Margin Icons PDF
This graph or chart is linked to excel, and changes automatically based on data. Just left click on it and select edit data. Showcasing this set of slides titled Finance Metrics Dashboard Illustrating Gross And Operating Profit Margin Icons PDF. The topics addressed in these templates are Gross Profit Margin, Operating Profit Margin, Net Profit Margin. All the content presented in this PPT design is completely editable. Download it and make adjustments in color, background, font etc. as per your unique business setting.
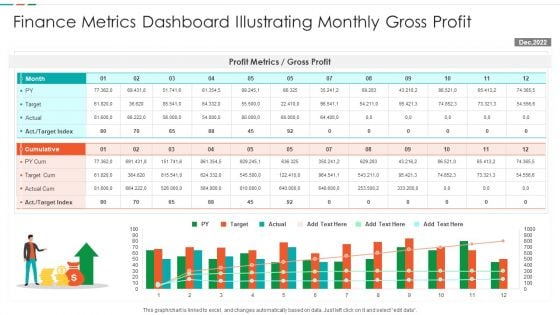
Finance Metrics Dashboard Illustrating Monthly Gross Profit Formats PDF
This graph or chart is linked to excel, and changes automatically based on data. Just left click on it and select edit data. Showcasing this set of slides titled Finance Metrics Dashboard Illustrating Monthly Gross Profit Formats PDF. The topics addressed in these templates are Profit Metrics Gross, Profit Target Cum, Actual Cum Target. All the content presented in this PPT design is completely editable. Download it and make adjustments in color, background, font etc. as per your unique business setting.
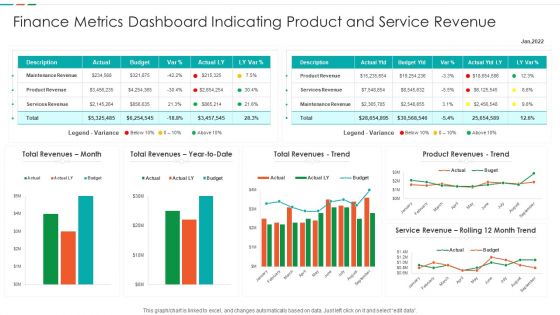
Finance Metrics Dashboard Indicating Product And Service Revenue Designs PDF
This graph or chart is linked to excel, and changes automatically based on data. Just left click on it and select edit data. Showcasing this set of slides titled Finance Metrics Dashboard Indicating Product And Service Revenue Designs PDF. The topics addressed in these templates are Maintenance Revenue Product, Revenue Product Revenues, Service Revenue Rolling. All the content presented in this PPT design is completely editable. Download it and make adjustments in color, background, font etc. as per your unique business setting.
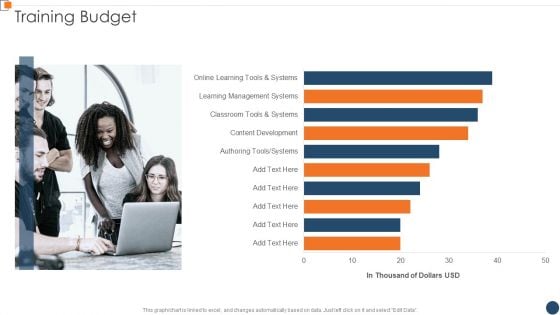
BANT Sales Lead Qualification Model Training Budget Template PDF
This graph or chart is linked to excel and change automatically based on data. Just left click on it and select Edit Data. Deliver an awe inspiring pitch with this creative BANT Sales Lead Qualification Model Training Budget Template PDF bundle. Topics like Content Development, Learning Management, Online Learning can be discussed with this completely editable template. It is available for immediate download depending on the needs and requirements of the user.
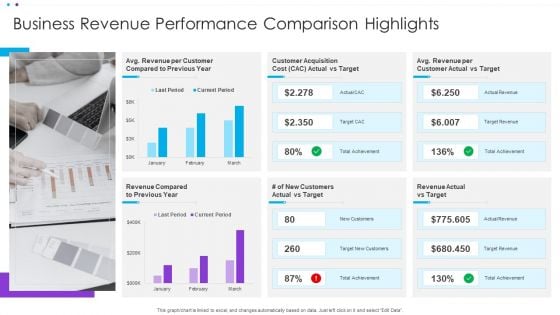
Business Revenue Performance Comparison Highlights Ppt Summary Rules PDF
This graph or chart is linked to excel, and changes automatically based on data. Just left click on it and select Edit Data. Showcasing this set of slides titled Business Revenue Performance Comparison Highlights Ppt Summary Rules PDF. The topics addressed in these templates are Customer Acquisition, Customer Actual, Revenue Compared. All the content presented in this PPT design is completely editable. Download it and make adjustments in color, background, font etc. as per your unique business setting.
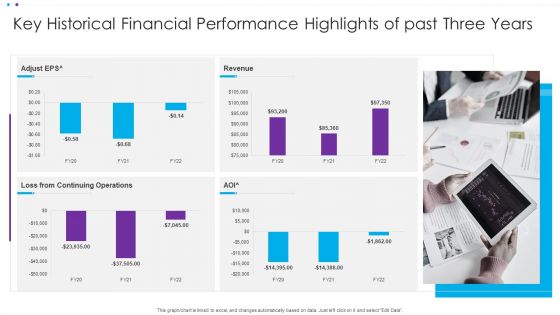
Key Historical Financial Performance Highlights Of Past Three Years Ppt Ideas Background PDF
This graph or chart is linked to excel, and changes automatically based on data. Just left click on it and select Edit Data. Showcasing this set of slides titled Key Historical Financial Performance Highlights Of Past Three Years Ppt Ideas Background PDF. The topics addressed in these templates are Continuing Operations, Adjust EP. All the content presented in this PPT design is completely editable. Download it and make adjustments in color, background, font etc. as per your unique business setting.
Social Media Marketing Performance Highlights With Key Campaign Results Ppt Icon PDF
This graph or chart is linked to excel, and changes automatically based on data. Just left click on it and select Edit Data. Showcasing this set of slides titled Social Media Marketing Performance Highlights With Key Campaign Results Ppt Icon PDF. The topics addressed in these templates are Profit Per, Overall Campaign, Total Budget. All the content presented in this PPT design is completely editable. Download it and make adjustments in color, background, font etc. as per your unique business setting.
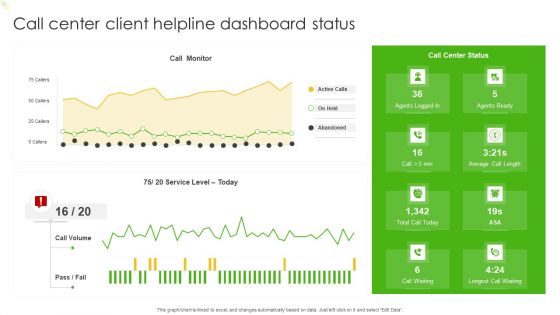
Call Center Client Helpline Dashboard Status Ppt Show Graphics Design PDF
This graph or chart is linked to excel, and changes automatically based on data. Just left click on it and select Edit Data. Showcasing this set of slides titled Call Center Client Helpline Dashboard Status Ppt Show Graphics Design PDF. The topics addressed in these templates are Call Monitor, Active Calls, Abandoned, Agents Ready. All the content presented in this PPT design is completely editable. Download it and make adjustments in color, background, font etc. as per your unique business setting.
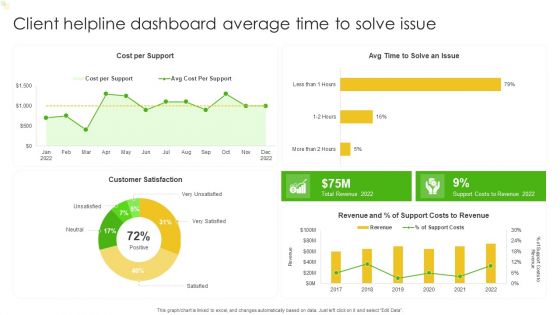
Client Helpline Dashboard Average Time To Solve Issue Ppt Portfolio Visuals PDF
This graph or chart is linked to excel, and changes automatically based on data. Just left click on it and select Edit Data. Showcasing this set of slides titled Client Helpline Dashboard Average Time To Solve Issue Ppt Portfolio Visuals PDF. The topics addressed in these templates are Cost Per Support, Customer Satisfaction, Costs To Revenue. All the content presented in this PPT design is completely editable. Download it and make adjustments in color, background, font etc. as per your unique business setting.
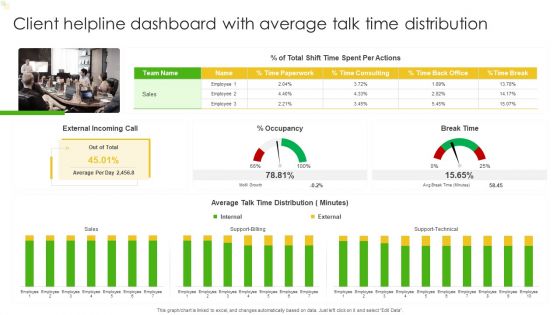
Client Helpline Dashboard With Average Talk Time Distribution Ppt Gallery Backgrounds PDF
This graph or chart is linked to excel, and changes automatically based on data. Just left click on it and select Edit Data. Showcasing this set of slides titled Client Helpline Dashboard With Average Talk Time Distribution Ppt Gallery Backgrounds PDF. The topics addressed in these templates are External Incoming Call, Occupancy, Break Time, Sales. All the content presented in this PPT design is completely editable. Download it and make adjustments in color, background, font etc. as per your unique business setting.
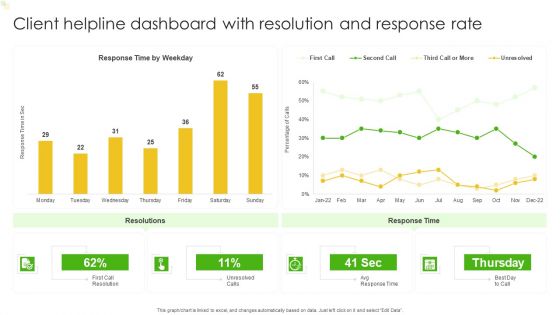
Client Helpline Dashboard With Resolution And Response Rate Ppt File Example Topics PDF
This graph or chart is linked to excel, and changes automatically based on data. Just left click on it and select Edit Data. Showcasing this set of slides titled Client Helpline Dashboard With Resolution And Response Rate Ppt File Example Topics PDF. The topics addressed in these templates are Resolutions, Response Time, Response Time Weekday. All the content presented in this PPT design is completely editable. Download it and make adjustments in color, background, font etc. as per your unique business setting.
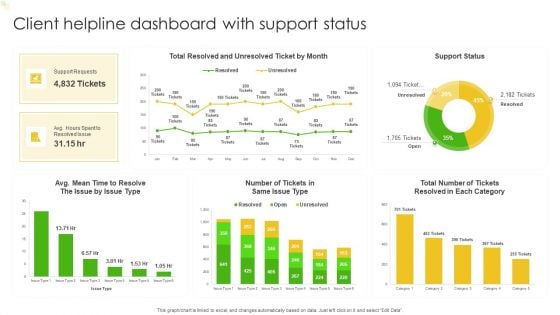
Client Helpline Dashboard With Support Status Ppt Portfolio Rules PDF
This graph or chart is linked to excel, and changes automatically based on data. Just left click on it and select Edit Data. Showcasing this set of slides titled Client Helpline Dashboard With Support Status Ppt Portfolio Rules PDF. The topics addressed in these templates are Total Number, Support Requests, Total Resolved, Support Status. All the content presented in this PPT design is completely editable. Download it and make adjustments in color, background, font etc. as per your unique business setting.
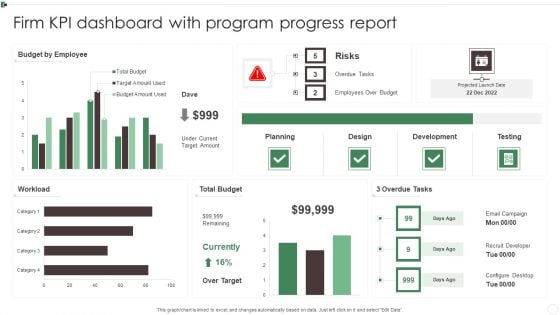
Firm KPI Dashboard With Program Progress Report Ppt Pictures Deck PDF
This graph or chart is linked to excel, and changes automatically based on data. Just left click on it and select Edit Data. Showcasing this set of slides titled Firm KPI Dashboard With Program Progress Report Ppt Pictures Deck PDF. The topics addressed in these templates are Budget By Employee, Total Budget, 3 Overdue Tasks, Workload. All the content presented in this PPT design is completely editable. Download it and make adjustments in color, background, font etc. as per your unique business setting.
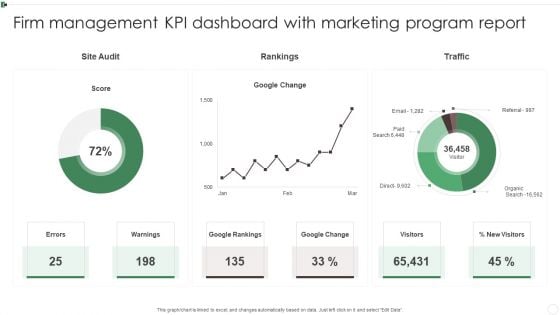
Firm Management KPI Dashboard With Marketing Program Report Ppt Styles Introduction PDF
This graph or chart is linked to excel, and changes automatically based on data. Just left click on it and select Edit Data. Showcasing this set of slides titled Firm Management KPI Dashboard With Marketing Program Report Ppt Styles Introduction PDF. The topics addressed in these templates are Google Rankings, Google Change, Warnings, Visitors. All the content presented in this PPT design is completely editable. Download it and make adjustments in color, background, font etc. as per your unique business setting.
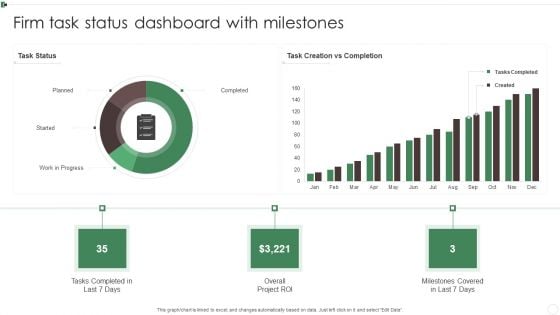
Firm Task Status Dashboard With Milestones Ppt Show Sample PDF
This graph or chart is linked to excel, and changes automatically based on data. Just left click on it and select Edit Data. Showcasing this set of slides titled Firm Task Status Dashboard With Milestones Ppt Show Sample PDF. The topics addressed in these templates are Tasks Completed, Planned, Work Progress, Overall Project ROI. All the content presented in this PPT design is completely editable. Download it and make adjustments in color, background, font etc. as per your unique business setting.
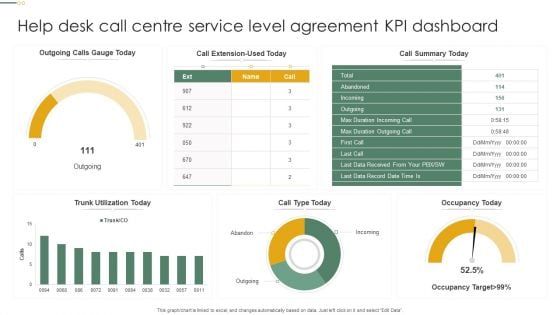
Help Desk Call Centre Service Level Agreement KPI Dashboard Pictures PDF
This graph or chart is linked to excel, and changes automatically based on data. Just left click on it and select Edit Data. Showcasing this set of slides titled Help Desk Call Centre Service Level Agreement KPI Dashboard Pictures PDF. The topics addressed in these templates are Call Type Today, Occupancy Today, Call Summary Today. All the content presented in this PPT design is completely editable. Download it and make adjustments in color, background, font etc. as per your unique business setting.
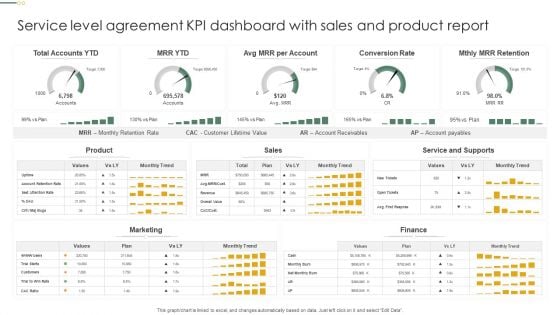
Service Level Agreement KPI Dashboard With Sales And Product Report Clipart PDF
This graph or chart is linked to excel, and changes automatically based on data. Just left click on it and select Edit Data. Showcasing this set of slides titled Service Level Agreement KPI Dashboard With Sales And Product Report Clipart PDF. The topics addressed in these templates are Total Accounts YTD, Conversion Rate, Mthly MRR Retention. All the content presented in this PPT design is completely editable. Download it and make adjustments in color, background, font etc. as per your unique business setting.
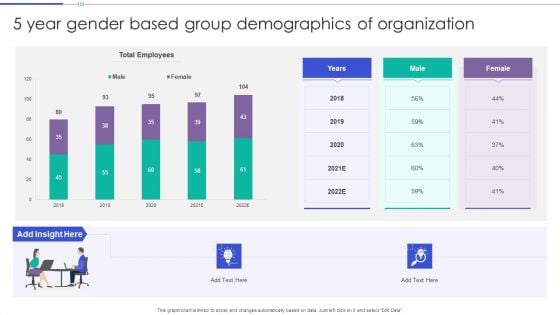
5 Year Gender Based Group Demographics Of Organization Background PDF
This graph or chart is linked to excel, and changes automatically based on data. Just left click on it and select Edit Data. Showcasing this set of slides titled 5 Year Gender Based Group Demographics Of Organization Background PDF. The topics addressed in these templates are Total Employees, Male, Female. All the content presented in this PPT design is completely editable. Download it and make adjustments in color, background, font etc. as per your unique business setting.
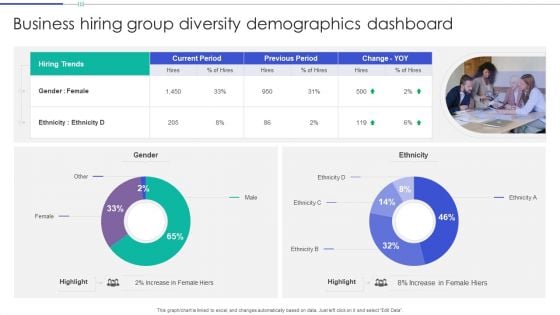
Business Hiring Group Diversity Demographics Dashboard Guidelines PDF
This graph or chart is linked to excel, and changes automatically based on data. Just left click on it and select Edit Data. Showcasing this set of slides titled Business Hiring Group Diversity Demographics Dashboard Guidelines PDF. The topics addressed in these templates are Hiring Trends, Current Period, Previous Period. All the content presented in this PPT design is completely editable. Download it and make adjustments in color, background, font etc. as per your unique business setting.
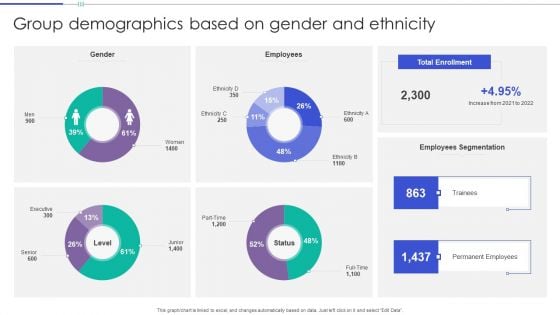
Group Demographics Based On Gender And Ethnicity Themes PDF
This graph or chart is linked to excel, and changes automatically based on data. Just left click on it and select Edit Data. Showcasing this set of slides titled Group Demographics Based On Gender And Ethnicity Themes PDF. The topics addressed in these templates are Gender, Employees, Total Enrollment. All the content presented in this PPT design is completely editable. Download it and make adjustments in color, background, font etc. as per your unique business setting.
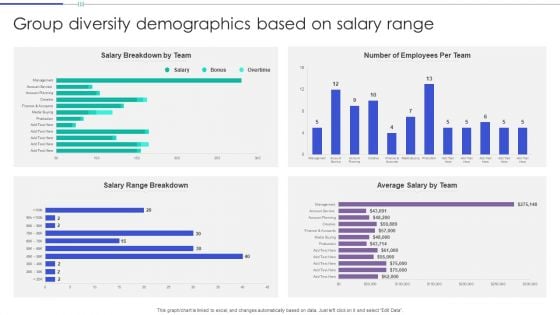
Group Diversity Demographics Based On Salary Range Portrait PDF
This graph or chart is linked to excel, and changes automatically based on data. Just left click on it and select Edit Data. Showcasing this set of slides titled Group Diversity Demographics Based On Salary Range Portrait PDF. The topics addressed in these templates are Salary Breakdown Team, Number Employees, Per Team. All the content presented in this PPT design is completely editable. Download it and make adjustments in color, background, font etc. as per your unique business setting.
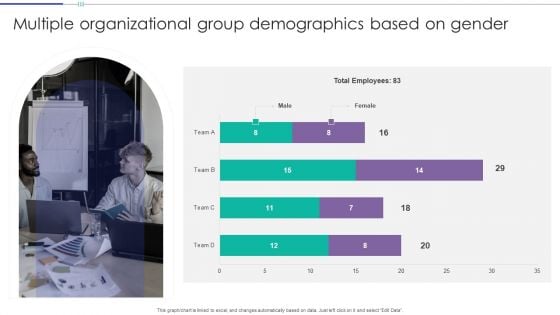
Multiple Organizational Group Demographics Based On Gender Download PDF
This graph or chart is linked to excel, and changes automatically based on data. Just left click on it and select Edit Data. Showcasing this set of slides titled Multiple Organizational Group Demographics Based On Gender Download PDF. The topics addressed in these templates are Total Employees, Team, Female. All the content presented in this PPT design is completely editable. Download it and make adjustments in color, background, font etc. as per your unique business setting.
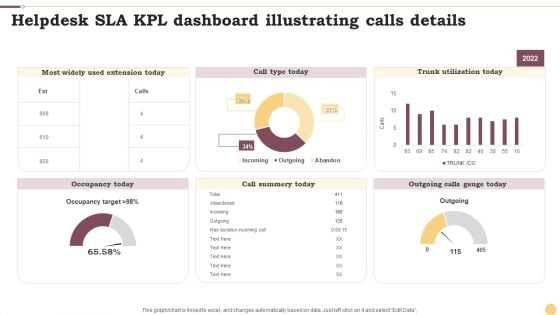
Helpdesk SLA KPL Dashboard Illustrating Calls Details Ppt Slides Show PDF
This graph or chart is linked to excel, and changes automatically based on data. Just left click on it and select Edit Data. Showcasing this set of slides titled Helpdesk SLA KPL Dashboard Illustrating Calls Details Ppt Slides Show PDF. The topics addressed in these templates are Call Type Today, Trunk Utilization Today, Call Summery Today. All the content presented in this PPT design is completely editable. Download it and make adjustments in color, background, font etc. as per your unique business setting.
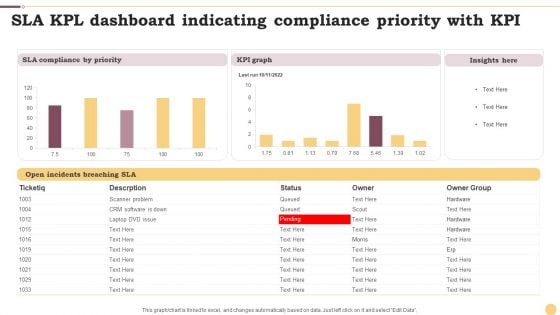
SLA KPL Dashboard Indicating Compliance Priority With KPI Ppt File Format PDF
This graph or chart is linked to excel, and changes automatically based on data. Just left click on it and select Edit Data. Showcasing this set of slides titled SLA KPL Dashboard Indicating Compliance Priority With KPI Ppt File Format PDF. The topics addressed in these templates are KPI Graph, Insights Here, SLA Compliance Priority. All the content presented in this PPT design is completely editable. Download it and make adjustments in color, background, font etc. as per your unique business setting.
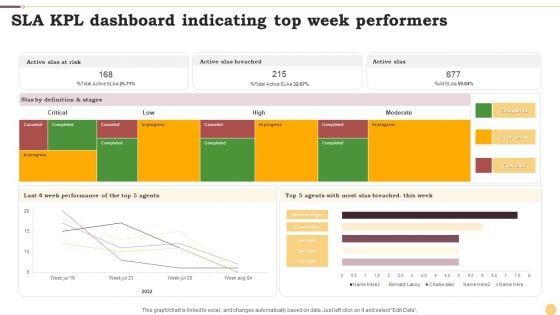
SLA KPL Dashboard Indicating Top Week Performers Ppt Infographics Examples PDF
This graph or chart is linked to excel, and changes automatically based on data. Just left click on it and select Edit Data. Showcasing this set of slides titled SLA KPL Dashboard Indicating Top Week Performers Ppt Infographics Examples PDF. The topics addressed in these templates are Active Slas Risk, Active Slas Breached, Active Slas. All the content presented in this PPT design is completely editable. Download it and make adjustments in color, background, font etc. as per your unique business setting.
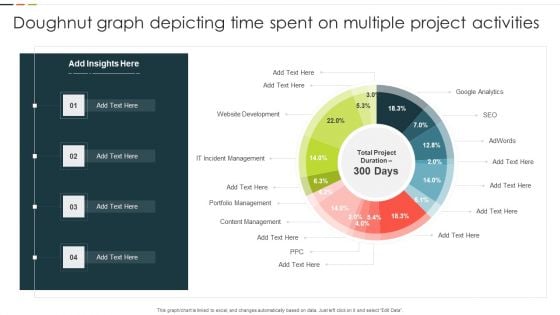
Doughnut Graph Depicting Time Spent On Multiple Project Activities Microsoft PDF
This graph or chart is linked to excel, and changes automatically based on data. Just left click on it and select Edit Data. Showcasing this set of slides titled Doughnut Graph Depicting Time Spent On Multiple Project Activities Microsoft PDF. The topics addressed in these templates are Website Development, IT Incident Management, Portfolio Management. All the content presented in this PPT design is completely editable. Download it and make adjustments in color, background, font etc. as per your unique business setting.
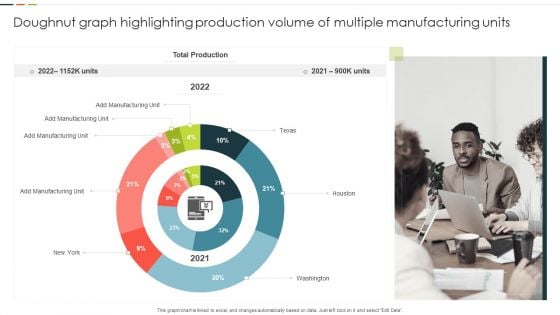
Doughnut Graph Highlighting Production Volume Of Multiple Manufacturing Units Guidelines PDF
This graph or chart is linked to excel, and changes automatically based on data. Just left click on it and select Edit Data. Showcasing this set of slides titled Doughnut Graph Highlighting Production Volume Of Multiple Manufacturing Units Guidelines PDF. The topics addressed in these templates are Total Production, Manufacturing Unit, Washington. All the content presented in this PPT design is completely editable. Download it and make adjustments in color, background, font etc. as per your unique business setting.
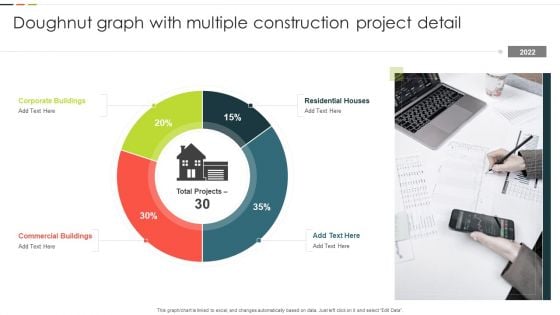
Doughnut Graph With Multiple Construction Project Detail Structure PDF
This graph or chart is linked to excel, and changes automatically based on data. Just left click on it and select Edit Data. Showcasing this set of slides titled Doughnut Graph With Multiple Construction Project Detail Structure PDF. The topics addressed in these templates are Corporate Buildings, Residential Houses, Commercial Buildings. All the content presented in this PPT design is completely editable. Download it and make adjustments in color, background, font etc. as per your unique business setting.
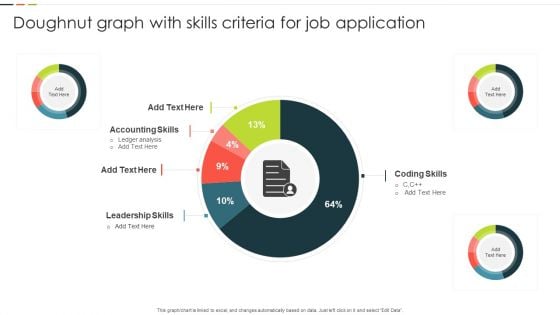
Doughnut Graph With Skills Criteria For Job Application Designs PDF
This graph or chart is linked to excel, and changes automatically based on data. Just left click on it and select Edit Data. Showcasing this set of slides titled Doughnut Graph With Skills Criteria For Job Application Designs PDF. The topics addressed in these templates are Accounting Skills, Leadership Skills, Coding Skills. All the content presented in this PPT design is completely editable. Download it and make adjustments in color, background, font etc. as per your unique business setting.
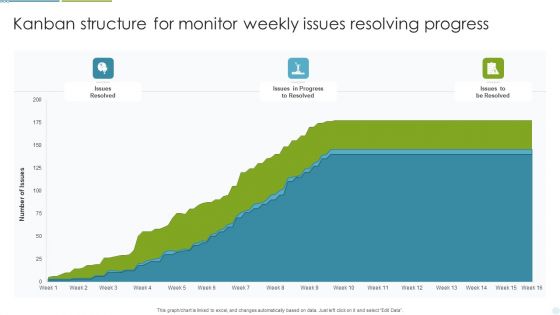
Kanban Structure For Monitor Weekly Issues Resolving Progress Ppt Professional Outline PDF
This graph or chart is linked to excel, and changes automatically based on data. Just left click on it and select Edit Data. Showcasing this set of slides titled Kanban Structure For Monitor Weekly Issues Resolving Progress Ppt Professional Outline PDF. The topics addressed in these templates are Issues Resolved, Progress To Resolved, Issues To Resolved. All the content presented in this PPT design is completely editable. Download it and make adjustments in color, background, font etc. as per your unique business setting.
Kanban Structure For Yearly Project Progress Tracking Ppt File Example Introduction PDF
This graph or chart is linked to excel, and changes automatically based on data. Just left click on it and select Edit Data. Showcasing this set of slides titled Kanban Structure For Yearly Project Progress Tracking Ppt File Example Introduction PDF. The topics addressed in these templates are Number Projects, Backlog Approved, Final Review. All the content presented in this PPT design is completely editable. Download it and make adjustments in color, background, font etc. as per your unique business setting.
Kanban Structure To Track Cycle Time For Project Execution Ppt Icon Images PDF
This graph or chart is linked to excel, and changes automatically based on data. Just left click on it and select Edit Data. Showcasing this set of slides titled Kanban Structure To Track Cycle Time For Project Execution Ppt Icon Images PDF. The topics addressed in these templates are Lead Time, Cycle Time, WIP Limit. All the content presented in this PPT design is completely editable. Download it and make adjustments in color, background, font etc. as per your unique business setting.
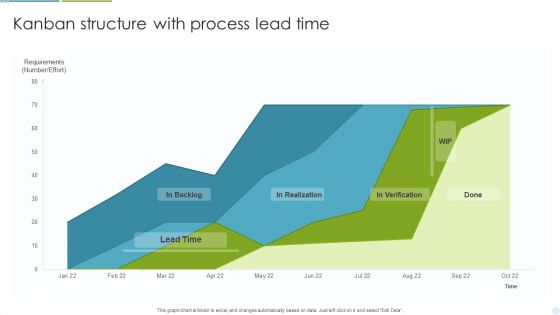
Kanban Structure With Process Lead Time Ppt Gallery Template PDF
This graph or chart is linked to excel, and changes automatically based on data. Just left click on it and select Edit Data. Showcasing this set of slides titled Kanban Structure With Process Lead Time Ppt Gallery Template PDF. The topics addressed in these templates are Lead Time, In Realization, Requirements. All the content presented in this PPT design is completely editable. Download it and make adjustments in color, background, font etc. as per your unique business setting.
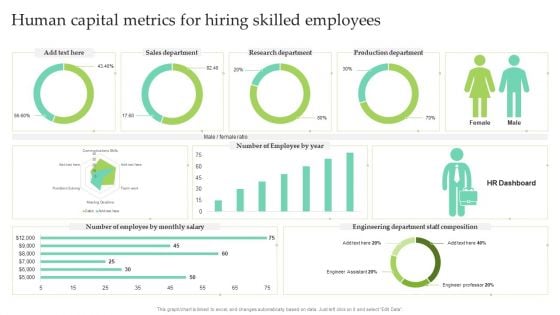
Human Capital Metrics For Hiring Skilled Employees Ppt Slides Themes PDF
This graph or chart is linked to excel, and changes automatically based on data. Just left click on it and select Edit Data. Showcasing this set of slides titled Human Capital Metrics For Hiring Skilled Employees Ppt Slides Themes PDF. The topics addressed in these templates are Sales Department, Research Department, Production Department. All the content presented in this PPT design is completely editable. Download it and make adjustments in color, background, font etc. as per your unique business setting.
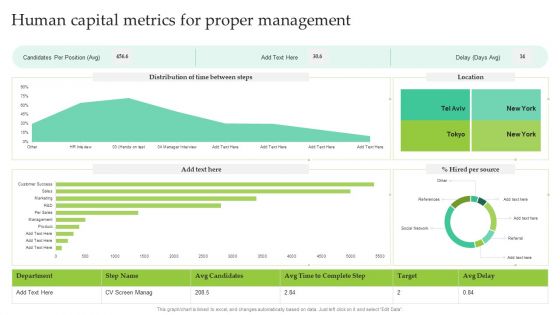
Human Capital Metrics For Proper Management Ppt Show Inspiration PDF
This graph or chart is linked to excel, and changes automatically based on data. Just left click on it and select Edit Data. Showcasing this set of slides titled Human Capital Metrics For Proper Management Ppt Show Inspiration PDF. The topics addressed in these templates are Candidates Per Position, Hired Per Source, Location. All the content presented in this PPT design is completely editable. Download it and make adjustments in color, background, font etc. as per your unique business setting.
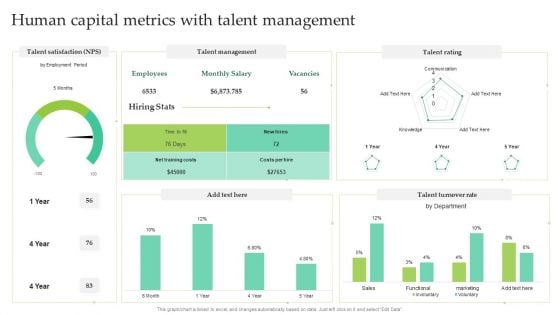
Human Capital Metrics With Talent Management Ppt Layouts Mockup PDF
This graph or chart is linked to excel, and changes automatically based on data. Just left click on it and select Edit Data. Showcasing this set of slides titled Human Capital Metrics With Talent Management Ppt Layouts Mockup PDF. The topics addressed in these templates are Talent Management, Talent Rating, Talent Turnover Rate. All the content presented in this PPT design is completely editable. Download it and make adjustments in color, background, font etc. as per your unique business setting.
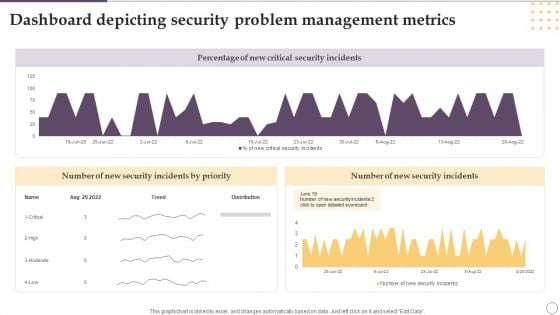
Dashboard Depicting Security Problem Management Metrics Ppt Gallery Designs PDF
This graph or chart is linked to excel, and changes automatically based on data. Just left click on it and select Edit Data. Showcasing this set of slides titled Dashboard Depicting Security Problem Management Metrics Ppt Gallery Designs PDF. The topics addressed in these templates are Percentage, New Critical, Security Incidents. All the content presented in this PPT design is completely editable. Download it and make adjustments in color, background, font etc. as per your unique business setting.
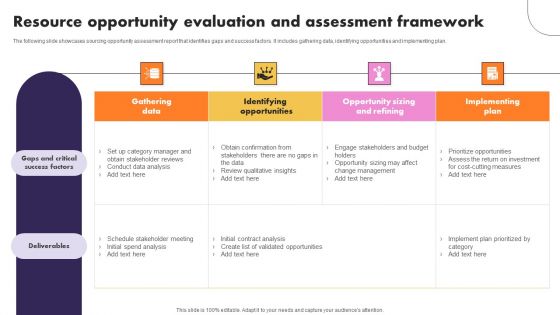
Resource Opportunity Evaluation And Assessment Framework Background PDF
The following slide showcases sourcing opportunity assessment report that identifies gaps and success factors. It includes gathering data, identifying opportunities and implementing plan. Showcasing this set of slides titled Resource Opportunity Evaluation And Assessment Framework Background PDF. The topics addressed in these templates are Gathering Data, Identifying Opportunities, Implementing Plan. All the content presented in this PPT design is completely editable. Download it and make adjustments in color, background, font etc. as per your unique business setting.
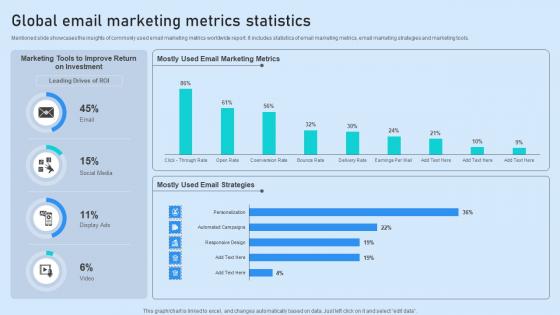
Global Email Marketing Metrics Statistics Structure Pdf
Mentioned slide showcases the insights of commonly used email marketing metrics worldwide report. It includes statistics of email marketing metrics, email marketing strategies and marketing tools. Showcasing this set of slides titled Global Email Marketing Metrics Statistics Structure Pdf. The topics addressed in these templates are Marketing Metrics, Strategies, Investment. All the content presented in this PPT design is completely editable. Download it and make adjustments in color, background, font etc. as per your unique business setting. Mentioned slide showcases the insights of commonly used email marketing metrics worldwide report. It includes statistics of email marketing metrics, email marketing strategies and marketing tools.
Energy Tracking Device Assess Performance Ppt PowerPoint Presentation Infographic Template Aids PDF
Presenting energy tracking device assess performance ppt powerpoint presentation infographic template aids pdf to provide visual cues and insights. Share and navigate important information on six stages that need your due attention. This template can be used to pitch topics like gather and track data, energy conservation projects tracking, establish baselines, benchmarking, analyze data, conduct technical assessments and audits. In addtion, this PPT design contains high-resolution images, graphics, etc, that are easily editable and available for immediate download.
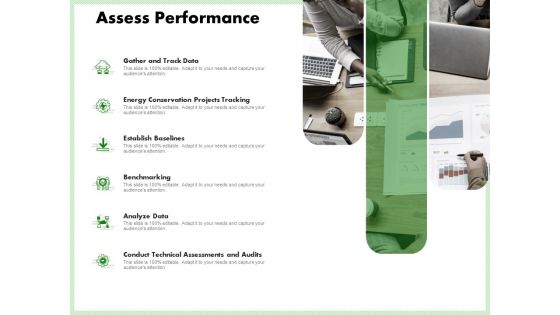
Eco Friendly And Feasibility Management Assess Performance Download PDF
Presenting eco friendly and feasibility management assess performance download pdf. to provide visual cues and insights. Share and navigate important information on six stages that need your due attention. This template can be used to pitch topics like gather and track data, establish baselines, benchmarking, analyze data, conservation projects tracking. In addtion, this PPT design contains high-resolution images, graphics, etc, that are easily editable and available for immediate download.


 Continue with Email

 Home
Home


