Data
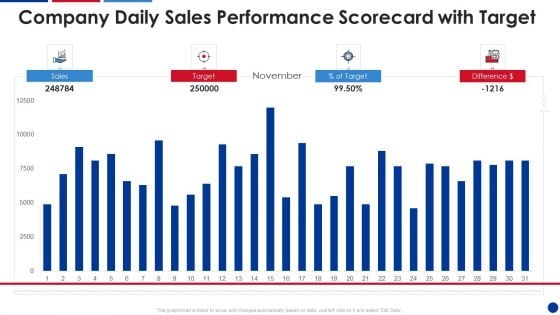
Company Daily Sales Performance Scorecard With Target Download PDF
This graph or chart is linked to excel, and changes automatically based on data. Just left click on it and select Edit Data. Deliver an awe inspiring pitch with this creative Company Daily Sales Performance Scorecard With Target Download PDF bundle. Topics like Sales Target can be discussed with this completely editable template. It is available for immediate download depending on the needs and requirements of the user.
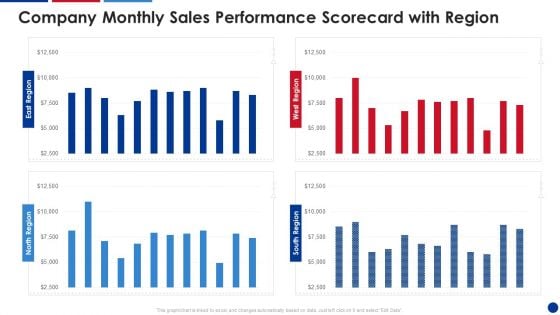
Company Monthly Sales Performance Scorecard With Region Sample PDF
This graph or chart is linked to excel, and changes automatically based on data. Just left click on it and select Edit Data. Deliver and pitch your topic in the best possible manner with this Company Monthly Sales Performance Scorecard With Region Sample PDF. Use them to share invaluable insights on Company Monthly, Sales Performance, Scorecard Region and impress your audience. This template can be altered and modified as per your expectations. So, grab it now.
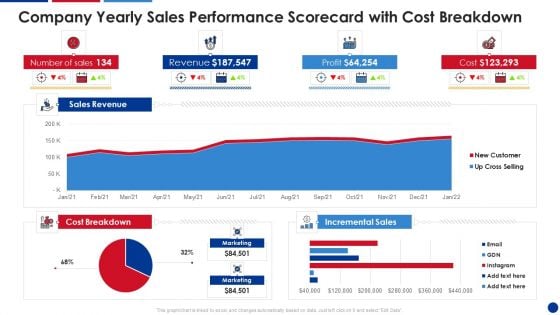
Company Yearly Sales Performance Scorecard With Cost Breakdown Elements PDF
This graph or chart is linked to excel, and changes automatically based on data. Just left click on it and select Edit Data. Deliver an awe inspiring pitch with this creative Company Yearly Sales Performance Scorecard With Cost Breakdown Elements PDF bundle. Topics like Sales Revenue, Incremental Sales, Cost Breakdown can be discussed with this completely editable template. It is available for immediate download depending on the needs and requirements of the user.
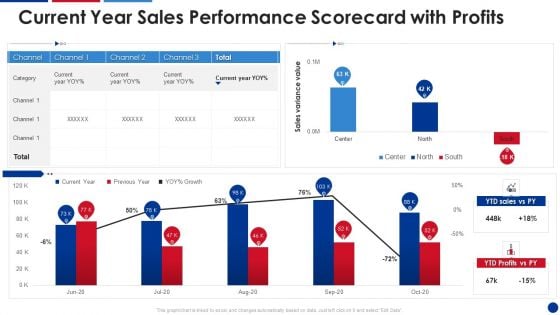
Current Year Sales Performance Scorecard With Profits Structure PDF
This graph or chart is linked to excel, and changes automatically based on data. Just left click on it and select Edit Data. Deliver and pitch your topic in the best possible manner with this Current Year Sales Performance Scorecard With Profits Structure PDF. Use them to share invaluable insights on Current Year, YTD Sales, Previous Year and impress your audience. This template can be altered and modified as per your expectations. So, grab it now.
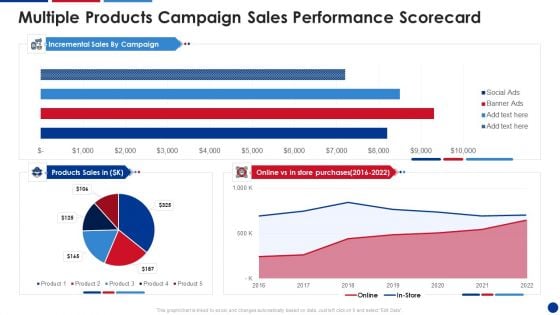
Multiple Products Campaign Sales Performance Scorecard Download PDF
This graph or chart is linked to excel, and changes automatically based on data. Just left click on it and select Edit Data. Deliver an awe inspiring pitch with this creative Multiple Products Campaign Sales Performance Scorecard Download PDF bundle. Topics like Incremental Sales, Products Sales, Store Purchases can be discussed with this completely editable template. It is available for immediate download depending on the needs and requirements of the user.
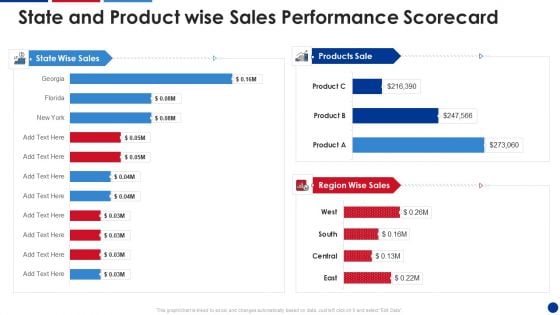
State And Product Wise Sales Performance Scorecard Summary PDF
This graph or chart is linked to excel, and changes automatically based on data. Just left click on it and select Edit Data. Deliver an awe inspiring pitch with this creative State And Product Wise Sales Performance Scorecard Summary PDF bundle. Topics like State Wise Sales, Products Sale, Region Wise Sales can be discussed with this completely editable template. It is available for immediate download depending on the needs and requirements of the user.
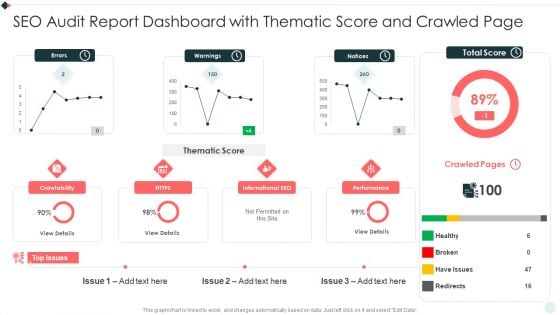
SEO Audit Summary To Increase SEO Audit Report Dashboard With Thematic Score Download PDF
This graph or chart is linked to excel, and changes automatically based on data. Just left click on it and select Edit Data. Deliver an awe inspiring pitch with this creative SEO Audit Summary To Increase SEO Audit Report Dashboard With Thematic Score Download PDF bundle. Topics like Total Score, Crawled Pages, Top Issues can be discussed with this completely editable template. It is available for immediate download depending on the needs and requirements of the user.
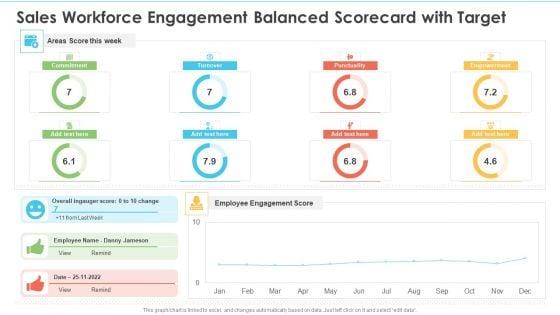
Sales Workforce Engagement Balanced Scorecard With Target Ppt Professional Designs Download PDF
This graph or chart is linked to excel, and changes automatically based on data. Just left click on it and select edit data. Deliver an awe inspiring pitch with this creative Sales Workforce Engagement Balanced Scorecard With Target Ppt Professional Designs Download PDF bundle. Topics like Areas Score Week, Employee Engagement Score, Overall Ingauger Score can be discussed with this completely editable template. It is available for immediate download depending on the needs and requirements of the user.
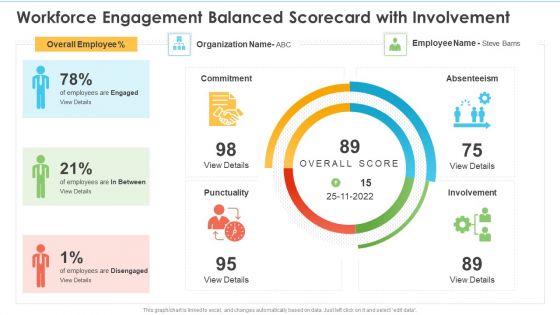
Workforce Engagement Balanced Scorecard With Involvement Ppt Portfolio Background Images PDF
This graph or chart is linked to excel, and changes automatically based on data. Just left click on it and select edit data. Deliver and pitch your topic in the best possible manner with this Workforce Engagement Balanced Scorecard With Involvement Ppt Portfolio Background Images PDF. Use them to share invaluable insights on Employee, Organization, Overall Employee and impress your audience. This template can be altered and modified as per your expectations. So, grab it now.
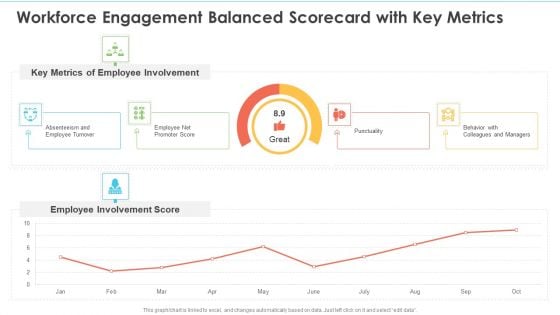
Workforce Engagement Balanced Scorecard With Key Metrics Ppt Inspiration Deck PDF
This graph or chart is linked to excel, and changes automatically based on data. Just left click on it and select edit data. Deliver an awe inspiring pitch with this creative Workforce Engagement Balanced Scorecard With Key Metrics Ppt Inspiration Deck PDF bundle. Topics like Key Metrics, Employee Involvement, Employee Involvement Score can be discussed with this completely editable template. It is available for immediate download depending on the needs and requirements of the user.
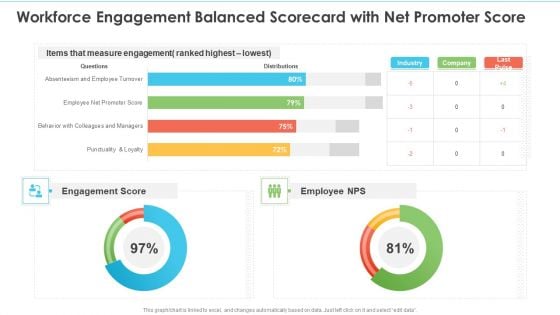
Workforce Engagement Balanced Scorecard With Net Promoter Score Ppt Slides Display PDF
This graph or chart is linked to excel, and changes automatically based on data. Just left click on it and select edit data. Deliver an awe inspiring pitch with this creative Workforce Engagement Balanced Scorecard With Net Promoter Score Ppt Slides Display PDF bundle. Topics like Measure Engagement, Engagement Score, Employee NPS can be discussed with this completely editable template. It is available for immediate download depending on the needs and requirements of the user.
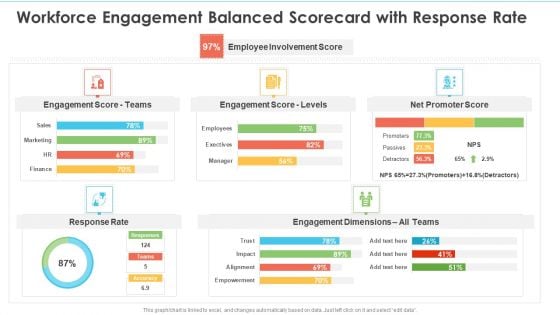
Workforce Engagement Balanced Scorecard With Response Rate Ppt Deck PDF
This graph or chart is linked to excel, and changes automatically based on data. Just left click on it and select edit data. Deliver an awe inspiring pitch with this creative Workforce Engagement Balanced Scorecard With Response Rate Ppt Deck PDF bundle. Topics like Engagement Score Teams, Engagement Score Levels, Net Promoter Score can be discussed with this completely editable template. It is available for immediate download depending on the needs and requirements of the user.
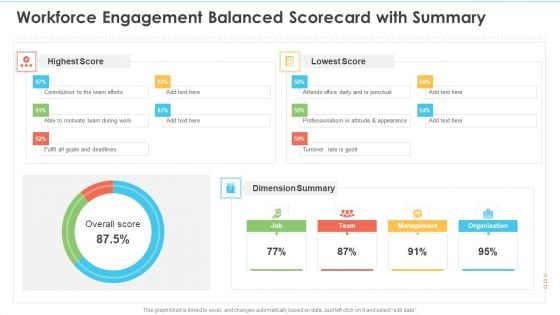
Workforce Engagement Balanced Scorecard With Summary Ppt Layouts Template PDF
This graph or chart is linked to excel, and changes automatically based on data. Just left click on it and select edit data. Deliver and pitch your topic in the best possible manner with this Workforce Engagement Balanced Scorecard With Summary Ppt Layouts Template PDF. Use them to share invaluable insights on Highest Score, Lowest Score, Dimension Summary and impress your audience. This template can be altered and modified as per your expectations. So, grab it now.
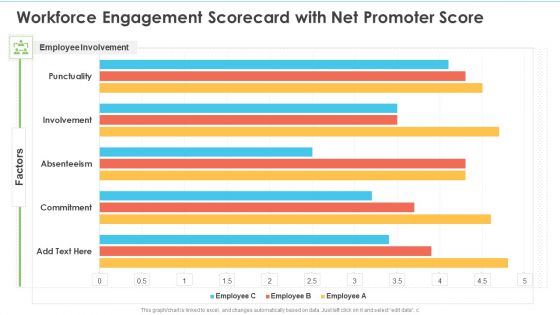
Workforce Engagement Scorecard With Net Promoter Score Ppt Portfolio Images PDF
This graph or chart is linked to excel, and changes automatically based on data. Just left click on it and select edit data. Deliver and pitch your topic in the best possible manner with this Workforce Engagement Scorecard With Net Promoter Score Ppt Portfolio Images PDF. Use them to share invaluable insights on Employee Involvement, Punctuality Involvement, Absenteeism and impress your audience. This template can be altered and modified as per your expectations. So, grab it now.
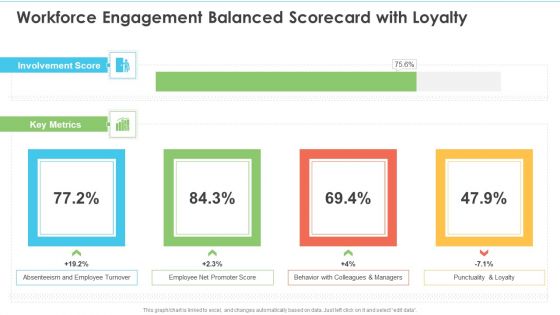
Workforce Engagement Balanced Scorecard With Loyalty Ppt Styles Good PDF
This graph or chart is linked to excel, and changes automatically based on data. Just left click on it and select edit data. Deliver an awe inspiring pitch with this creative Workforce Engagement Balanced Scorecard With Loyalty Ppt Styles Good PDF bundle. Topics like Involvement Score, Key Metrics, Employee Turnover can be discussed with this completely editable template. It is available for immediate download depending on the needs and requirements of the user.
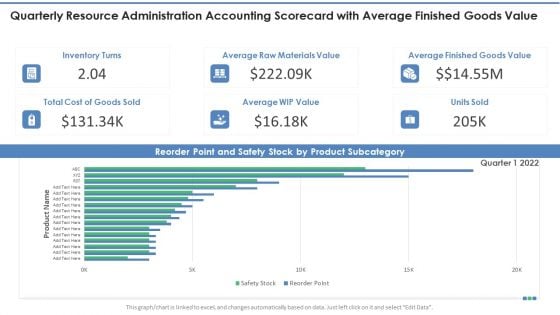
Quarterly Resource Administration Accounting Scorecard With Average Finished Goods Value Introduction PDF
This graph or chart is linked to excel, and changes automatically based on data. Just left click on it and select Edit Data. Deliver an awe inspiring pitch with this creative Quarterly Resource Administration Accounting Scorecard With Average Finished Goods Value Introduction PDF bundle. Topics like Inventory Turns, Average WIP Value, Total Cost Goods can be discussed with this completely editable template. It is available for immediate download depending on the needs and requirements of the user.
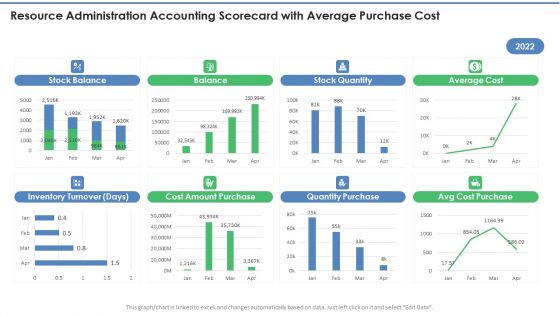
Resource Administration Accounting Scorecard With Average Purchase Cost Structure PDF
This graph or chart is linked to excel, and changes automatically based on data. Just left click on it and select Edit Data. Deliver and pitch your topic in the best possible manner with this Resource Administration Accounting Scorecard With Average Purchase Cost Structure PDF. Use them to share invaluable insights on Stock Balance, Stock Quantity, Average Cost and impress your audience. This template can be altered and modified as per your expectations. So, grab it now.
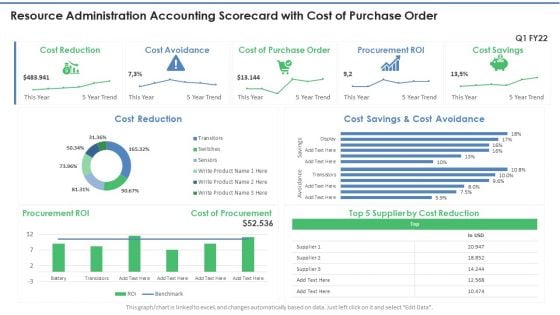
Resource Administration Accounting Scorecard With Cost Of Purchase Order Download PDF
This graph or chart is linked to excel, and changes automatically based on data. Just left click on it and select Edit Data. Deliver an awe inspiring pitch with this creative Resource Administration Accounting Scorecard With Cost Of Purchase Order Download PDF bundle. Topics like Cost Reduction, Cost Avoidance, Procurement ROI can be discussed with this completely editable template. It is available for immediate download depending on the needs and requirements of the user.
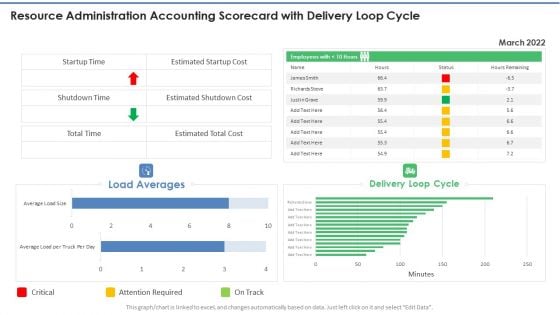
Resource Administration Accounting Scorecard With Delivery Loop Cycle Graphics PDF
This graph or chart is linked to excel, and changes automatically based on data. Just left click on it and select Edit Data. Deliver an awe inspiring pitch with this creative Resource Administration Accounting Scorecard With Delivery Loop Cycle Graphics PDF bundle. Topics like Load Averages, Delivery Loop Cycle, Attention Required can be discussed with this completely editable template. It is available for immediate download depending on the needs and requirements of the user.
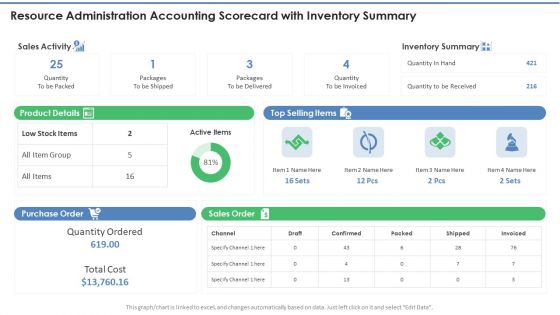
Resource Administration Accounting Scorecard With Inventory Summary Designs PDF
This graph or chart is linked to excel, and changes automatically based on data. Just left click on it and select Edit Data. Deliver and pitch your topic in the best possible manner with this Resource Administration Accounting Scorecard With Inventory Summary Designs PDF. Use them to share invaluable insights on Product Details, Top Selling Item, Purchase Order and impress your audience. This template can be altered and modified as per your expectations. So, grab it now.
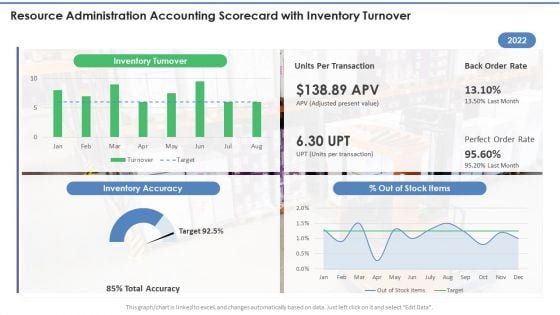
Resource Administration Accounting Scorecard With Inventory Turnover Microsoft PDF
This graph or chart is linked to excel, and changes automatically based on data. Just left click on it and select Edit Data. Deliver an awe inspiring pitch with this creative Resource Administration Accounting Scorecard With Inventory Turnover Microsoft PDF bundle. Topics like Inventory Turnover, Inventory Accuracy, Back Order Rate can be discussed with this completely editable template. It is available for immediate download depending on the needs and requirements of the user.

Resource Administration Accounting Scorecard With Inventory Value Infographics PDF
This graph or chart is linked to excel, and changes automatically based on data. Just left click on it and select Edit Data. Deliver and pitch your topic in the best possible manner with this Resource Administration Accounting Scorecard With Inventory Value Infographics PDF. Use them to share invaluable insights on Current Inventory, Stock Positions, Missing Stock and impress your audience. This template can be altered and modified as per your expectations. So, grab it now.
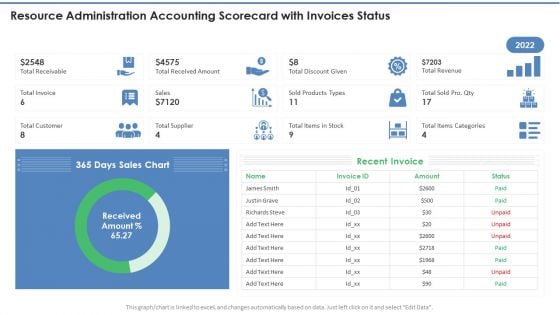
Resource Administration Accounting Scorecard With Invoices Status Topics PDF
This graph or chart is linked to excel, and changes automatically based on data. Just left click on it and select Edit Data. Deliver an awe inspiring pitch with this creative Resource Administration Accounting Scorecard With Invoices Status Topics PDF bundle. Topics like Recent Invoice, Sales Chart, Total Receivable can be discussed with this completely editable template. It is available for immediate download depending on the needs and requirements of the user.

Resource Administration Accounting Scorecard With Order And Inventory Details Mockup PDF
This graph or chart is linked to excel, and changes automatically based on data. Just left click on it and select Edit Data. Deliver and pitch your topic in the best possible manner with this Resource Administration Accounting Scorecard With Order And Inventory Details Mockup PDF. Use them to share invaluable insights on Volume Today, Financial Performance, State wise and impress your audience. This template can be altered and modified as per your expectations. So, grab it now.
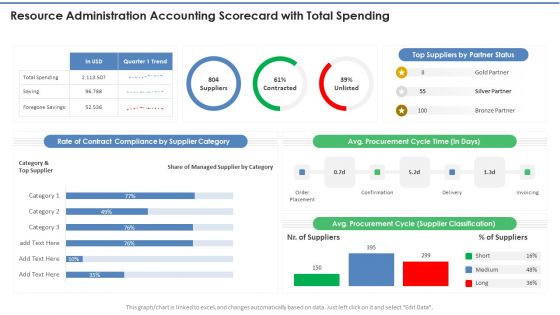
Resource Administration Accounting Scorecard With Total Spending Professional PDF
This graph or chart is linked to excel, and changes automatically based on data. Just left click on it and select Edit Data. Deliver and pitch your topic in the best possible manner with this Resource Administration Accounting Scorecard With Total Spending Professional PDF. Use them to share invaluable insights on Supplier Category, Cycle Time, Top Suppliers and impress your audience. This template can be altered and modified as per your expectations. So, grab it now.
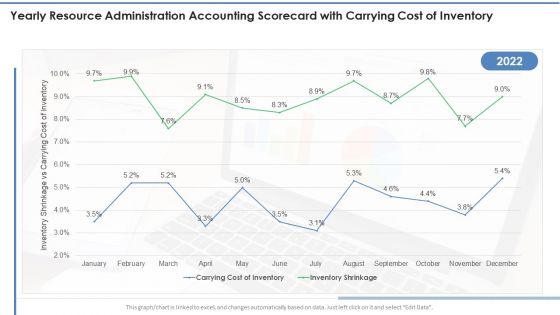
Yearly Resource Administration Accounting Scorecard With Carrying Cost Of Inventory Slides PDF
This graph or chart is linked to excel, and changes automatically based on data. Just left click on it and select Edit Data. Deliver an awe inspiring pitch with this creative Yearly Resource Administration Accounting Scorecard With Carrying Cost Of Inventory Slides PDF bundle. Topics like Carrying Cost Inventory, Inventory Shrinkage can be discussed with this completely editable template. It is available for immediate download depending on the needs and requirements of the user.
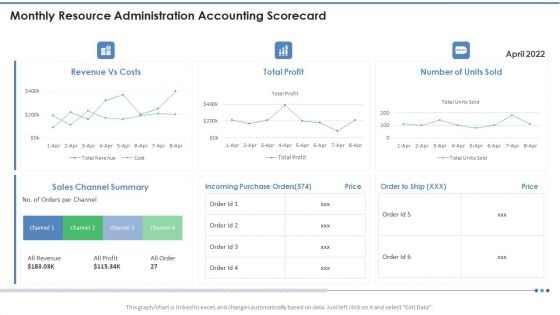
Monthly Resource Administration Accounting Scorecard Template PDF
This graph or chart is linked to excel, and changes automatically based on data. Just left click on it and select Edit Data. Deliver and pitch your topic in the best possible manner with this Monthly Resource Administration Accounting Scorecard Template PDF. Use them to share invaluable insights on Revenue Vs Costs, Total Profit, Number Units Sold and impress your audience. This template can be altered and modified as per your expectations. So, grab it now.
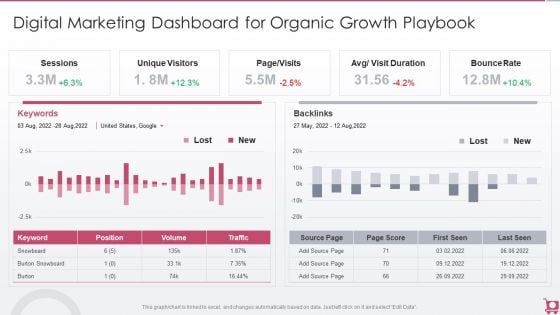
Playbook For Sales Growth Strategies Digital Marketing Dashboard For Organic Growth Designs PDF
This graph or chart is linked to excel, and changes automatically based on data. Just left click on it and select Edit Data. Deliver and pitch your topic in the best possible manner with this Playbook For Sales Growth Strategies Digital Marketing Dashboard For Organic Growth Designs PDF. Use them to share invaluable insights on Unique Visitors, Sessions, Bounce Rate and impress your audience. This template can be altered and modified as per your expectations. So, grab it now.
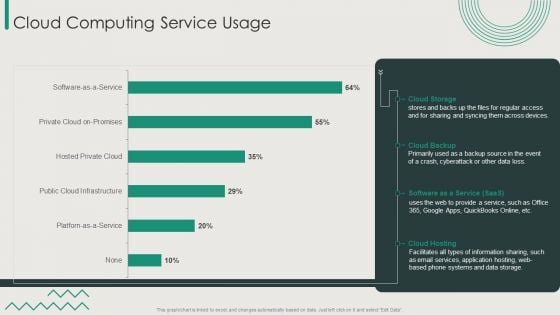
Organization Transition Cloud Computing Service Usage Ppt PowerPoint Presentation File Outfit PDF
This graph or chart is linked to excel, and changes automatically based on data. Just left click on it and select Edit Data. Deliver an awe inspiring pitch with this creative Organization Transition Cloud Computing Service Usage Ppt PowerPoint Presentation File Outfit PDF bundle. Topics like Cloud Storage, Cloud Backup, Cloud Hosting can be discussed with this completely editable template. It is available for immediate download depending on the needs and requirements of the user.
Sustainable Energy Resources Column Chart Ppt PowerPoint Presentation Icon Infographic Template PDF
This graph or chart is linked to excel, and changes automatically based on data. Just left click on it and select Edit Data. Deliver and pitch your topic in the best possible manner with this Sustainable Energy Resources Column Chart Ppt PowerPoint Presentation Icon Infographic Template PDF. Use them to share invaluable insights on Column Chart, 2017 To 2022 and impress your audience. This template can be altered and modified as per your expectations. So, grab it now.
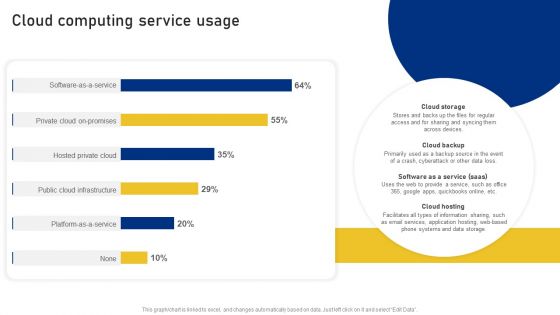
Reshaping Business In Digital Cloud Computing Service Usage Formats PDF
This graph or chart is linked to excel, and changes automatically based on data. Just left click on it and select Edit Data. Deliver an awe inspiring pitch with this creative Reshaping Business In Digital Cloud Computing Service Usage Formats PDF bundle. Topics like Private Cloud Promises, Hosted Private Cloud, Public Cloud Infrastructure can be discussed with this completely editable template. It is available for immediate download depending on the needs and requirements of the user.
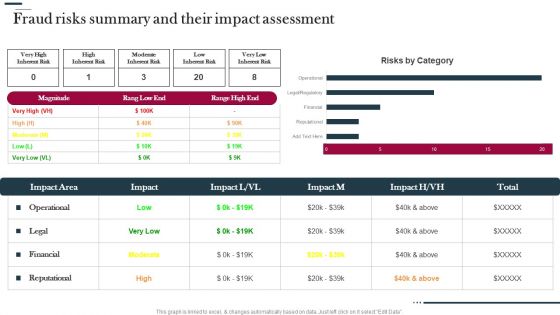
Various Strategies To Prevent Business Fraud Risks Summary And Their Impact Assessment Download PDF
This graph is linked to excel, and changes automatically based on data. Just left click on it select Edit Data. Deliver an awe inspiring pitch with this creative Various Strategies To Prevent Business Fraud Risks Summary And Their Impact Assessment Download PDF bundle. Topics like Risks Category, Operational, Legal can be discussed with this completely editable template. It is available for immediate download depending on the needs and requirements of the user.
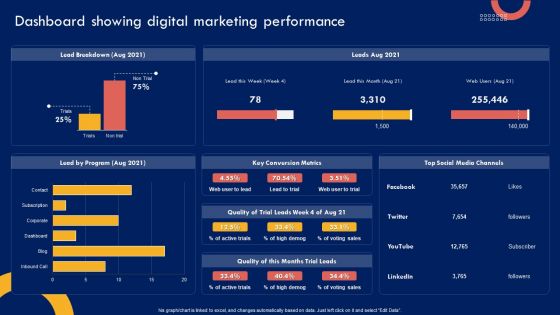
Product Marketing Leadership Dashboard Showing Digital Marketing Performance Download PDF
This graph OR chart is linked to excel, and changes automatically based on data. Just left click on it and select Edit Data. There are so many reasons you need a Product Marketing Leadership Dashboard Showing Digital Marketing Performance Download PDF. The first reason is you cant spend time making everything from scratch, Thus, Slidegeeks has made presentation templates for you too. You can easily download these templates from our website easily.
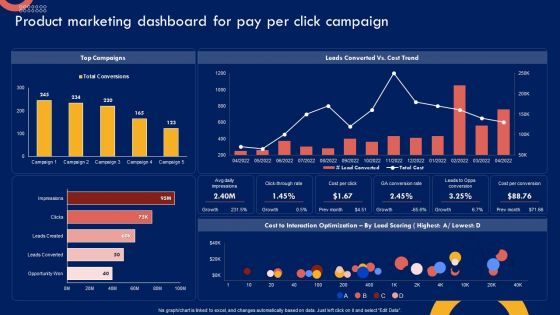
Product Marketing Leadership Product Marketing Dashboard For Pay Per Microsoft PDF
This graph or chart is linked to excel, and changes automatically based on data. Just left click on it and select Edit Data. Find a pre-designed and impeccable Product Marketing Leadership Product Marketing Dashboard For Pay Per Microsoft PDF. The templates can ace your presentation without additional effort. You can download these easy-to-edit presentation templates to make your presentation stand out from others. So, what are you waiting for Download the template from Slidegeeks today and give a unique touch to your presentation.
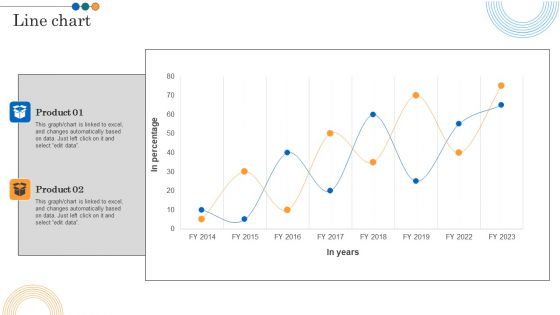
Implementing Marketing Strategies Line Chart Ppt PowerPoint Presentation File Mockup PDF
This graph or chart is linked to excel, and changes automatically based on data. Just left click on it and select edit data. There are so many reasons you need a Implementing Marketing Strategies Line Chart Ppt PowerPoint Presentation File Mockup PDF. The first reason is you can not spend time making everything from scratch, Thus, Slidegeeks has made presentation templates for you too. You can easily download these templates from our website easily.

Statistical Technique And Tools Lean Six Sigma In Manufacturing Ppt Template
This slide shows main tools that are used in analysing phase for checking reliability of data. It include tools such as hypothesis testing, regression analysis and analysis of variance, etc. Are you in need of a template that can accommodate all of your creative concepts This one is crafted professionally and can be altered to fit any style. Use it with Google Slides or PowerPoint. Include striking photographs, symbols, depictions, and other visuals. Fill, move around, or remove text boxes as desired. Test out color palettes and font mixtures. Edit and save your work, or work with colleagues. Download Statistical Technique And Tools Lean Six Sigma In Manufacturing Ppt Template and observe how to make your presentation outstanding. Give an impeccable presentation to your group and make your presentation unforgettable. This slide shows main tools that are used in analysing phase for checking reliability of data. It include tools such as hypothesis testing, regression analysis and analysis of variance, etc.
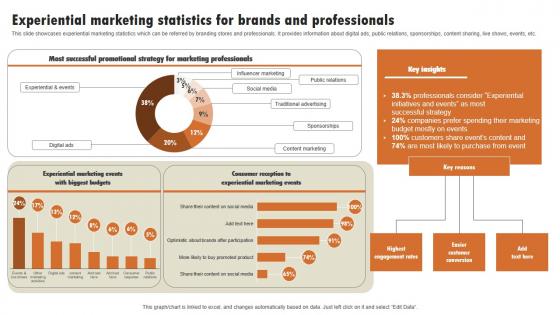
Experiential Marketing Statistics For Brands And Experiential Marketing Technique Designs PDF
This slide showcases experiential marketing statistics which can be referred by branding stores and professionals. It provides information about digital ads, public relations, sponsorships, content sharing, live shows, events, etc. Explore a selection of the finest Experiential Marketing Statistics For Brands And Experiential Marketing Technique Designs PDF here. With a plethora of professionally designed and pre-made slide templates, you can quickly and easily find the right one for your upcoming presentation. You can use our Experiential Marketing Statistics For Brands And Experiential Marketing Technique Designs PDF to effectively convey your message to a wider audience. Slidegeeks has done a lot of research before preparing these presentation templates. The content can be personalized and the slides are highly editable. Grab templates today from Slidegeeks. This slide showcases experiential marketing statistics which can be referred by branding stores and professionals. It provides information about digital ads, public relations, sponsorships, content sharing, live shows, events, etc.
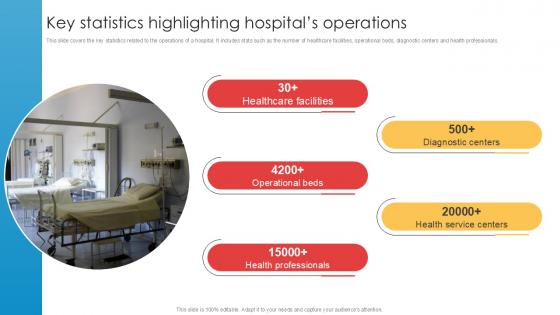
Key Statistics Highlighting Hospitals Operations Implementation Of Online Ppt Sample
This slide covers the key statistics related to the operations of a hospital. It includes stats such as the number of healthcare facilities, operational beds, diagnostic centers and health professionals. Here you can discover an assortment of the finest PowerPoint and Google Slides templates. With these templates, you can create presentations for a variety of purposes while simultaneously providing your audience with an eye-catching visual experience. Download Key Statistics Highlighting Hospitals Operations Implementation Of Online Ppt Sample to deliver an impeccable presentation. These templates will make your job of preparing presentations much quicker, yet still, maintain a high level of quality. Slidegeeks has experienced researchers who prepare these templates and write high-quality content for you. Later on, you can personalize the content by editing the Key Statistics Highlighting Hospitals Operations Implementation Of Online Ppt Sample. This slide covers the key statistics related to the operations of a hospital. It includes stats such as the number of healthcare facilities, operational beds, diagnostic centers and health professionals.
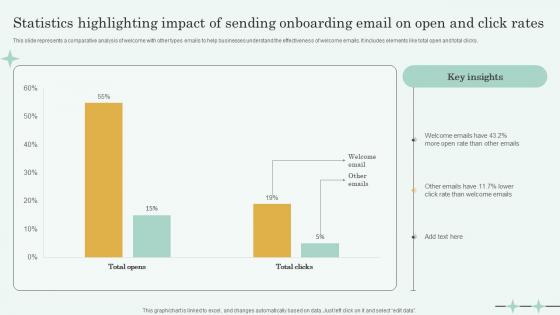
Statistics Highlighting Impact Of Sending Onboarding Email On Open And Click Rates Sample Pdf
This slide represents a comparative analysis of welcome with other types emails to help businesses understand the effectiveness of welcome emails. It includes elements like total open and total clicks. Pitch your topic with ease and precision using this Statistics Highlighting Impact Of Sending Onboarding Email On Open And Click Rates Sample Pdf. This layout presents information on Welcome Emails, Open Rate, Sending Onboarding Email. It is also available for immediate download and adjustment. So, changes can be made in the color, design, graphics or any other component to create a unique layout. This slide represents a comparative analysis of welcome with other types emails to help businesses understand the effectiveness of welcome emails. It includes elements like total open and total clicks.
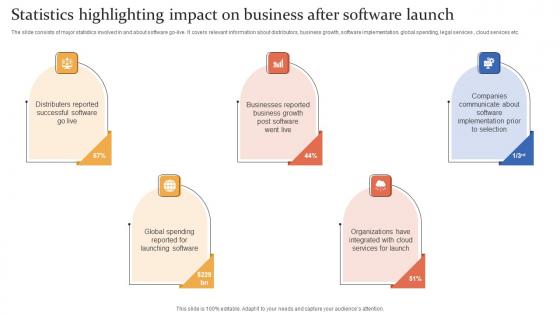
Statistics Highlighting Impact On Business After Software Launch Introduction Pdf
The slide consists of major statistics involved in and about software go live. It covers relevant information about distributors, business growth, software implementation, global spending, legal services , cloud services etc.Showcasing this set of slides titled Statistics Highlighting Impact On Business After Software Launch Introduction Pdf The topics addressed in these templates are Distributers Reported, Businesses Reported, Launching Software All the content presented in this PPT design is completely editable. Download it and make adjustments in color, background, font etc. as per your unique business setting. The slide consists of major statistics involved in and about software go live. It covers relevant information about distributors, business growth, software implementation, global spending, legal services , cloud services etc.
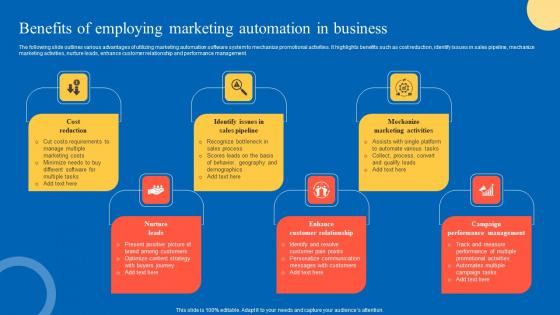
Benefits Of Employing Strategic Guide For Marketing Program Information Pdf
The following slide outlines various advantages of utilizing marketing automation software system to mechanize promotional activities. It highlights benefits such as cost reduction, identify issues in sales pipeline, mechanize marketing activities, nurture leads, enhance customer relationship and performance management. There are so many reasons you need a Benefits Of Employing Strategic Guide For Marketing Program Information Pdf. The first reason is you can not spend time making everything from scratch, Thus, Slidegeeks has made presentation templates for you too. You can easily download these templates from our website easily. The following slide outlines various advantages of utilizing marketing automation software system to mechanize promotional activities. It highlights benefits such as cost reduction, identify issues in sales pipeline, mechanize marketing activities, nurture leads, enhance customer relationship and performance management.
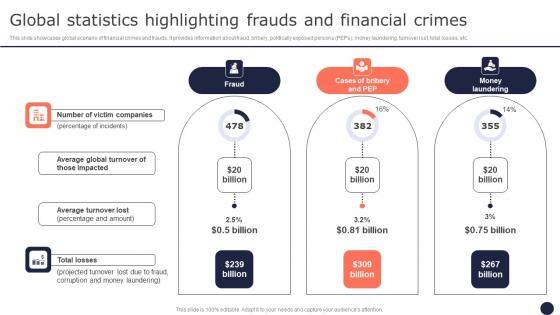
Global Statistics Highlighting Frauds And Financial Mitigating Corporate Scams And Robberies Clipart Pdf
This slide showcases global scenario of financial crimes and frauds. It provides information about fraud, bribery, politically exposed persons PEPs, money laundering, turnover lost, total losses, etc. Are you in need of a template that can accommodate all of your creative concepts This one is crafted professionally and can be altered to fit any style. Use it with Google Slides or PowerPoint. Include striking photographs, symbols, depictions, and other visuals. Fill, move around, or remove text boxes as desired. Test out color palettes and font mixtures. Edit and save your work, or work with colleagues. Download Global Statistics Highlighting Frauds And Financial Mitigating Corporate Scams And Robberies Clipart Pdf and observe how to make your presentation outstanding. Give an impeccable presentation to your group and make your presentation unforgettable. This slide showcases global scenario of financial crimes and frauds. It provides information about fraud, bribery, politically exposed persons PEPs, money laundering, turnover lost, total losses, etc.
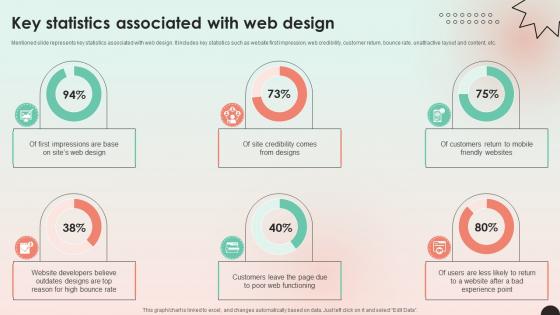
Web Consulting Business Performance Key Statistics Associated With Web Design
Mentioned slide represents key statistics associated with web design. It includes key statistics such as website first impression, web credibility, customer return, bounce rate, unattractive layout and content, etc. Do you have an important presentation coming up Are you looking for something that will make your presentation stand out from the rest Look no further than Web Consulting Business Performance Key Statistics Associated With Web Design. With our professional designs, you can trust that your presentation will pop and make delivering it a smooth process. And with Slidegeeks, you can trust that your presentation will be unique and memorable. So why wait Grab Web Consulting Business Performance Key Statistics Associated With Web Design today and make your presentation stand out from the rest Mentioned slide represents key statistics associated with web design. It includes key statistics such as website first impression, web credibility, customer return, bounce rate, unattractive layout and content, etc.
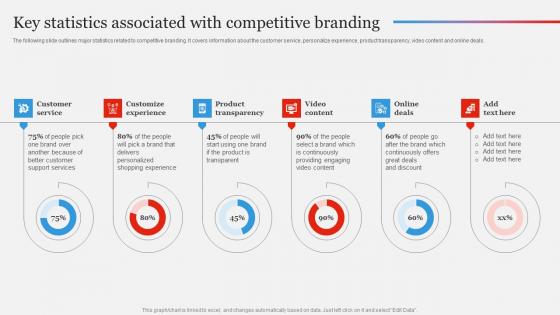
Key Statistics Associated Branding Strategy To Gain Competitive Edge Elements Pdf
The following slide outlines major statistics related to competitive branding. It covers information about the customer service, personalize experience, product transparency, video content and online deals. Coming up with a presentation necessitates that the majority of the effort goes into the content and the message you intend to convey. The visuals of a PowerPoint presentation can only be effective if it supplements and supports the story that is being told. Keeping this in mind our experts created Key Statistics Associated Branding Strategy To Gain Competitive Edge Elements Pdf to reduce the time that goes into designing the presentation. This way, you can concentrate on the message while our designers take care of providing you with the right template for the situation. The following slide outlines major statistics related to competitive branding. It covers information about the customer service, personalize experience, product transparency, video content and online deals.
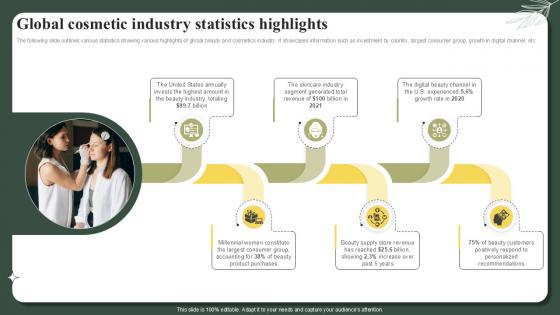
Global Cosmetic Industry Statistics Highlights Successful Launch Ppt Sample
The following slide outlines various statistics showing various highlights of global beauty and cosmetics industry. It showcases information such as investment by country, largest consumer group, growth in digital channel, etc. Formulating a presentation can take up a lot of effort and time, so the content and message should always be the primary focus. The visuals of the PowerPoint can enhance the presenters message, so our Global Cosmetic Industry Statistics Highlights Successful Launch Ppt Sample was created to help save time. Instead of worrying about the design, the presenter can concentrate on the message while our designers work on creating the ideal templates for whatever situation is needed. Slidegeeks has experts for everything from amazing designs to valuable content, we have put everything into Global Cosmetic Industry Statistics Highlights Successful Launch Ppt Sample The following slide outlines various statistics showing various highlights of global beauty and cosmetics industry. It showcases information such as investment by country, largest consumer group, growth in digital channel, etc.
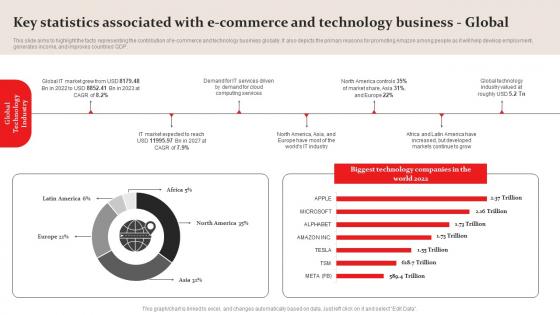
Amazon Business Plan Go To Market Strategy Key Statistics Associated With E Commerce Diagrams Pdf
This slide aims to highlight the facts representing the contribution of e commerce and technology business globally. It also depicts the primary reasons for promoting Amazon among people as it will help develop employment, generates income, and improves countries GDP. There are so many reasons you need a Amazon Business Plan Go To Market Strategy Key Statistics Associated With E Commerce Diagrams Pdf. The first reason is you can not spend time making everything from scratch, Thus, Slidegeeks has made presentation templates for you too. You can easily download these templates from our website easily. This slide aims to highlight the facts representing the contribution of e commerce and technology business globally. It also depicts the primary reasons for promoting Amazon among people as it will help develop employment, generates income, and improves countries GDP.

Global Statistics And Facts Of Pharmaceutical Accelerating Market Share And Profitability MKT SS V
This slide showcases the global statistics and facts of pharmaceutical industry. It includes stats such as pharmaceutical market size, Global RandD spending, rapid increase of generic drug market and pharmaceutical sales. Are you in need of a template that can accommodate all of your creative concepts This one is crafted professionally and can be altered to fit any style. Use it with Google Slides or PowerPoint. Include striking photographs, symbols, depictions, and other visuals. Fill, move around, or remove text boxes as desired. Test out color palettes and font mixtures. Edit and save your work, or work with colleagues. Download Global Statistics And Facts Of Pharmaceutical Accelerating Market Share And Profitability MKT SS V and observe how to make your presentation outstanding. Give an impeccable presentation to your group and make your presentation unforgettable. This slide showcases the global statistics and facts of pharmaceutical industry. It includes stats such as pharmaceutical market size, Global RandD spending, rapid increase of generic drug market and pharmaceutical sales.
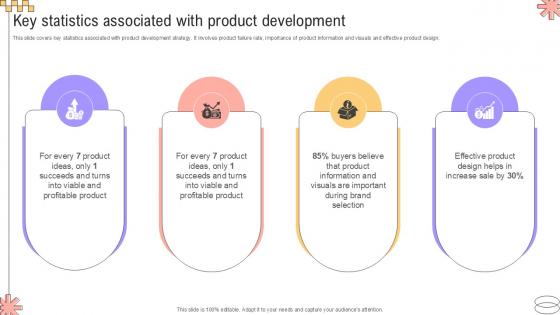
Key Statistics Associated With Product Implementing Geographic Extension PPT PowerPoint Strategy SS V
This slide covers key statistics associated with product development strategy. It involves product failure rate, importance of product information and visuals and effective product design. Formulating a presentation can take up a lot of effort and time, so the content and message should always be the primary focus. The visuals of the PowerPoint can enhance the presenters message, so our Key Statistics Associated With Product Implementing Geographic Extension PPT PowerPoint Strategy SS V was created to help save time. Instead of worrying about the design, the presenter can concentrate on the message while our designers work on creating the ideal templates for whatever situation is needed. Slidegeeks has experts for everything from amazing designs to valuable content, we have put everything into Key Statistics Associated With Product Implementing Geographic Extension PPT PowerPoint Strategy SS V This slide covers key statistics associated with product development strategy. It involves product failure rate, importance of product information and visuals and effective product design.
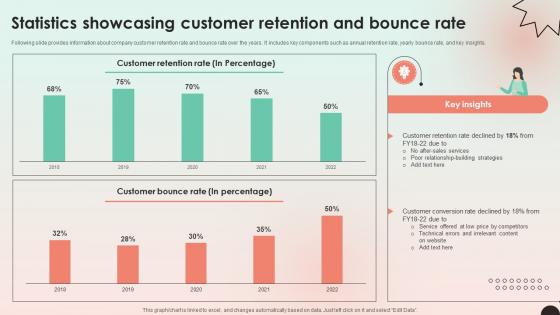
Web Consulting Business Performance Statistics Showcasing Customer Retention
Following slide provides information about company customer retention rate and bounce rate over the years. It includes key components such as annual retention rate, yearly bounce rate, and key insights. Find highly impressive Web Consulting Business Performance Statistics Showcasing Customer Retention on Slidegeeks to deliver a meaningful presentation. You can save an ample amount of time using these presentation templates. No need to worry to prepare everything from scratch because Slidegeeks experts have already done a huge research and work for you. You need to download Web Consulting Business Performance Statistics Showcasing Customer Retention for your upcoming presentation. All the presentation templates are 100 percent editable and you can change the color and personalize the content accordingly. Download now Following slide provides information about company customer retention rate and bounce rate over the years. It includes key components such as annual retention rate, yearly bounce rate, and key insights.
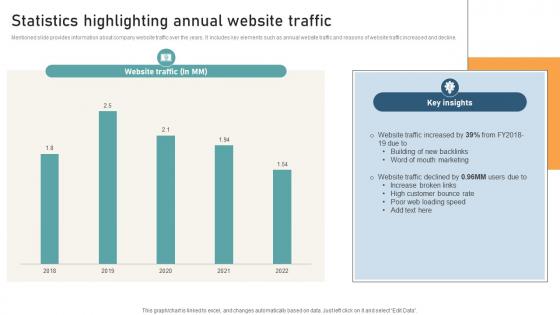
Comprehensive Guide For Website Statistics Highlighting Annual Website Traffic
Mentioned slide provides information about company website traffic over the years. It includes key elements such as annual website traffic and reasons of website traffic increased and decline. Find highly impressive Comprehensive Guide For Website Statistics Highlighting Annual Website Traffic on Slidegeeks to deliver a meaningful presentation. You can save an ample amount of time using these presentation templates. No need to worry to prepare everything from scratch because Slidegeeks experts have already done a huge research and work for you. You need to download Comprehensive Guide For Website Statistics Highlighting Annual Website Traffic for your upcoming presentation. All the presentation templates are 100 percent editable and you can change the color and personalize the content accordingly. Download now Mentioned slide provides information about company website traffic over the years. It includes key elements such as annual website traffic and reasons of website traffic increased and decline.
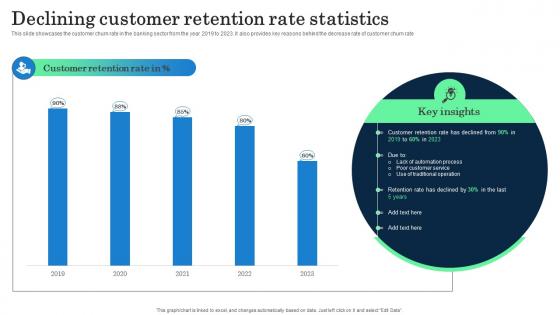
Declining Customer Retention Rate Statistics Incorporating Banking Operational Growth
This slide showcases the customer churn rate in the banking sector from the year 2019 to 2023. it also provides key reasons behind the decrease rate of customer churn rate. Are you in need of a template that can accommodate all of your creative concepts This one is crafted professionally and can be altered to fit any style. Use it with Google Slides or PowerPoint. Include striking photographs, symbols, depictions, and other visuals. Fill, move around, or remove text boxes as desired. Test out color palettes and font mixtures. Edit and save your work, or work with colleagues. Download Declining Customer Retention Rate Statistics Incorporating Banking Operational Growth and observe how to make your presentation outstanding. Give an impeccable presentation to your group and make your presentation unforgettable. This slide showcases the customer churn rate in the banking sector from the year 2019 to 2023. it also provides key reasons behind the decrease rate of customer churn rate
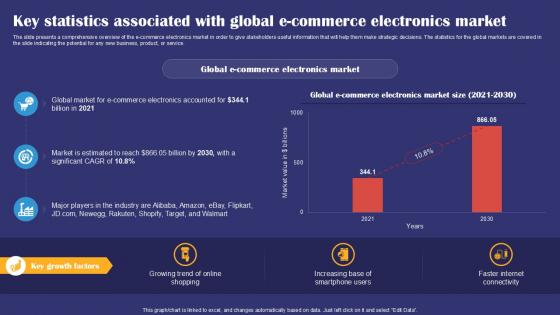
Key Statistics Associated With Global E Commerce Smartphones Industry Report PPT Presentation IR SS V
The slide presents a comprehensive overview of the e commerce electronics market in order to give stakeholders useful information that will help them make strategic decisions. The statistics for the global markets are covered in the slide indicating the potential for any new business, product, or service. If you are looking for a format to display your unique thoughts, then the professionally designed Key Statistics Associated With Global E Commerce Smartphones Industry Report PPT Presentation IR SS V is the one for you. You can use it as a Google Slides template or a PowerPoint template. Incorporate impressive visuals, symbols, images, and other charts. Modify or reorganize the text boxes as you desire. Experiment with shade schemes and font pairings. Alter, share or cooperate with other people on your work. Download Key Statistics Associated With Global E Commerce Smartphones Industry Report PPT Presentation IR SS V and find out how to give a successful presentation. Present a perfect display to your team and make your presentation unforgettable. The slide presents a comprehensive overview of the e commerce electronics market in order to give stakeholders useful information that will help them make strategic decisions. The statistics for the global markets are covered in the slide indicating the potential for any new business, product, or service.
Vape Explosion Statistics In Powerpoint And Google Slides Cpb
Introducing our well designed Vape Explosion Statistics In Powerpoint And Google Slides Cpb This PowerPoint design presents information on topics like Vape Explosion Statistics As it is predesigned it helps boost your confidence level. It also makes you a better presenter because of its high quality content and graphics. This PPT layout can be downloaded and used in different formats like PDF, PNG, and JPG. Not only this, it is available in both Standard Screen and Widescreen aspect ratios for your convenience. Therefore, click on the download button now to persuade and impress your audience. Our Vape Explosion Statistics In Powerpoint And Google Slides Cpb are topically designed to provide an attractive backdrop to any subject. Use them to look like a presentation pro.
Genital Herpes Statistics In Powerpoint And Google Slides Cpb
Introducing our well-designed Genital Herpes Statistics In Powerpoint And Google Slides Cpb. This PowerPoint design presents information on topics like Genital Herpes Statistics. As it is predesigned it helps boost your confidence level. It also makes you a better presenter because of its high-quality content and graphics. This PPT layout can be downloaded and used in different formats like PDF, PNG, and JPG. Not only this, it is available in both Standard Screen and Widescreen aspect ratios for your convenience. Therefore, click on the download button now to persuade and impress your audience. Our Genital Herpes Statistics In Powerpoint And Google Slides Cpb are topically designed to provide an attractive backdrop to any subject. Use them to look like a presentation pro.
Vaccine Success Statistics In Powerpoint And Google Slides Cpb
Introducing our well designed Vaccine Success Statistics In Powerpoint And Google Slides Cpb. This PowerPoint design presents information on topics like Vaccine Success Statistics. As it is predesigned it helps boost your confidence level. It also makes you a better presenter because of its high quality content and graphics. This PPT layout can be downloaded and used in different formats like PDF, PNG, and JPG. Not only this, it is available in both Standard Screen and Widescreen aspect ratios for your convenience. Therefore, click on the download button now to persuade and impress your audience. Our Vaccine Success Statistics In Powerpoint And Google Slides Cpb are topically designed to provide an attractive backdrop to any subject. Use them to look like a presentation pro.
Police Brutality Statistics In Powerpoint And Google Slides Cpb
Introducing our well designed Police Brutality Statistics In Powerpoint And Google Slides Cpb This PowerPoint design presents information on topics like Police Brutality Statistics As it is predesigned it helps boost your confidence level. It also makes you a better presenter because of its high quality content and graphics. This PPT layout can be downloaded and used in different formats like PDF, PNG, and JPG. Not only this, it is available in both Standard Screen and Widescreen aspect ratios for your convenience. Therefore, click on the download button now to persuade and impress your audience. Our Police Brutality Statistics In Powerpoint And Google Slides Cpb are topically designed to provide an attractive backdrop to any subject. Use them to look like a presentation pro.
Spatial Statistics In Powerpoint And Google Slides Cpb
Introducing our well designed Spatial Statistics In Powerpoint And Google Slides Cpb. This PowerPoint design presents information on topics like Spatial Statistics. As it is predesigned it helps boost your confidence level. It also makes you a better presenter because of its high quality content and graphics. This PPT layout can be downloaded and used in different formats like PDF, PNG, and JPG. Not only this, it is available in both Standard Screen and Widescreen aspect ratios for your convenience. Therefore, click on the download button now to persuade and impress your audience. Our Spatial Statistics In Powerpoint And Google Slides Cpb are topically designed to provide an attractive backdrop to any subject. Use them to look like a presentation pro.
Environmental Statistics In Powerpoint And Google Slides Cpb
Introducing our well-designed Environmental Statistics In Powerpoint And Google Slides Cpb. This PowerPoint design presents information on topics like Environmental Statistics. As it is predesigned it helps boost your confidence level. It also makes you a better presenter because of its high-quality content and graphics. This PPT layout can be downloaded and used in different formats like PDF, PNG, and JPG. Not only this, it is available in both Standard Screen and Widescreen aspect ratios for your convenience. Therefore, click on the download button now to persuade and impress your audience. Our Environmental Statistics In Powerpoint And Google Slides Cpb are topically designed to provide an attractive backdrop to any subject. Use them to look like a presentation pro.

Robust Statistics In Powerpoint And Google Slides Cpb
Introducing our well-designed Robust Statistics In Powerpoint And Google Slides Cpb. This PowerPoint design presents information on topics like Robust Statistics. As it is predesigned it helps boost your confidence level. It also makes you a better presenter because of its high-quality content and graphics. This PPT layout can be downloaded and used in different formats like PDF, PNG, and JPG. Not only this, it is available in both Standard Screen and Widescreen aspect ratios for your convenience. Therefore, click on the download button now to persuade and impress your audience. Our Robust Statistics In Powerpoint And Google Slides Cpb are topically designed to provide an attractive backdrop to any subject. Use them to look like a presentation pro.
Statistics Mental Health Stigma In Powerpoint And Google Slides Cpb
Introducing our well-designed Statistics Mental Health Stigma In Powerpoint And Google Slides Cpb. This PowerPoint design presents information on topics like Statistics Mental Health Stigma. As it is predesigned it helps boost your confidence level. It also makes you a better presenter because of its high-quality content and graphics. This PPT layout can be downloaded and used in different formats like PDF, PNG, and JPG. Not only this, it is available in both Standard Screen and Widescreen aspect ratios for your convenience. Therefore, click on the download button now to persuade and impress your audience. Our Statistics Mental Health Stigma In Powerpoint And Google Slides Cpb are topically designed to provide an attractive backdrop to any subject. Use them to look like a presentation pro.


 Continue with Email

 Home
Home


