Engine Oil

3 Vendor Comparison Organization Scorecard Ppt Show Model PDF
The following slide showcases vendor comparison scorecard to determine the suitable supplier for organization procurement needs. The comparison is done on the basis of evaluation categories that are cost, credit rating, on-time delivery and financial stability. Showcasing this set of slides titled 3 Vendor Comparison Organization Scorecard Ppt Show Model PDF. The topics addressed in these templates are Evaluation Category, Supplier, Score. All the content presented in this PPT design is completely editable. Download it and make adjustments in color, background, font etc. as per your unique business setting.
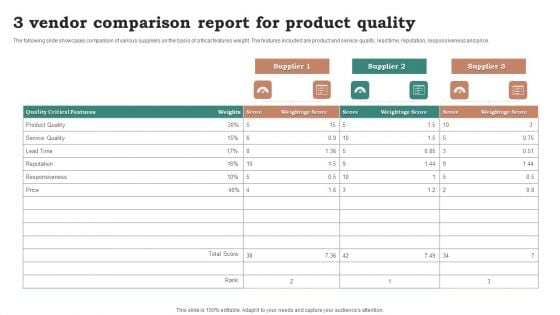
3 Vendor Comparison Report For Product Quality Ppt Styles Show PDF
The following slide showcases comparison of various suppliers on the basis of critical features weight. The features included are product and service quality, lead time, reputation, responsiveness and price. Showcasing this set of slides titled 3 Vendor Comparison Report For Product Quality Ppt Styles Show PDF. The topics addressed in these templates are Quality Critical Features, Product Quality, Service Quality. All the content presented in this PPT design is completely editable. Download it and make adjustments in color, background, font etc. as per your unique business setting.

3 Vendor Price Comparison Sheet Ppt Inspiration Display PDF
The following slide showcases comparison of price between various suppliers to identify the most suitable. The comparison is done on the basis of chair, table, cabinet, desk and cupboard cost. Pitch your topic with ease and precision using this 3 Vendor Price Comparison Sheet Ppt Inspiration Display PDF. This layout presents information on Price Comparison, Supplier, Particulars. It is also available for immediate download and adjustment. So, changes can be made in the color, design, graphics or any other component to create a unique layout.
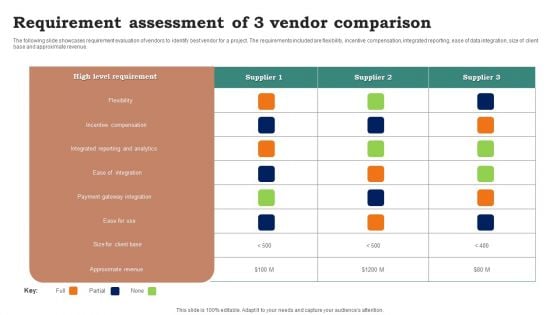
Requirement Assessment Of 3 Vendor Comparison Ppt Infographic Template Layouts PDF
The following slide showcases requirement evaluation of vendors to identify best vendor for a project. The requirements included are flexibility, incentive compensation, integrated reporting, ease of data integration, size of client base and approximate revenue. Showcasing this set of slides titled Requirement Assessment Of 3 Vendor Comparison Ppt Infographic Template Layouts PDF. The topics addressed in these templates are High Level Requirement, Supplier, Flexibility. All the content presented in this PPT design is completely editable. Download it and make adjustments in color, background, font etc. as per your unique business setting.

Building Project Quality Inspection Process Ppt PowerPoint Presentation File Information PDF
This slide showcases steps of quality assurance to improve work processes and efficiency. Steps covered are talk to customers, walk the jobsite, review quality records and reports, reinspect work tasks, talk to field personnel, follow up on previous action plan, record findings and create action plan. Showcasing this set of slides titled Building Project Quality Inspection Process Ppt PowerPoint Presentation File Information PDF. The topics addressed in these templates are Record Findings, Create Action Plan, Reinspect Work Tasks. All the content presented in this PPT design is completely editable. Download it and make adjustments in color, background, font etc. as per your unique business setting.
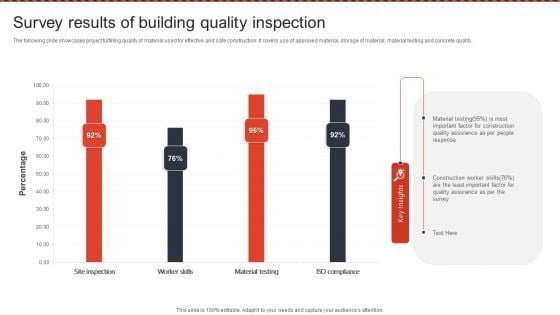
Survey Results Of Building Quality Inspection Ppt PowerPoint Presentation File Show PDF
The following slide showcases project fulfilling quality of material used for effective and safe construction. It covers use of approved material, storage of material, material testing and concrete quality. Pitch your topic with ease and precision using this Survey Results Of Building Quality Inspection Ppt PowerPoint Presentation File Show PDF. This layout presents information on Material Testing, Quality Assurance, Construction Worker Skills. It is also available for immediate download and adjustment. So, changes can be made in the color, design, graphics or any other component to create a unique layout.
Building Quality Inspection Dashboard With Customer Satisfaction Ratio Icons PDF
The following slide showcases dashboard of construction company exhibiting quality KPIs regarding safety, workmanship and customer satisfaction. Key indicators covered are site inspection success level, CSR, defect count, net promoter score, promotors, passives, defectors, total rework cost, safety meetings and average time taken to fix defects. Showcasing this set of slides titled Building Quality Inspection Dashboard With Customer Satisfaction Ratio Icons PDF. The topics addressed in these templates are Construction Project, Customer Satisfaction Ratio, Promoters. All the content presented in this PPT design is completely editable. Download it and make adjustments in color, background, font etc. as per your unique business setting.
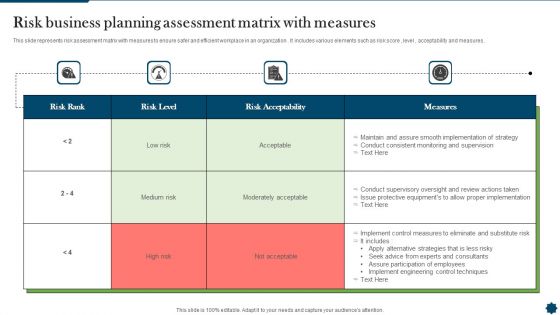
Risk Business Planning Assessment Matrix With Measures Diagrams PDF
This slide represents risk assessment matrix with measures to ensure safer and efficient workplace in an organization . It includes various elements such as risk score , level , acceptability and measures. Showcasing this set of slides titled Risk Business Planning Assessment Matrix With Measures Diagrams PDF. The topics addressed in these templates are Risk Rank, Risk Level, Risk Acceptability. All the content presented in this PPT design is completely editable. Download it and make adjustments in color, background, font etc. as per your unique business setting.
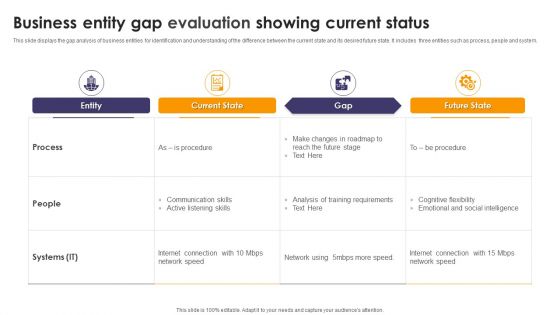
Business Entity Gap Evaluation Showing Current Status Ppt Styles Gallery PDF
This slide displays the gap analysis of business entities for identification and understanding of the difference between the current state and its desired future state. It includes three entities such as process, people and system. Showcasing this set of slides titled Business Entity Gap Evaluation Showing Current Status Ppt Styles Gallery PDF. The topics addressed in these templates are Current State, GAP, Future State, Process. All the content presented in this PPT design is completely editable. Download it and make adjustments in color, background, font etc. as per your unique business setting.
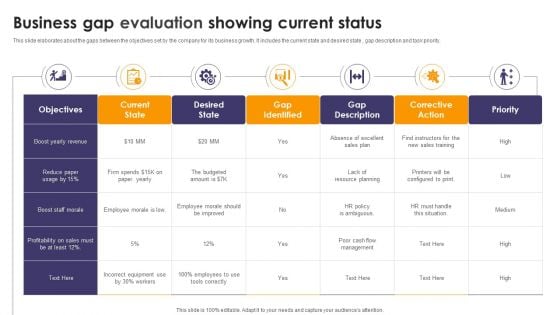
Business Gap Evaluation Showing Current Status Ppt Professional Outfit PDF
This slide elaborates about the gaps between the objectives set by the company for its business growth. It includes the current state and desired state , gap description and task priority. Pitch your topic with ease and precision using this Business Gap Evaluation Showing Current Status Ppt Professional Outfit PDF. This layout presents information on Boost Yearly Revenue, Objectives, Priority. It is also available for immediate download and adjustment. So, changes can be made in the color, design, graphics or any other component to create a unique layout.
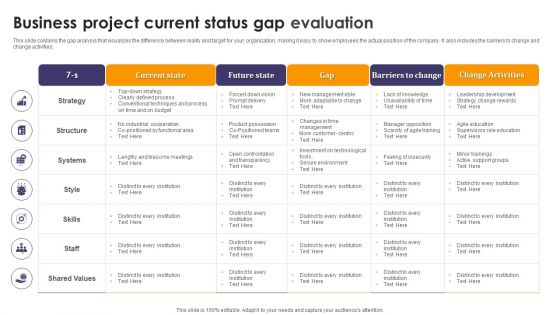
Business Project Current Status Gap Evaluation Ppt Professional Rules PDF
This slide contains the gap analysis that visualizes the difference between reality and target for your organization, making it easy to show employees the actual position of the company. It also includes the barriers to change and change activities. Showcasing this set of slides titled Business Project Current Status Gap Evaluation Ppt Professional Rules PDF. The topics addressed in these templates are Current State, Gap, Change Activities. All the content presented in this PPT design is completely editable. Download it and make adjustments in color, background, font etc. as per your unique business setting.
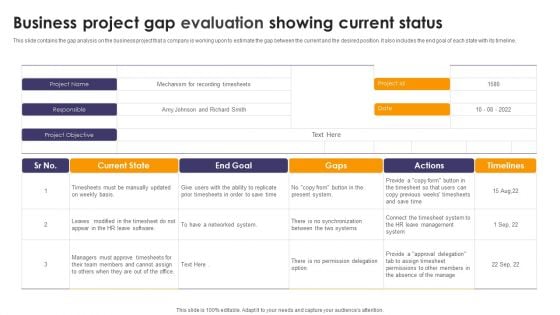
Business Project Gap Evaluation Showing Current Status Ppt Outline Example PDF
This slide contains the gap analysis on the business project that a company is working upon to estimate the gap between the current and the desired position. It also includes the end goal of each state with its timeline. Pitch your topic with ease and precision using this Business Project Gap Evaluation Showing Current Status Ppt Outline Example PDF. This layout presents information on Current State, Gaps, Actions, Timelines. It is also available for immediate download and adjustment. So, changes can be made in the color, design, graphics or any other component to create a unique layout.
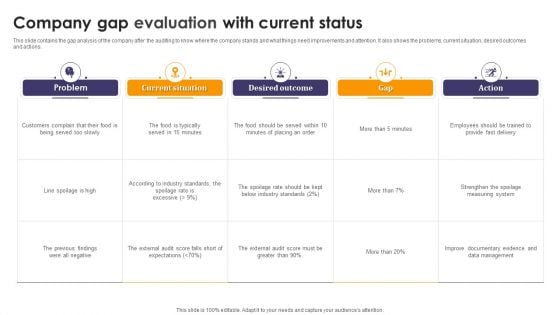
Company Gap Evaluation With Current Status Ppt Ideas Graphics PDF
This slide contains the gap analysis of the company after the auditing to know where the company stands and what things need improvements and attention. It also shows the problems, current situation, desired outcomes and actions. Showcasing this set of slides titled Company Gap Evaluation With Current Status Ppt Ideas Graphics PDF. The topics addressed in these templates are Problem, Current Situation, Desired Outcome. All the content presented in this PPT design is completely editable. Download it and make adjustments in color, background, font etc. as per your unique business setting.
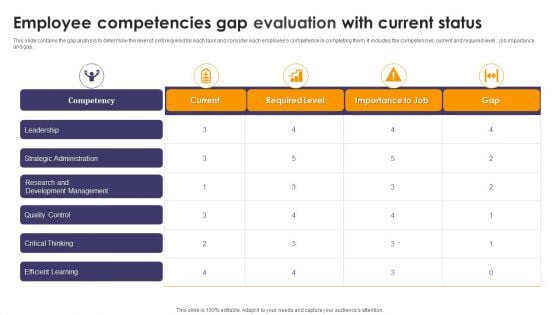
Employee Competencies Gap Evaluation With Current Status Ppt Layouts Summary PDF
This slide contains the gap analysis to determine the level of skill required for each task and consider each employees competence in completing them. It includes the competencies, current and required level , job importance and gap. Showcasing this set of slides titled Employee Competencies Gap Evaluation With Current Status Ppt Layouts Summary PDF. The topics addressed in these templates are Competency, Required Level, Gap. All the content presented in this PPT design is completely editable. Download it and make adjustments in color, background, font etc. as per your unique business setting.
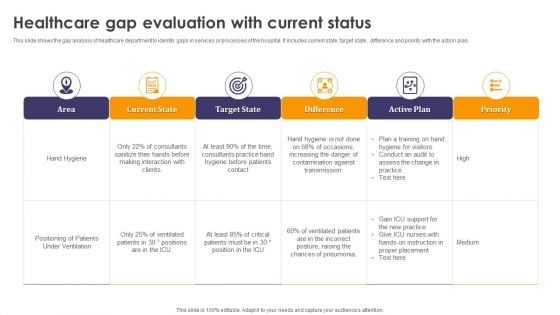
Healthcare Gap Evaluation With Current Status Ppt Gallery Infographic Template PDF
This slide shows the gap analysis of healthcare department to identify gaps in services or processes of the hospital. It includes current state, target state , difference and priority with the action plan. Showcasing this set of slides titled Healthcare Gap Evaluation With Current Status Ppt Gallery Infographic Template PDF. The topics addressed in these templates are Current State, Difference, Priority, Active Plan. All the content presented in this PPT design is completely editable. Download it and make adjustments in color, background, font etc. as per your unique business setting.
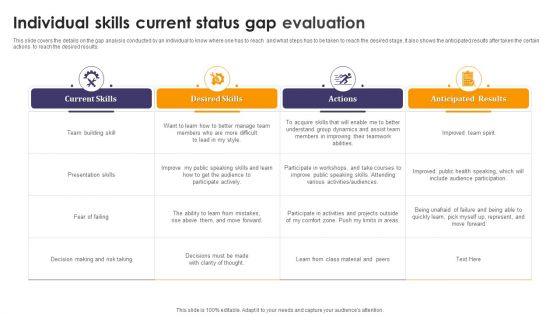
Individual Skills Current Status Gap Evaluation Ppt Infographic Template Diagrams PDF
This slide covers the details on the gap analysis conducted by an individual to know where one has to reach and what steps has to be taken to reach the desired stage. It also shows the anticipated results after taken the certain actions to reach the desired results. Pitch your topic with ease and precision using this Individual Skills Current Status Gap Evaluation Ppt Infographic Template Diagrams PDF. This layout presents information on Current Skills, Desired Skills, Actions, Anticipated Results. It is also available for immediate download and adjustment. So, changes can be made in the color, design, graphics or any other component to create a unique layout.

Manufacturing Action Plan Current Status Gap Evaluation Ppt Pictures Graphics Tutorials PDF
This slide contains the gap analysis and risk occurrence in the manufacturing and assembly process of transmitters. It also contains the action plan to get the desired results with the target dates. Showcasing this set of slides titled Manufacturing Action Plan Current Status Gap Evaluation Ppt Pictures Graphics Tutorials PDF. The topics addressed in these templates are Process, Current Results, Desired Results, Action. All the content presented in this PPT design is completely editable. Download it and make adjustments in color, background, font etc. as per your unique business setting.
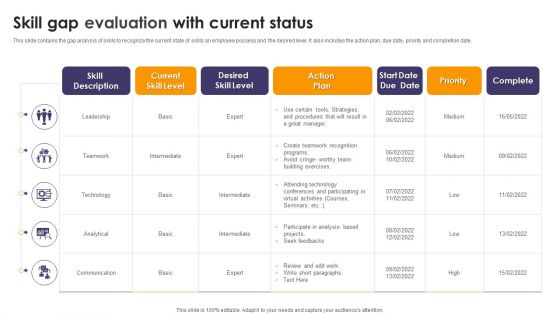
Skill Gap Evaluation With Current Status Ppt PowerPoint Presentation File Gallery PDF
This slide contains the gap analysis of skills to recognize the current state of skills an employee possess and the desired level. It also includes the action plan, due date, priority and completion date. Showcasing this set of slides titled Skill Gap Evaluation With Current Status Ppt PowerPoint Presentation File Gallery PDF. The topics addressed in these templates are Skill Description, Current Skill Level, Desired Skill Level. All the content presented in this PPT design is completely editable. Download it and make adjustments in color, background, font etc. as per your unique business setting.
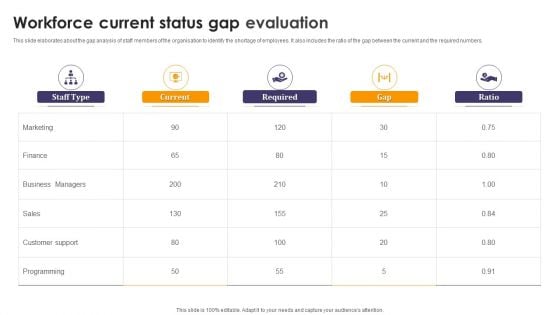
Workforce Current Status Gap Evaluation Ppt PowerPoint Presentation File Visuals PDF
This slide elaborates about the gap analysis of staff members of the organisation to identify the shortage of employees. It also includes the ratio of the gap between the current and the required numbers. Pitch your topic with ease and precision using this Workforce Current Status Gap Evaluation Ppt PowerPoint Presentation File Visuals PDF. This layout presents information on Staff Type, Current Required, Gap, Ratio. It is also available for immediate download and adjustment. So, changes can be made in the color, design, graphics or any other component to create a unique layout.
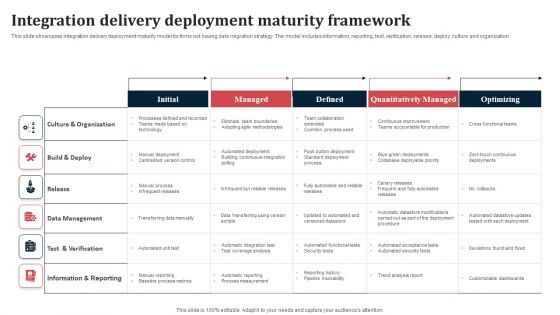
Integration Delivery Deployment Maturity Framework Ppt Professional Clipart Images PDF
This slide showcases integration delivery deployment maturity model for firms not having data migration strategy. The model includes information, reporting, test, verification, release, deploy, culture and organization. Pitch your topic with ease and precision using this Integration Delivery Deployment Maturity Framework Ppt Professional Clipart Images PDF. This layout presents information on Culture And Organization, Build And Deploy, Release. It is also available for immediate download and adjustment. So, changes can be made in the color, design, graphics or any other component to create a unique layout.
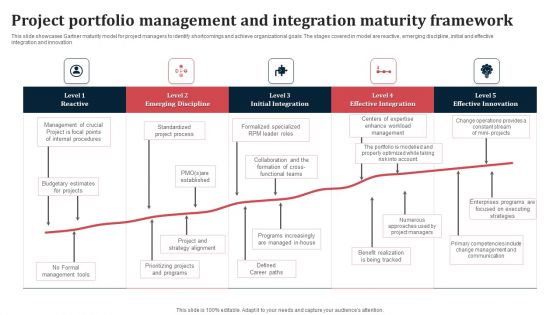
Project Portfolio Management And Integration Maturity Framework Ppt Gallery Visual Aids PDF
This slide showcases Gartner maturity model for project managers to identify shortcomings and achieve organizational goals. The stages covered in model are reactive, emerging discipline, initial and effective integration and innovation. Pitch your topic with ease and precision using this Project Portfolio Management And Integration Maturity Framework Ppt Gallery Visual Aids PDF. This layout presents information on Initial Integration, Emerging Discipline, Effective Integration. It is also available for immediate download and adjustment. So, changes can be made in the color, design, graphics or any other component to create a unique layout.

Medical Equipment Development And Manufacturers Challenges Ppt Infographics Example PDF
The following slide exhibits the most significant obstacles that medical device firms will face in the future years to develop medical devices. Common challenges covered are product quality, supply chain and regulatory compliance. Showcasing this set of slides titled Medical Equipment Development And Manufacturers Challenges Ppt Infographics Example PDF. The topics addressed in these templates are Product Quality, Regulatory Compliance, Supply Chain. All the content presented in this PPT design is completely editable. Download it and make adjustments in color, background, font etc. as per your unique business setting.
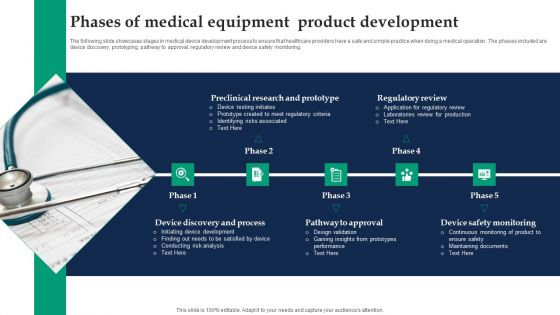
Phases Of Medical Equipment Product Development Ppt Inspiration Slide PDF
The following slide showcases stages in medical device development process to ensure that healthcare providers have a safe and simple practice when doing a medical operation. The phases included are device discovery, prototyping, pathway to approval, regulatory review and device safety monitoring. Pitch your topic with ease and precision using this Phases Of Medical Equipment Product Development Ppt Inspiration Slide PDF. This layout presents information on Pathway To Approval, Device Safety Monitoring, Regulatory Review. It is also available for immediate download and adjustment. So, changes can be made in the color, design, graphics or any other component to create a unique layout.
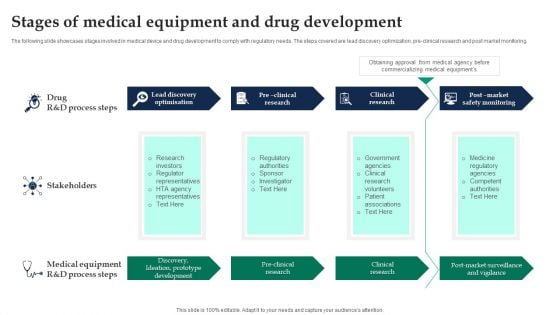
Stages Of Medical Equipment And Drug Development Ppt Gallery Slide Download PDF
The following slide showcases stages involved in medical device and drug development to comply with regulatory needs. The steps covered are lead discovery optimization, pre-clinical research and post market monitoring. Showcasing this set of slides titled Stages Of Medical Equipment And Drug Development Ppt Gallery Slide Download PDF. The topics addressed in these templates are Stakeholders, Pre Clinical Research, Clinical Research. All the content presented in this PPT design is completely editable. Download it and make adjustments in color, background, font etc. as per your unique business setting.
Business Program Success Kpis With Priority Ppt Infographic Template Icon PDF
The following slide highlights the business program success metrics with priority illustrating key headings which includes business objective, metric tool, target group, measurement description and priority. Pitch your topic with ease and precision using this Business Program Success Kpis With Priority Ppt Infographic Template Icon PDF. This layout presents information on Business Objective, Metric Tool, Target Group. It is also available for immediate download and adjustment. So, changes can be made in the color, design, graphics or any other component to create a unique layout.
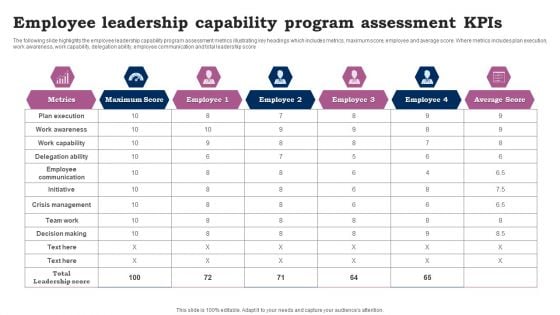
Employee Leadership Capability Program Assessment Kpis Ppt Infographic Template Topics PDF
The following slide highlights the employee leadership capability program assessment metrics illustrating key headings which includes metrics, maximum score, employee and average score. Where metrics includes plan execution, work awareness, work capability, delegation ability, employee communication and total leadership score. Pitch your topic with ease and precision using this Employee Leadership Capability Program Assessment Kpis Ppt Infographic Template Topics PDF. This layout presents information on Metrics, Plan Execution, Work Awareness. It is also available for immediate download and adjustment. So, changes can be made in the color, design, graphics or any other component to create a unique layout.
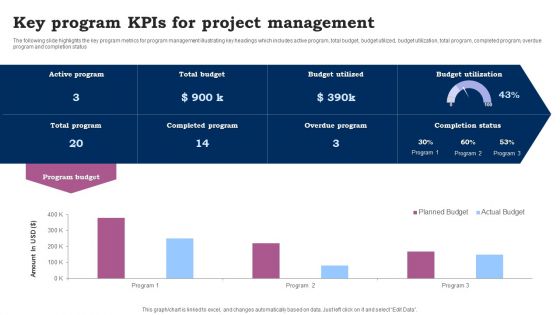
Key Program Kpis For Project Management Ppt Slides Graphic Images PDF
The following slide highlights the key program metrics for program management illustrating key headings which includes active program, total budget, budget utilized, budget utilization, total program, completed program, overdue program and completion status. Pitch your topic with ease and precision using this Key Program Kpis For Project Management Ppt Slides Graphic Images PDF. This layout presents information on Program Budget, Active Program, Total Budget. It is also available for immediate download and adjustment. So, changes can be made in the color, design, graphics or any other component to create a unique layout.
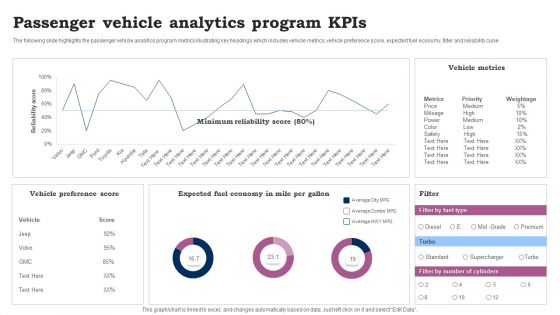
Passenger Vehicle Analytics Program Kpis Ppt Pictures Demonstration PDF
The following slide highlights the passenger vehicle analytics program metrics illustrating key headings which includes vehicle metrics, vehicle preference score, expected fuel economy, filter and reliability curve. Showcasing this set of slides titled Passenger Vehicle Analytics Program Kpis Ppt Pictures Demonstration PDF. The topics addressed in these templates are Vehicle Preference Score, Vehicle Metrics, Expected Fuel Economy. All the content presented in this PPT design is completely editable. Download it and make adjustments in color, background, font etc. as per your unique business setting.
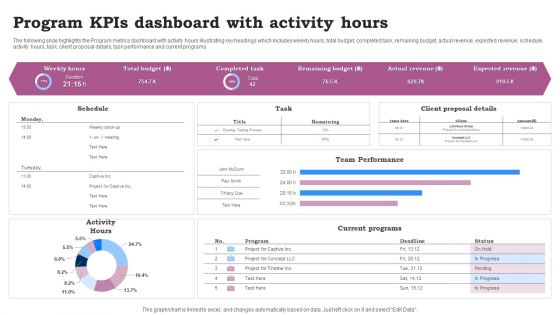
Program Kpis Dashboard With Activity Hours Ppt Infographics Clipart Images PDF
The following slide highlights the Program metrics dashboard with activity hours illustrating key headings which includes weekly hours, total budget, completed task, remaining budget, actual revenue, expected revenue, schedule, activity hours, task, client proposal details, task performance and current programs. Pitch your topic with ease and precision using this Program Kpis Dashboard With Activity Hours Ppt Infographics Clipart Images PDF. This layout presents information on Team Performance, Current Programs, Activity Hours. It is also available for immediate download and adjustment. So, changes can be made in the color, design, graphics or any other component to create a unique layout.
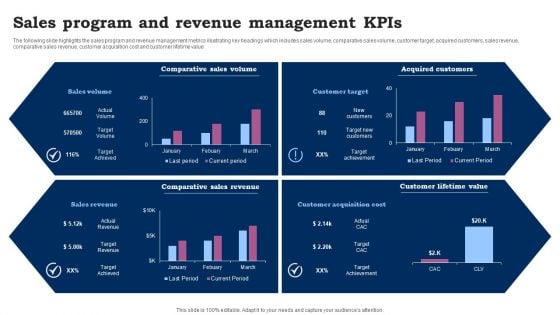
Sales Program And Revenue Management Kpis Ppt Outline Slide Download PDF
The following slide highlights the sales program and revenue management metrics illustrating key headings which includes sales volume, comparative sales volume, customer target, acquired customers, sales revenue, comparative sales revenue, customer acquisition cost and customer lifetime value. Showcasing this set of slides titled Sales Program And Revenue Management Kpis Ppt Outline Slide Download PDF. The topics addressed in these templates are Comparative Sales Volume, Acquired Customers, Comparative Sales Revenue. All the content presented in this PPT design is completely editable. Download it and make adjustments in color, background, font etc. as per your unique business setting.
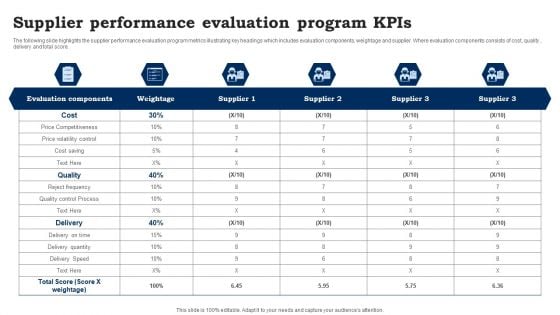
Supplier Performance Evaluation Program Kpis Ppt Infographics Slide PDF
The following slide highlights the supplier performance evaluation program metrics illustrating key headings which includes evaluation components, weightage and supplier. Where evaluation components consists of cost, quality , delivery and total score. Showcasing this set of slides titled Supplier Performance Evaluation Program Kpis Ppt Infographics Slide PDF. The topics addressed in these templates are Evaluation Components, Cost, Price Competitiveness. All the content presented in this PPT design is completely editable. Download it and make adjustments in color, background, font etc. as per your unique business setting.
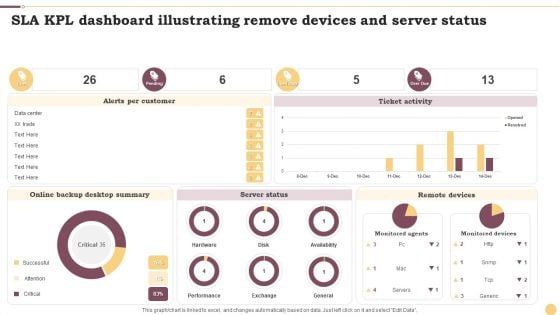
SLA KPL Dashboard Illustrating Remove Devices And Server Status Ppt Inspiration Layout Ideas PDF
This graph or chart is linked to excel, and changes automatically based on data. Just left click on it and select Edit Data. Showcasing this set of slides titled SLA KPL Dashboard Illustrating Remove Devices And Server Status Ppt Inspiration Layout Ideas PDF. The topics addressed in these templates are Alerts Per Customer, Ticket Activity, Server Status. All the content presented in this PPT design is completely editable. Download it and make adjustments in color, background, font etc. as per your unique business setting.
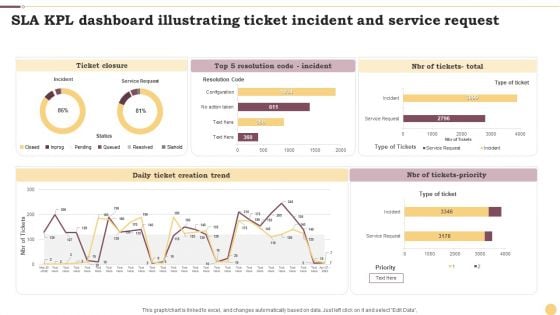
SLA KPL Dashboard Illustrating Ticket Incident And Service Request Ppt File Portrait PDF
This graph or chart is linked to excel, and changes automatically based on data. Just left click on it and select Edit Data. Showcasing this set of slides titled SLA KPL Dashboard Illustrating Ticket Incident And Service Request Ppt File Portrait PDF. The topics addressed in these templates are Ticket Closure, Daily Ticket, Creation Trend, NBR Tickets Priority. All the content presented in this PPT design is completely editable. Download it and make adjustments in color, background, font etc. as per your unique business setting.
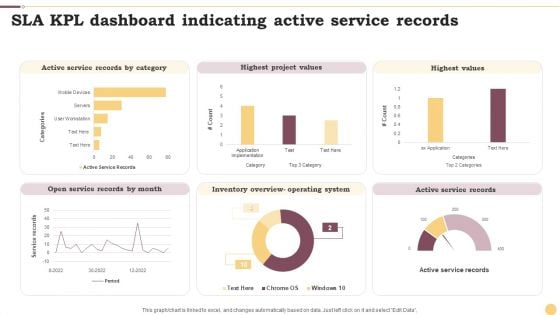
SLA KPL Dashboard Indicating Active Service Records Ppt Professional Graphics Example PDF
This graph or chart is linked to excel, and changes automatically based on data. Just left click on it and select Edit Data. Pitch your topic with ease and precision using this SLA KPL Dashboard Indicating Active Service Records Ppt Professional Graphics Example PDF. This layout presents information on Active Service Records, Highest Project Values, Highest Values. It is also available for immediate download and adjustment. So, changes can be made in the color, design, graphics or any other component to create a unique layout.
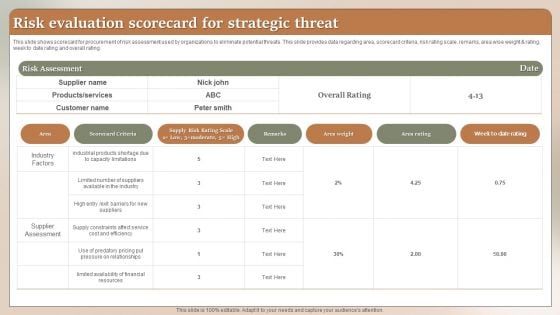
Risk Evaluation Scorecard For Strategic Threat Ppt Summary Gridlines PDF
This slide shows scorecard for procurement of risk assessment used by organizations to eliminate potential threats. This slide provides data regarding area, scorecard criteria, risk rating scale, remarks, area wise weight and rating, week to date rating and overall rating. Showcasing this set of slides titled Risk Evaluation Scorecard For Strategic Threat Ppt Summary Gridlines PDF. The topics addressed in these templates are Risk Assessment, Scorecard Criteria, Area weight. All the content presented in this PPT design is completely editable. Download it and make adjustments in color, background, font etc. as per your unique business setting.
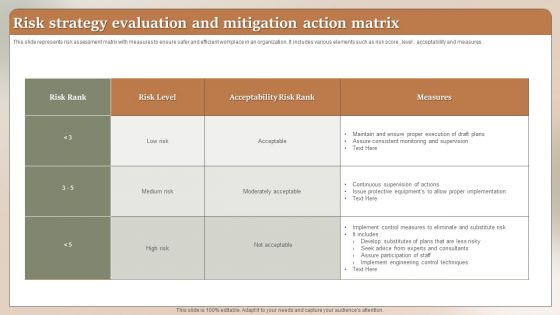
Risk Strategy Evaluation And Mitigation Action Matrix Ppt Styles Demonstration PDF
This slide represents risk assessment matrix with measures to ensure safer and efficient workplace in an organization. It includes various elements such as risk score , level , acceptability and measures. Pitch your topic with ease and precision using this Risk Strategy Evaluation And Mitigation Action Matrix Ppt Styles Demonstration PDF. This layout presents information on Risk Rank, Risk Level, Acceptability Risk Rank. It is also available for immediate download and adjustment. So, changes can be made in the color, design, graphics or any other component to create a unique layout.
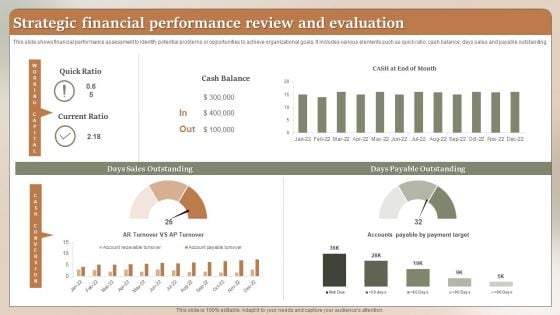
Strategic Financial Performance Review And Evaluation Ppt Layouts Styles PDF
This slide shows financial performance assessment to identify potential problems or opportunities to achieve organizational goals. It includes various elements such as quick ratio, cash balance, days sales and payable outstanding. Showcasing this set of slides titled Strategic Financial Performance Review And Evaluation Ppt Layouts Styles PDF. The topics addressed in these templates are Cash Balance, Quick Ratio, Current Ratio. All the content presented in this PPT design is completely editable. Download it and make adjustments in color, background, font etc. as per your unique business setting.
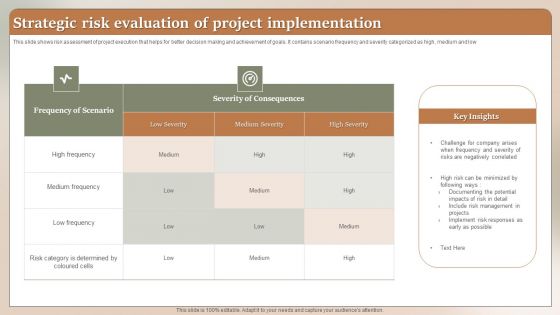
Strategic Risk Evaluation Of Project Implementation Ppt Outline Backgrounds PDF
This slide shows risk assessment of project execution that helps for better decision making and achievement of goals. It contains scenario frequency and severity categorized as high, medium and low. Showcasing this set of slides titled Strategic Risk Evaluation Of Project Implementation Ppt Outline Backgrounds PDF. The topics addressed in these templates are Frequency Scenario, Severity Consequences, Medium Frequency. All the content presented in this PPT design is completely editable. Download it and make adjustments in color, background, font etc. as per your unique business setting.
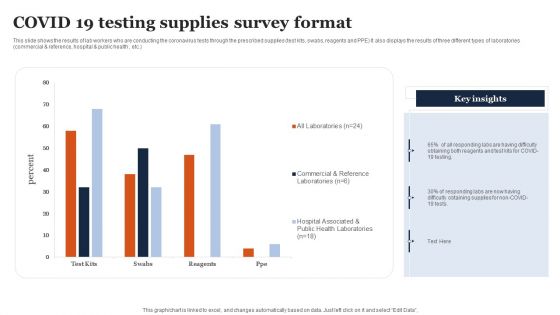
COVID 19 Testing Supplies Survey Format Ppt Infographic Template Slide PDF
This slide shows the results of lab workers who are conducting the coronavirus tests through the prescribed supplies test kits, swabs, reagents and PPE It also displays the results of three different types of laboratories commercial and reference, hospital and public health , etc. Showcasing this set of slides titled COVID 19 Testing Supplies Survey Format Ppt Infographic Template Slide PDF. The topics addressed in these templates are All Laboratories, Commercial And Reference, Hospital Associated. All the content presented in this PPT design is completely editable. Download it and make adjustments in color, background, font etc. as per your unique business setting.
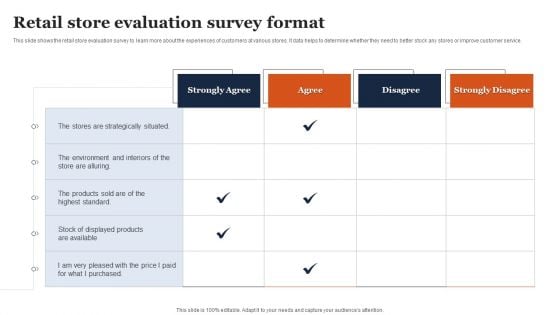
Retail Store Evaluation Survey Format Ppt Outline Slideshow PDF
This slide shows the retail store evaluation survey to learn more about the experiences of customers at various stores. It data helps to determine whether they need to better stock any stores or improve customer service. Showcasing this set of slides titled Retail Store Evaluation Survey Format Ppt Outline Slideshow PDF. The topics addressed in these templates are Strongly Agree, Agree, Strongly Disagree. All the content presented in this PPT design is completely editable. Download it and make adjustments in color, background, font etc. as per your unique business setting.
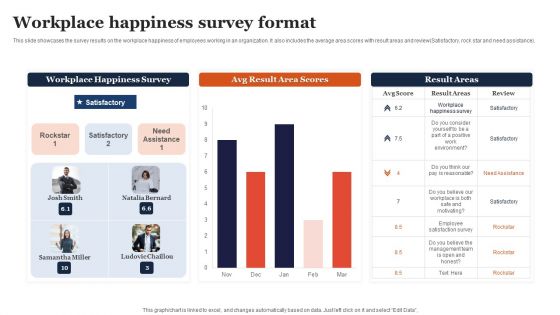
Workplace Happiness Survey Format Ppt Model Brochure PDF
This slide showcases the survey results on the workplace happiness of employees working in an organization. It also includes the average area scores with result areas and review Satisfactory, rock star and need. Pitch your topic with ease and precision using this Workplace Happiness Survey Format Ppt Model Brochure PDF. This layout presents information on Workplace Happiness Survey, Avg Result, Area Scores. It is also available for immediate download and adjustment. So, changes can be made in the color, design, graphics or any other component to create a unique layout.
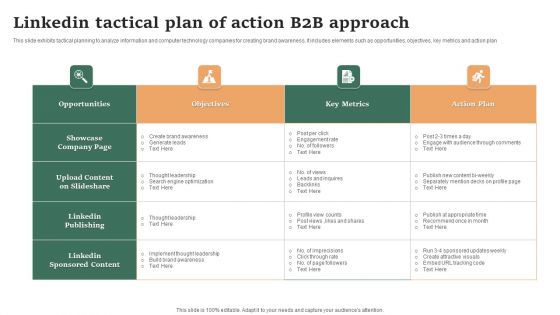
Linkedin Tactical Plan Of Action B2B Approach Ppt Infographic Template Example Introduction PDF
This slide exhibits tactical planning to analyze information and computer technology companies for creating brand awareness. It includes elements such as opportunities, objectives, key metrics and action plan. Showcasing this set of slides titled Linkedin Tactical Plan Of Action B2B Approach Ppt Infographic Template Example Introduction PDF. The topics addressed in these templates are Opportunities, Objectives, Key Metrics. All the content presented in this PPT design is completely editable. Download it and make adjustments in color, background, font etc. as per your unique business setting.
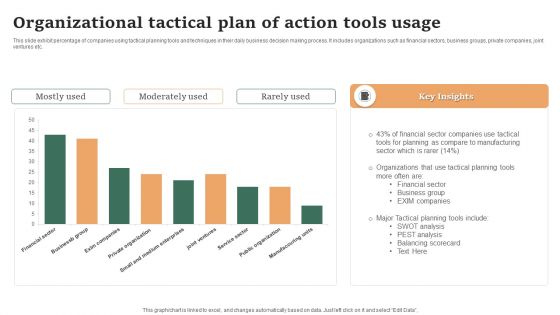
Organizational Tactical Plan Of Action Tools Usage Ppt Show Ideas PDF
This slide exhibit percentage of companies using tactical planning tools and techniques in their daily business decision making process. It includes organizations such as financial sectors, business groups, private companies, joint ventures etc. Showcasing this set of slides titled Organizational Tactical Plan Of Action Tools Usage Ppt Show Ideas PDF. The topics addressed in these templates are Mostly Used, Moderately Used, Rarely Used. All the content presented in this PPT design is completely editable. Download it and make adjustments in color, background, font etc. as per your unique business setting.
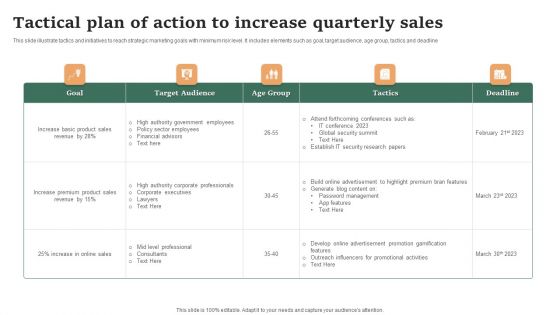
Tactical Plan Of Action To Increase Quarterly Sales Ppt Show Sample PDF
This slide illustrate tactics and initiatives to reach strategic marketing goals with minimum risk level. It includes elements such as goal, target audience, age group, tactics and deadline. Pitch your topic with ease and precision using this Tactical Plan Of Action To Increase Quarterly Sales Ppt Show Sample PDF. This layout presents information on Target Audience, Goal, Age Group. It is also available for immediate download and adjustment. So, changes can be made in the color, design, graphics or any other component to create a unique layout.
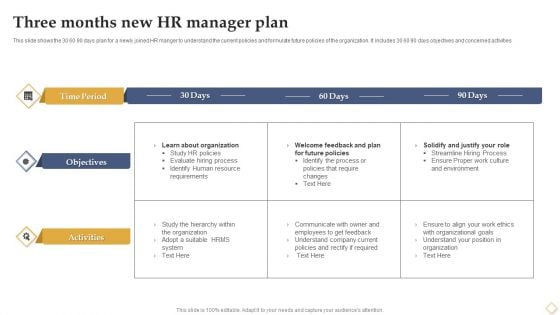
Three Months New HR Manager Plan Ppt Pictures Deck PDF
This slide shows the 30 60 90 days plan for a newly joined HR manger to understand the current policies and formulate future policies of the organization. It includes 30 60 90 days objectives and concerned activities. Showcasing this set of slides titled Three Months New HR Manager Plan Ppt Pictures Deck PDF. The topics addressed in these templates are Time Period, Objectives, Activities. All the content presented in this PPT design is completely editable. Download it and make adjustments in color, background, font etc. as per your unique business setting.
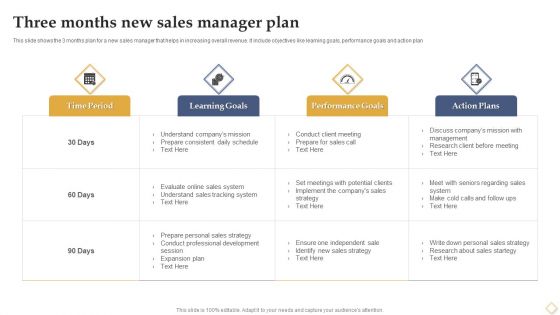
Three Months New Sales Manager Plan Ppt Portfolio Layout PDF
This slide shows the 3 months plan for a new sales manager that helps in increasing overall revenue. It include objectives like learning goals, performance goals and action plan. Showcasing this set of slides titled Three Months New Sales Manager Plan Ppt Portfolio Layout PDF. The topics addressed in these templates are Time Period, Learning Goals, Performance Goals, Action Plans. All the content presented in this PPT design is completely editable. Download it and make adjustments in color, background, font etc. as per your unique business setting.
Three Months New Technical Officer Manager Plan Ppt Icon Infographics PDF
This slide shows 3 months plan for new chief technical officer to make improvements in technical side. It includes 30 60 90 days activities like getting familiar to employees, monitoring progress and making reports. Pitch your topic with ease and precision using this Three Months New Technical Officer Manager Plan Ppt Icon Infographics PDF. This layout presents information on First 30 Days, 30 60 Days,60 90 Days. It is also available for immediate download and adjustment. So, changes can be made in the color, design, graphics or any other component to create a unique layout.
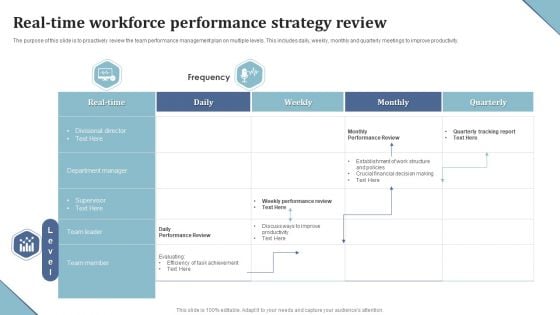
Real Time Workforce Performance Strategy Review Ppt File Sample PDF
The purpose of this slide is to proactively review the team performance management plan on multiple levels. This includes daily, weekly, monthly and quarterly meetings to improve productivity. Showcasing this set of slides titled Real Time Workforce Performance Strategy Review Ppt File Sample PDF. The topics addressed in these templates are Real Time, Frequency, Daily Performance Review. All the content presented in this PPT design is completely editable. Download it and make adjustments in color, background, font etc. as per your unique business setting.
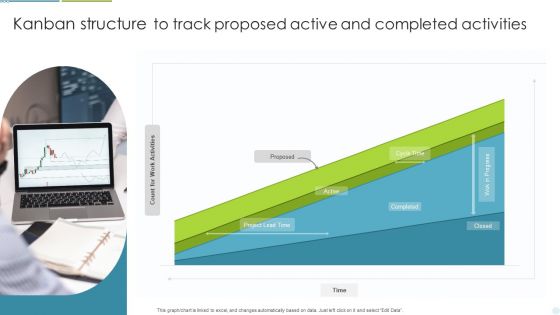
Kanban Structure To Track Proposed Active And Completed Activities Ppt Outline Slide Portrait PDF
This graph or chart is linked to excel, and changes automatically based on data. Just left click on it and select Edit Data. Pitch your topic with ease and precision using this Kanban Structure To Track Proposed Active And Completed Activities Ppt Outline Slide Portrait PDF. This layout presents information on Project Lead Time, Cycle Time, Completed. It is also available for immediate download and adjustment. So, changes can be made in the color, design, graphics or any other component to create a unique layout.
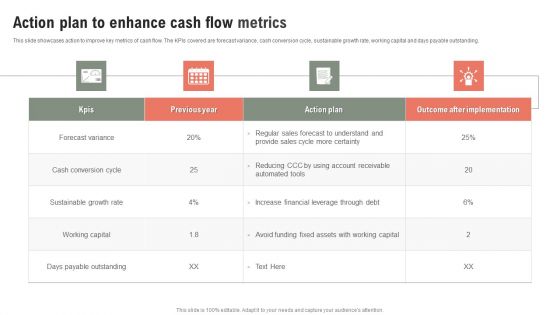
Action Plan To Enhance Cash Flow Metrics Ppt Show Maker PDF
This slide showcases action to improve key metrics of cash flow. The KPIs covered are forecast variance, cash conversion cycle, sustainable growth rate, working capital and days payable outstanding. Showcasing this set of slides titled Action Plan To Enhance Cash Flow Metrics Ppt Show Maker PDF. The topics addressed in these templates are Forecast Variance, Cash Conversion Cycle, Sustainable Growth Rate. All the content presented in this PPT design is completely editable. Download it and make adjustments in color, background, font etc. as per your unique business setting.
Cash Flow Metrics To Determine Firm Financial Health Ppt Icon PDF
This slide showcases KPIs that provides information on the potential and financial health of company. The KPIs covered are working capital, liquidity ratio, operating cashflow, days payable outstanding and account receivable turnover. Showcasing this set of slides titled Cash Flow Metrics To Determine Firm Financial Health Ppt Icon PDF. The topics addressed in these templates are Working Capital, Liquidity Ratio, Operating Cashflow. All the content presented in this PPT design is completely editable. Download it and make adjustments in color, background, font etc. as per your unique business setting.
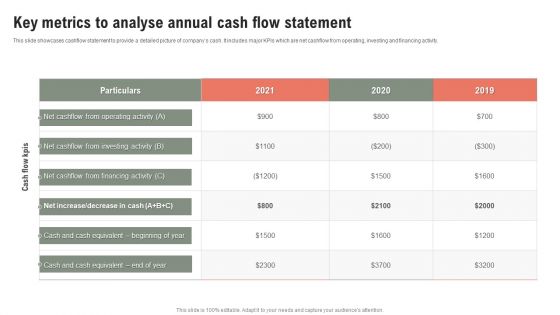
Key Metrics To Analyse Annual Cash Flow Statement Ppt Gallery Microsoft PDF
This slide showcases cashflow statement to provide a detailed picture of companys cash. It includes major KPIs which are net cashflow from operating, investing and financing activity. Pitch your topic with ease and precision using this Key Metrics To Analyse Annual Cash Flow Statement Ppt Gallery Microsoft PDF. This layout presents information on Net Cashflow, 2019 To 2021, Investing Activity. It is also available for immediate download and adjustment. So, changes can be made in the color, design, graphics or any other component to create a unique layout.
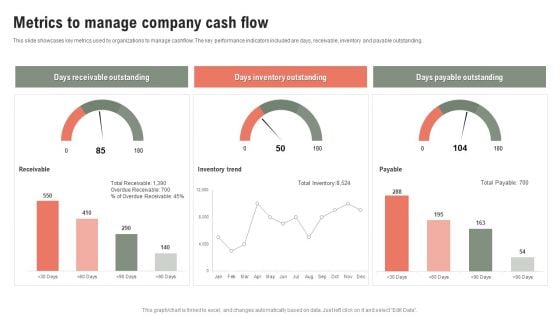
Metrics To Manage Company Cash Flow Ppt Model Gridlines PDF
This slide showcases key metrics used by organizations to manage cashflow. The key performance indicators included are days, receivable, inventory and payable outstanding. Pitch your topic with ease and precision using this Metrics To Manage Company Cash Flow Ppt Model Gridlines PDF. This layout presents information on Days Receivable Outstanding, Days Inventory Outstanding, Days Payable Outstanding. It is also available for immediate download and adjustment. So, changes can be made in the color, design, graphics or any other component to create a unique layout.
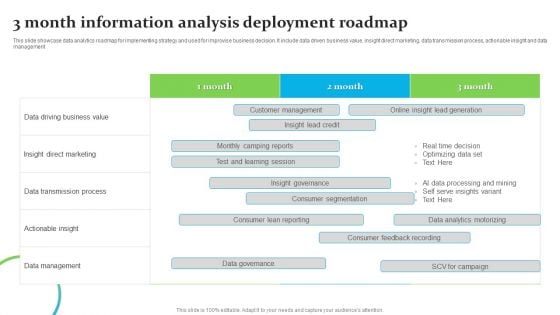
3 Month Information Analysis Deployment Roadmap Ppt Infographics Picture PDF
This slide showcase data analytics roadmap for implementing strategy and used for improvise business decision. It include data driven business value, insight direct marketing, data transmission process, actionable insight and data management. Showcasing this set of slides titled 3 Month Information Analysis Deployment Roadmap Ppt Infographics Picture PDF. The topics addressed in these templates are Insight Direct Marketing, Data Transmission Process, Actionable Insight. All the content presented in this PPT design is completely editable. Download it and make adjustments in color, background, font etc. as per your unique business setting.
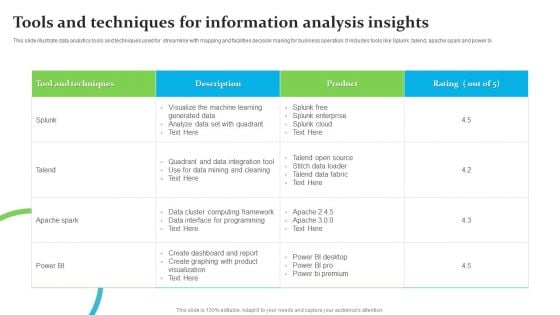
Tools And Techniques For Information Analysis Insights Ppt Outline Ideas PDF
This slide illustrate data analytics tools and techniques used for streamline with mapping and facilities decision making for business operation. It includes tools like Splunk, talend, apache spark and power bi. Pitch your topic with ease and precision using this Tools And Techniques For Information Analysis Insights Ppt Outline Ideas PDF. This layout presents information on Tool And Techniques, Product, Apache Spark. It is also available for immediate download and adjustment. So, changes can be made in the color, design, graphics or any other component to create a unique layout.
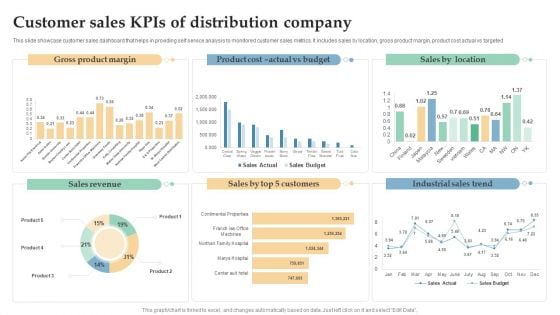
Customer Sales Kpis Of Distribution Company Ppt Infographic Template Templates PDF
This slide showcase customer sales dashboard that helps in providing self service analysis to monitored customer sales metrics. It includes sales by location, gross product margin, product cost actual vs targeted. Showcasing this set of slides titled Customer Sales Kpis Of Distribution Company Ppt Infographic Template Templates PDF. The topics addressed in these templates are Gross Product Margin, Sales Revenue, Industrial Sales Trend. All the content presented in this PPT design is completely editable. Download it and make adjustments in color, background, font etc. as per your unique business setting.
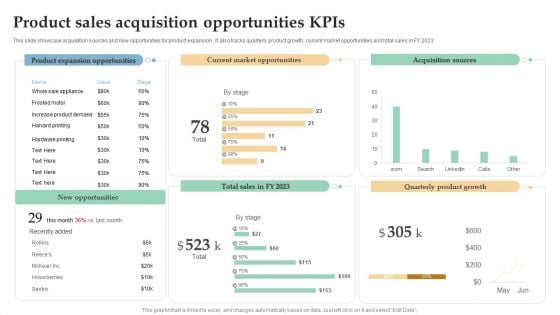
Product Sales Acquisition Opportunities Kpis Ppt Pictures Slide PDF
This slide showcase acquisition sources and new opportunities for product expansion . It also tracks quarterly product growth, current market opportunities and total sales in FY 2023. Pitch your topic with ease and precision using this Product Sales Acquisition Opportunities Kpis Ppt Pictures Slide PDF. This layout presents information on Product Expansion Opportunities, Current Market Opportunities, Acquisition Sources. It is also available for immediate download and adjustment. So, changes can be made in the color, design, graphics or any other component to create a unique layout.
Product Sales Kpis With Website Traffic Ppt Icon Smartart
This slide showcase different strategies through which product is marketize to increase the product reach to the consumer and increase the market share. It includes total product revenue, sales comparison of online and in store sales, marketing campaigning and website traffic. Showcasing this set of slides titled Product Sales Kpis With Website Traffic Ppt Icon Smartart. The topics addressed in these templates are Website Traffic, Product Sales Increment, Total Product Revenue. All the content presented in this PPT design is completely editable. Download it and make adjustments in color, background, font etc. as per your unique business setting.
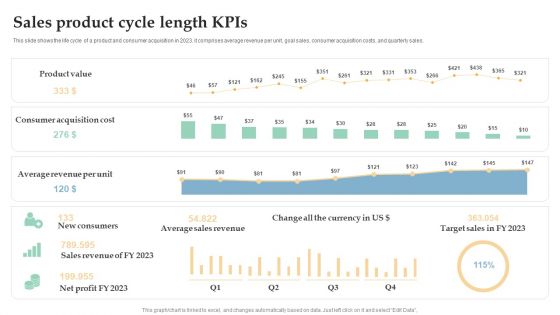
Sales Product Cycle Length Kpis Ppt Pictures Aids PDF
This slide shows the life cycle of a product and consumer acquisition in 2023. it comprises average revenue per unit, goal sales, consumer acquisition costs, and quarterly sales. Showcasing this set of slides titled Sales Product Cycle Length Kpis Ppt Pictures Aids PDF. The topics addressed in these templates are Product Value, Consumer Acquisition Cost, Average Revenue, Per Unit. All the content presented in this PPT design is completely editable. Download it and make adjustments in color, background, font etc. as per your unique business setting.
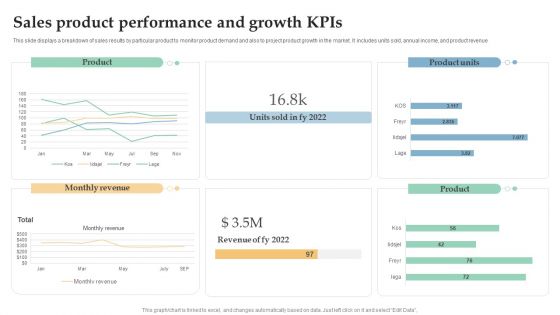
Sales Product Performance And Growth Kpis Ppt Layouts Mockup PDF
This slide displays a breakdown of sales results by particular product to monitor product demand and also to project product growth in the market. It includes units sold, annual income, and product revenue. Pitch your topic with ease and precision using this Sales Product Performance And Growth Kpis Ppt Layouts Mockup PDF. This layout presents information on Monthly Revenue, Product, Product Units. It is also available for immediate download and adjustment. So, changes can be made in the color, design, graphics or any other component to create a unique layout.


 Continue with Email

 Home
Home


