Engineer Icon

Performance Analysis Using Operating Revenue Business Operational Expenditure And Income Metrics Diagrams PDF
This slide illustrates performance analysis using operating revenue, operating expenditure opex and income metrics which can be referred by organizations to evaluate their inflows and outflows to make relevant decisions for increasing profitability. It includes information about operating revenue, operating expense and income before taxes. Pitch your topic with ease and precision using this Performance Analysis Using Operating Revenue Business Operational Expenditure And Income Metrics Diagrams PDF. This layout presents information on Taxes, Highest Operating, Recorded. It is also available for immediate download and adjustment. So, changes can be made in the color, design, graphics or any other component to create a unique layout.
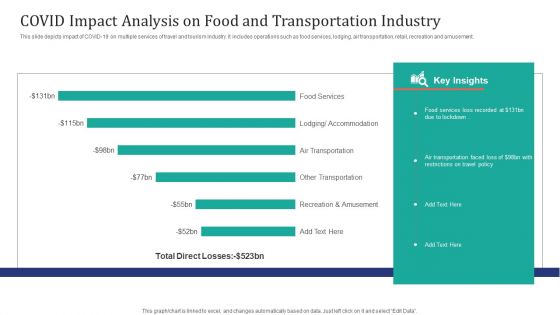
COVID Impact Analysis On Food And Transportation Industry Ppt Infographic Template Diagrams PDF
This slide depicts impact of COVID-19 on multiple services of travel and tourism industry. It includes operations such as food services, lodging, air transportation, retail, recreation and amusement. Showcasing this set of slides titled COVID Impact Analysis On Food And Transportation Industry Ppt Infographic Template Diagrams PDF. The topics addressed in these templates are Food Services, Air Transportation Faced, Restrictions Travel Policy. All the content presented in this PPT design is completely editable. Download it and make adjustments in color, background, font etc. as per your unique business setting.
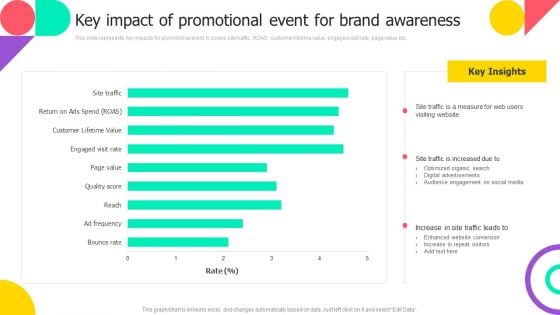
Brand Engagement Promotional Campaign Implementation Key Impact Of Promotional Event For Brand Awareness Diagrams PDF
This slide represents key impacts for promotional event. It covers site traffic, ROAS, customer lifetime value, engaged visit rate, page value etc. Find a pre designed and impeccable Brand Engagement Promotional Campaign Implementation Key Impact Of Promotional Event For Brand Awareness Diagrams PDF. The templates can ace your presentation without additional effort. You can download these easy to edit presentation templates to make your presentation stand out from others. So, what are you waiting for Download the template from Slidegeeks today and give a unique touch to your presentation.
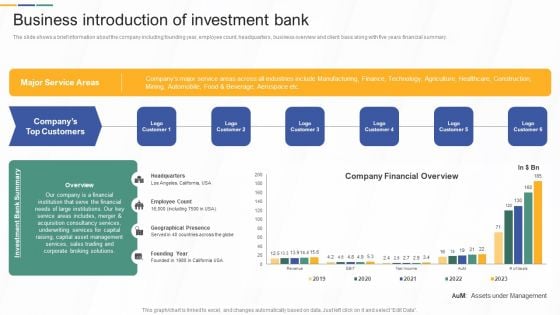
Business Introduction Of Investment Bank Investment Banking And Deal Pitchbook Diagrams PDF
The slide shows a brief information about the company including founding year, employee count, headquarters, business overview and client base along with five years financial summary. If your project calls for a presentation, then Slidegeeks is your go-to partner because we have professionally designed, easy-to-edit templates that are perfect for any presentation. After downloading, you can easily edit Business Introduction Of Investment Bank Investment Banking And Deal Pitchbook Diagrams PDF and make the changes accordingly. You can rearrange slides or fill them with different images. Check out all the handy templates.
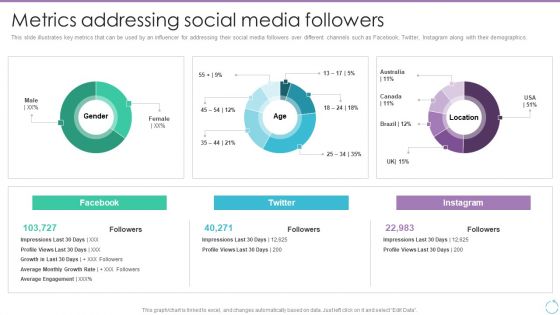
Personal Branding Plan For Executives Metrics Addressing Social Media Followers Diagrams PDF
This slide illustrates key metrics that can be used by an influencer for addressing their social media followers over different channels such as Facebook, Twitter, Instagram along with their demographics. The Personal Branding Plan For Executives Metrics Addressing Social Media Followers Diagrams PDF is a compilation of the most recent design trends as a series of slides. It is suitable for any subject or industry presentation, containing attractive visuals and photo spots for businesses to clearly express their messages. This template contains a variety of slides for the user to input data, such as structures to contrast two elements, bullet points, and slides for written information. Slidegeeks is prepared to create an impression.
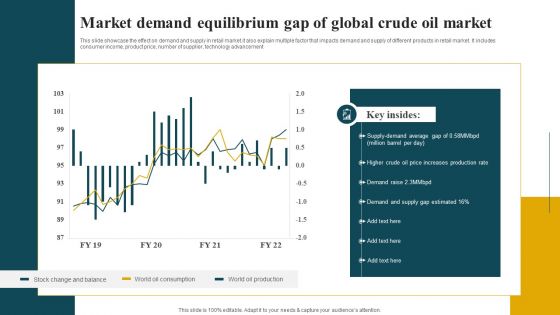
Market Demand Equilibrium Gap Of Global Crude Oil Market Diagrams PDF
This slide showcase the effect on demand and supply in retail market.it also explain multiple factor that impacts demand and supply of different products in retail market. It includes consumer income, product price, number of supplier, technology advancement. Pitch your topic with ease and precision using this Market Demand Equilibrium Gap Of Global Crude Oil Market Diagrams PDF. This layout presents information on Demand And Supply, Production Rate, Average. It is also available for immediate download and adjustment. So, changes can be made in the color, design, graphics or any other component to create a unique layout.
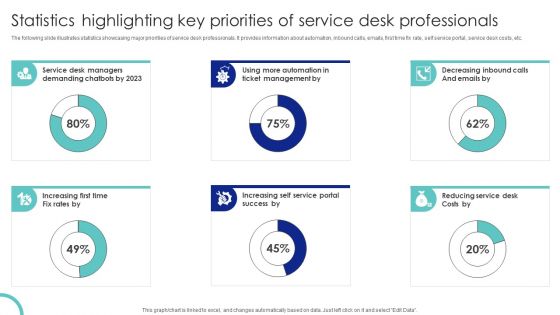
Statistics Highlighting Key Priorities Of Service Desk Professionals Ppt PowerPoint Presentation Diagram PDF
The following slide illustrates statistics showcasing major priorities of service desk professionals. It provides information about automation, inbound calls, emails, first time fix rate, self service portal, service desk costs, etc. If your project calls for a presentation, then Slidegeeks is your go to partner because we have professionally designed, easy to edit templates that are perfect for any presentation. After downloading, you can easily edit Statistics Highlighting Key Priorities Of Service Desk Professionals Ppt PowerPoint Presentation Diagram PDF and make the changes accordingly. You can rearrange slides or fill them with different images. Check out all the handy templates.
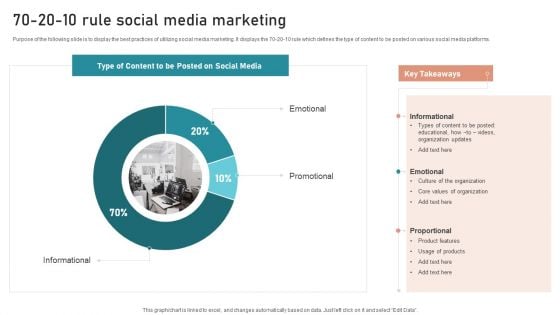
B2B And B2C Startups Marketing Mix Strategies 70 20 10 Rule Social Media Marketing Diagrams PDF
Purpose of the following slide is to display the best practices of utilizing social media marketing. It displays the 70 20 10 rule which defines the type of content to be posted on various social media platforms. Find a pre designed and impeccable B2B And B2C Startups Marketing Mix Strategies 70 20 10 Rule Social Media Marketing Diagrams PDF. The templates can ace your presentation without additional effort. You can download these easy to edit presentation templates to make your presentation stand out from others. So, what are you waiting for Download the template from Slidegeeks today and give a unique touch to your presentation.
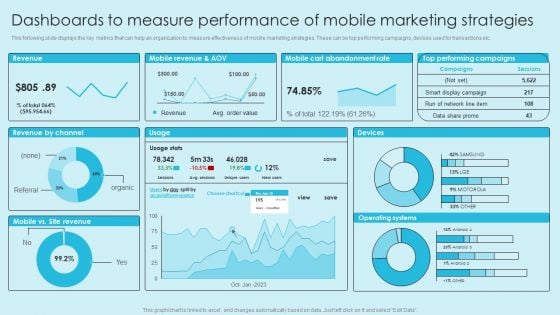
Online Marketing Techniques For Acquiring Clients Dashboards To Measure Performance Of Mobile Marketing Diagrams PDF
This following slide displays the key metrics that can help an organization to measure effectiveness of mobile marketing strategies. These can be top performing campaigns, devises used for transactions etc. Find a pre designed and impeccable Online Marketing Techniques For Acquiring Clients Dashboards To Measure Performance Of Mobile Marketing Diagrams PDF. The templates can ace your presentation without additional effort. You can download these easy to edit presentation templates to make your presentation stand out from others. So, what are you waiting for. Download the template from Slidegeeks today and give a unique touch to your presentation.
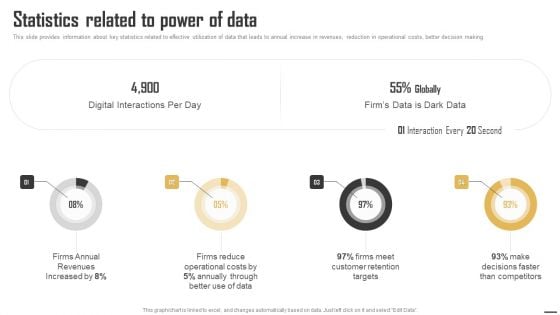
Data Monetization And Management Statistics Related To Power Of Data Diagrams PDF
This slide provides information about key statistics related to effective utilization of data that leads to annual increase in revenues, reduction in operational costs, better decision making. Find a pre-designed and impeccable Data Monetization And Management Statistics Related To Power Of Data Diagrams PDF. The templates can ace your presentation without additional effort. You can download these easy-to-edit presentation templates to make your presentation stand out from others. So, what are you waiting for Download the template from Slidegeeks today and give a unique touch to your presentation.
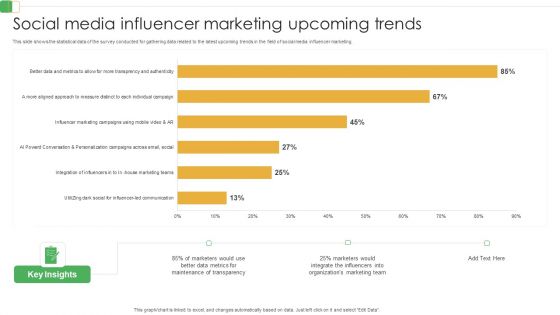
Social Media Influencer Marketing Upcoming Trends Ppt PowerPoint Presentation Diagram Templates PDF
This slide shows the statistical data of the survey conducted for gathering data related to the latest upcoming trends in the field of social media influencer marketing.Showcasing this set of slides titled Social Media Influencer Marketing Upcoming Trends Ppt PowerPoint Presentation Diagram Templates PDF. The topics addressed in these templates are Maintenance Transparency, Better Data Metrics, Integrate Influencers. All the content presented in this PPT design is completely editable. Download it and make adjustments in color, background, font etc. as per your unique business setting.
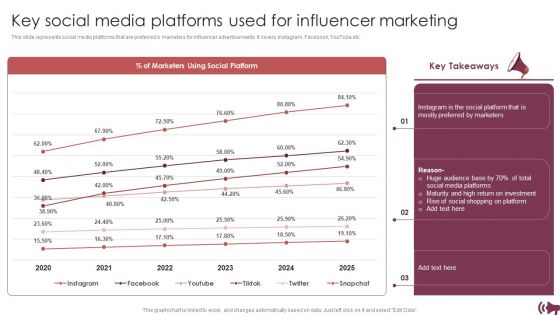
Guide Digital Advertising Optimize Lead Targeting Key Social Media Platforms Used For Influencer Marketing Diagrams PDF
This slide represents social media platforms that are preferred b marketers for influencer advertisements. It covers Instagram, Facebook, YouTube etc. Find a pre designed and impeccable Guide Digital Advertising Optimize Lead Targeting Key Social Media Platforms Used For Influencer Marketing Diagrams PDF. The templates can ace your presentation without additional effort. You can download these easy to edit presentation templates to make your presentation stand out from others. So, what are you waiting for Download the template from Slidegeeks today and give a unique touch to your presentation.
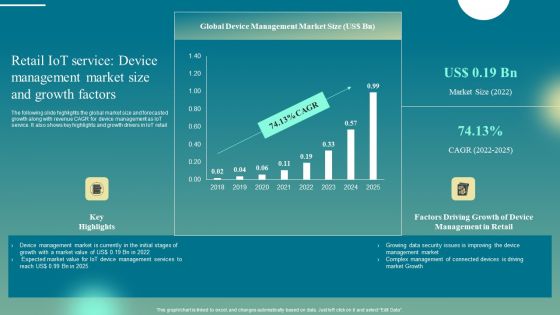
Retail Iot Service Device Management Market Size And Growth Factors Diagrams PDF
The following slide highlights the global market size and forecasted growth along with revenue CAGR for device management as IoT service. It also shows key highlights and growth drivers in IoT retail. If your project calls for a presentation, then Slidegeeks is your go-to partner because we have professionally designed, easy-to-edit templates that are perfect for any presentation. After downloading, you can easily edit Retail Iot Service Device Management Market Size And Growth Factors Diagrams PDF and make the changes accordingly. You can rearrange slides or fill them with different images. Check out all the handy templates
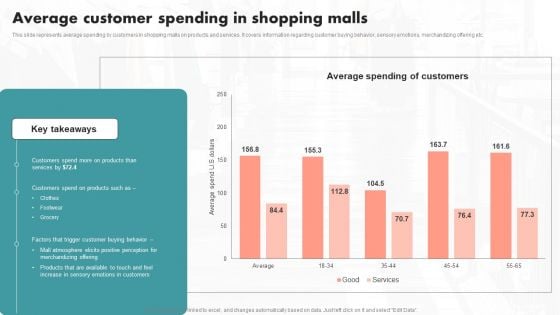
Average Customer Spending In Shopping Malls Ppt PowerPoint Presentation Diagram Images PDF
This slide represents average spending by customers in shopping malls on products and services. It covers information regarding customer buying behavior, sensory emotions, merchandizing offering etc. qIf your project calls for a presentation, then Slidegeeks is your go to partner because we have professionally designed, easy to edit templates that are perfect for any presentation. After downloading, you can easily edit Average Customer Spending In Shopping Malls Ppt PowerPoint Presentation Diagram Images PDF and make the changes accordingly. You can rearrange slides or fill them with different images. Check out all the handy templates
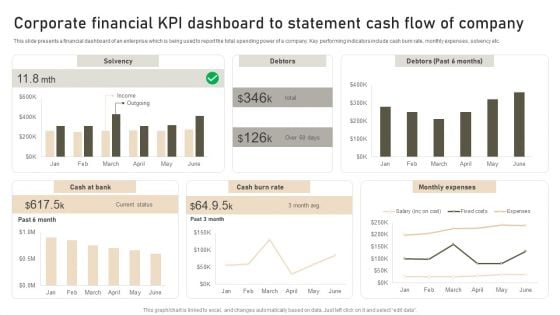
Corporate Financial KPI Dashboard To Statement Cash Flow Of Company Diagrams PDF
This slide presents a financial dashboard of an enterprise which is being used to report the total spending power of a company. Key performing indicators include cash burn rate, monthly expenses, solvency etc. Showcasing this set of slides titled Corporate Financial KPI Dashboard To Statement Cash Flow Of Company Diagrams PDF. The topics addressed in these templates are Solvency, Debtors, Monthly Expenses. All the content presented in this PPT design is completely editable. Download it and make adjustments in color, background, font etc. as per your unique business setting.

Management Chart Digital Marketings Strategies PPT Template CP SS V
This slide showcases the key members of management board with their designation roles. It includes positions such as, President, CEO, Executive Vice-President, President and financial officer. This modern and well-arranged Management Chart Digital Marketings Strategies PPT Template CP SS V provides lots of creative possibilities. It is very simple to customize and edit with the Powerpoint Software. Just drag and drop your pictures into the shapes. All facets of this template can be edited with Powerpoint, no extra software is necessary. Add your own material, put your images in the places assigned for them, adjust the colors, and then you can show your slides to the world, with an animated slide included. This slide showcases the key members of management board with their designation roles. It includes positions such as, President, CEO, Executive Vice-President, President and financial officer.
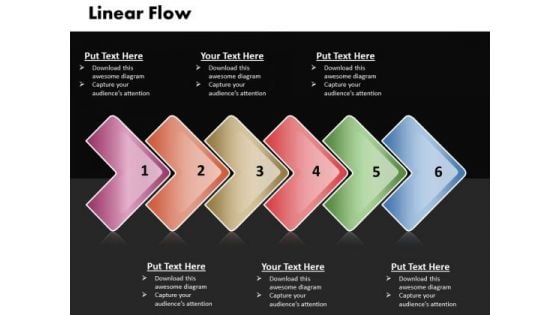
Ppt Linear Process Flow PowerPoint Template 6 State Diagram Templates
PPT linear process flow powerpoint template 6 state diagram Templates-Use this Diagram to define the mission and decide how it will be accomplished. -PPT linear process flow powerpoint template 6 state diagram Templates-Abstract, Arrow, Arrow Chart, Business, Design, Development, Diagram, Direction, Element, Flow, Flow Chart, Flow Diagram, Flowchart, Graph, Linear, Management, Model, Motion, Organization, Plan, Process, Process Arrows, Process Chart, Process Diagram, Process Flow, Program, Section, Segment, Set, Sign, Solution, Strategy, Symbol, Technology Build their faith in their ability. Beef up their confidence with our Ppt Linear Process Flow PowerPoint Template 6 State Diagram Templates.
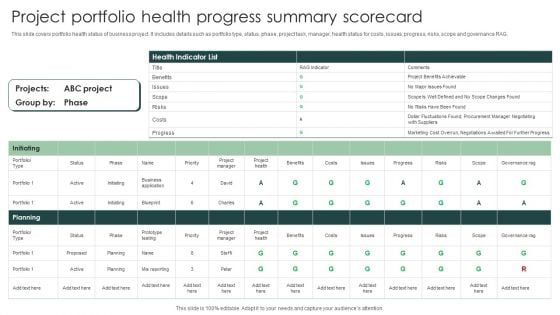
Project Portfolio Health Progress Summary Scorecard Diagrams PDF
This slide covers portfolio health status of business project. It includes details such as portfolio type, status, phase, project task, manager, health status for costs, issues, progress, risks, scope and governance RAG.Showcasing this set of slides titled Project Portfolio Health Progress Summary Scorecard Diagrams PDF. The topics addressed in these templates are Project Benefits Achievable, Procurement Manager, Negotiations Awaited. All the content presented in this PPT design is completely editable. Download it and make adjustments in color, background, font etc. as per your unique business setting.
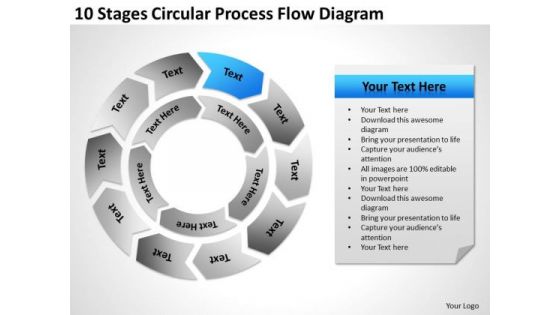
10 Stages Circular Process Flow Diagram Ppt Business Plan Steps PowerPoint Slides
We present our 10 stages circular process flow diagram ppt business plan steps PowerPoint Slides.Use our Marketing PowerPoint Templates because Our PowerPoint Templates and Slides will give you great value for your money. Be assured of finding the best projection to highlight your words. Present our Competition PowerPoint Templates because Our PowerPoint Templates and Slides will let you Leave a lasting impression to your audiences. They possess an inherent longstanding recall factor. Present our Arrows PowerPoint Templates because Our PowerPoint Templates and Slides are aesthetically designed to attract attention. We gaurantee that they will grab all the eyeballs you need. Download our Circle Charts PowerPoint Templates because Our PowerPoint Templates and Slides are topically designed to provide an attractive backdrop to any subject. Download and present our Business PowerPoint Templates because Our PowerPoint Templates and Slides will let you Leave a lasting impression to your audiences. They possess an inherent longstanding recall factor.Use these PowerPoint slides for presentations relating to Arrow, diagram, chart, process, flow, circular, vector, ring, around, section, round, motion, movement, segment, vibrant, kind of diagram, circle diagram, refresh, process diagram, sign, rotation, glossy, symbol, circle, element, circular arrows, shape, cycle, circulation, illustration, direction, round diagram, cycle arrows, cyclic, arrow circle diagram, arrow circles, circular flow. The prominent colors used in the PowerPoint template are Blue, Gray, White. Cut the cloth with our 10 Stages Circular Process Flow Diagram Ppt Business Plan Steps PowerPoint Slides. Make your thoughts the fashion of the day.
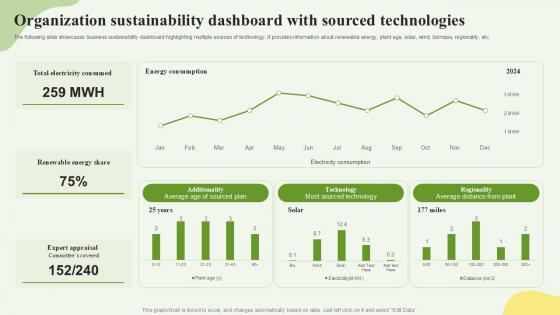
Organization Sustainability Dashboard With Sourced Technologies Ppt Example SS
The following slide showcases techniques to bring sustainability in startups. It provides information about sustainable solutions, eco point, electric vehicles, ozone generator, etc. Retrieve professionally designed Organization Sustainability Dashboard With Sourced Technologies Ppt Example SS to effectively convey your message and captivate your listeners. Save time by selecting pre-made slideshows that are appropriate for various topics, from business to educational purposes. These themes come in many different styles, from creative to corporate, and all of them are easily adjustable and can be edited quickly. Access them as PowerPoint templates or as Google Slides themes. You do not have to go on a hunt for the perfect presentation because Slidegeeks got you covered from everywhere. The following slide showcases techniques to bring sustainability in startups. It provides information about sustainable solutions, eco point, electric vehicles, ozone generator, etc.
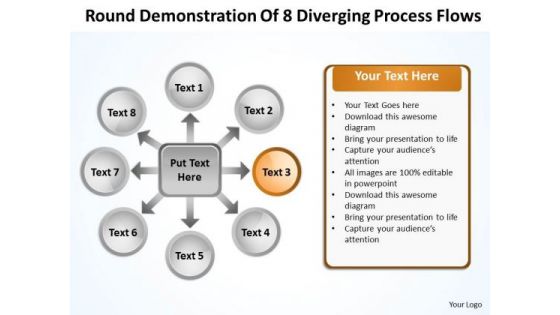
Round Demonstration Of 8 Diverging Process Flows Target Diagram PowerPoint Slides
We present our round demonstration of 8 diverging process flows Target Diagram PowerPoint Slides.Download our Flow Charts PowerPoint Templates because it helps you to inform your team of your innovative ideas. Download and present our Success PowerPoint Templates because it Saves your time as a prized possession, an ideal aid to give an ideal presentation. Download our Shapes PowerPoint Templates because analyse your plans with equal sincerity. Download our Business PowerPoint Templates because this diagram can set an example to enthuse your team with the passion and fervour of your ideas. Present our Arrows PowerPoint Templates because they have fired the dreams of many fertile minds.Use these PowerPoint slides for presentations relating to Access, Arrow, Background, Bright, Business, Chart, Colorful, Concept, Connection, Creative, Design, Different, Graphic, Group, Idea, Illustration, Part, Process, Shape, Strategy, Symbol, Template, Usable, Vector, Web, Website. The prominent colors used in the PowerPoint template are Orange, Gray, White. People tell us our round demonstration of 8 diverging process flows Target Diagram PowerPoint Slides are topically designed to provide an attractive backdrop to any subject. People tell us our Concept PowerPoint templates and PPT Slides provide you with a vast range of viable options. Select the appropriate ones and just fill in your text. The feedback we get is that our round demonstration of 8 diverging process flows Target Diagram PowerPoint Slides are Elegant. Presenters tell us our Colorful PowerPoint templates and PPT Slides are Royal. Customers tell us our round demonstration of 8 diverging process flows Target Diagram PowerPoint Slides are Majestic. The feedback we get is that our Chart PowerPoint templates and PPT Slides are designed by a team of presentation professionals. Coordinate teams with our Round Demonstration Of 8 Diverging Process Flows Target Diagram PowerPoint Slides. Download without worries with our money back guaranteee.
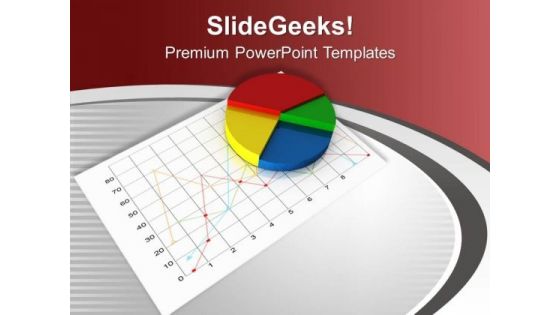
Pie Chart For Finance Result PowerPoint Templates Ppt Backgrounds For Slides 0513
Put yourself in a dominant position. Our Pie Chart For Finance Result PowerPoint Templates PPT Backgrounds For Slides will confirm your superiority. Dominate proceedings with your ideas. Our Pie charts PowerPoint Templates will empower your thoughts. Our Business PowerPoint Templates have a domino effect. Your ideas will generate one after another. Get fashionable with our Pie Chart For Finance Result PowerPoint Templates Ppt Backgrounds For Slides 0513. Whatever you display will be in.

Business Pie Chart For Target Analysis PowerPoint Templates Ppt Backgrounds For Slides 0713
Put yourself in a dominant position. Our Business Pie Chart For Target Analysis PowerPoint Templates PPT Backgrounds For Slides will confirm your superiority. Dominate proceedings with your ideas. Our People PowerPoint Templates will empower your thoughts. Our Pie Charts PowerPoint Templates have a domino effect. Your ideas will generate one after another. Our Business Pie Chart For Target Analysis PowerPoint Templates Ppt Backgrounds For Slides 0713 are created to enhance every idea. They give more body to each one of them.
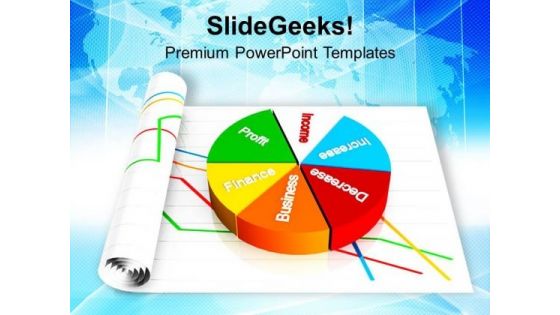
3d Pie Chart With Business Concepts PowerPoint Templates Ppt Backgrounds For Slides 0713
Put yourself in a dominant position. Our 3d Pie Chart With Business Concepts PowerPoint Templates PPT Backgrounds For Slides 0713 will confirm your superiority. Dominate proceedings with your ideas. Our Pie charts PowerPoint Templates will empower your thoughts. Our Business PowerPoint Templates have a domino effect. Your ideas will generate one after another. Figure on our 3d Pie Chart With Business Concepts PowerPoint Templates Ppt Backgrounds For Slides 0713 for their expertise. They will prove their fibre again and again.
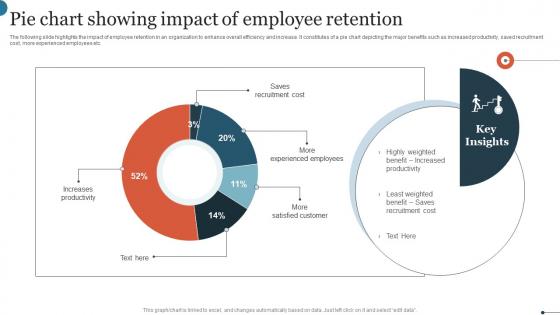
Pie Chart Showing Impact Of Employee Retention Mockup Pdf
The following slide highlights the impact of employee retention in an organization to enhance overall efficiency and increase. It constitutes of a pie chart depicting the major benefits such as increased productivity, saved recruitment cost, more experienced employees etc. Showcasing this set of slides titled Pie Chart Showing Impact Of Employee Retention Mockup Pdf. The topics addressed in these templates are Saves Recruitment Cost, More Experienced Employees, More Satisfied Customer. All the content presented in this PPT design is completely editable. Download it and make adjustments in color, background, font etc. as per your unique business setting. The following slide highlights the impact of employee retention in an organization to enhance overall efficiency and increase. It constitutes of a pie chart depicting the major benefits such as increased productivity, saved recruitment cost, more experienced employees etc.
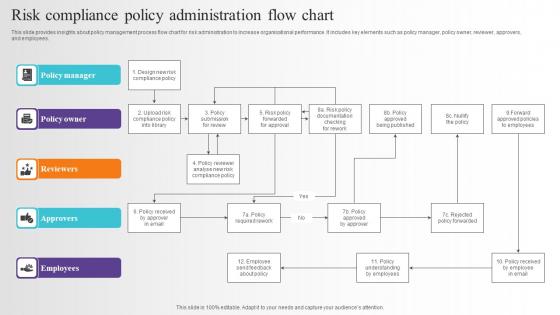
Risk Compliance Policy Administration Flow Chart Introduction Pdf
This slide provides insights about policy management process flow chart for risk administration to increase organisational performance. It includes key elements such as policy manager, policy owner, reviewer, approvers, and employees. Showcasing this set of slides titled Risk Compliance Policy Administration Flow Chart Introduction Pdf. The topics addressed in these templates are Policy Owner, Reviewer, Approvers, Employees. All the content presented in this PPT design is completely editable. Download it and make adjustments in color, background, font etc. as per your unique business setting. This slide provides insights about policy management process flow chart for risk administration to increase organisational performance. It includes key elements such as policy manager, policy owner, reviewer, approvers, and employees.
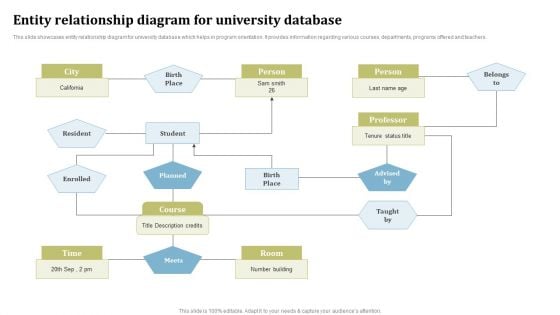
Entity Relationship Diagram For University Database Ppt Ideas Vector PDF
This slide showcases entity relationship diagram for university database which helps in program orientation. It provides information regarding various courses, departments, programs offered and teachers. Persuade your audience using this Entity Relationship Diagram For University Database Ppt Ideas Vector PDF. This PPT design covers one stages, thus making it a great tool to use. It also caters to a variety of topics including Birth Place, Person Course, Time, Number Building. Download this PPT design now to present a convincing pitch that not only emphasizes the topic but also showcases your presentation skills.
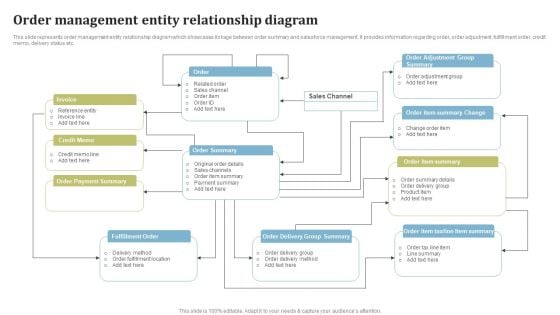
Order Management Entity Relationship Diagram Ppt Outline Influencers PDF
This slide represents order management entity relationship diagram which showcases linkage between order summary and salesforce management. It provides information regarding order, order adjustment, fulfillment order, credit memo, delivery status etc. Persuade your audience using this Order Management Entity Relationship Diagram Ppt Outline Influencers PDF. This PPT design covers one stages, thus making it a great tool to use. It also caters to a variety of topics including Sales Channel, Invoice, Credit Memo, Order Summary. Download this PPT design now to present a convincing pitch that not only emphasizes the topic but also showcases your presentation skills.
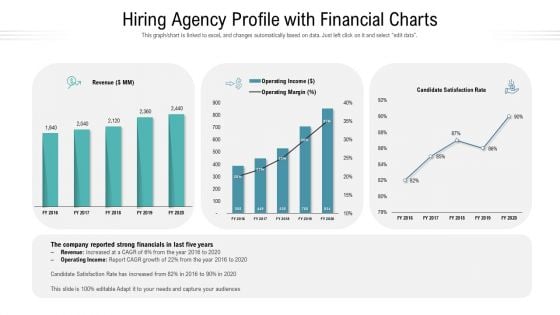
Hiring Agency Profile With Financial Charts Ppt Model Example PDF
This graph or chart is linked to excel, and changes automatically based on data. Just left click on it and select edit data. Pitch your topic with ease and precision using this hiring agency profile with financial charts ppt model example pdf. This layout presents information on revenue, operating income, operating margin, satisfaction rate. It is also available for immediate download and adjustment. So, changes can be made in the color, design, graphics or any other component to create a unique layout.
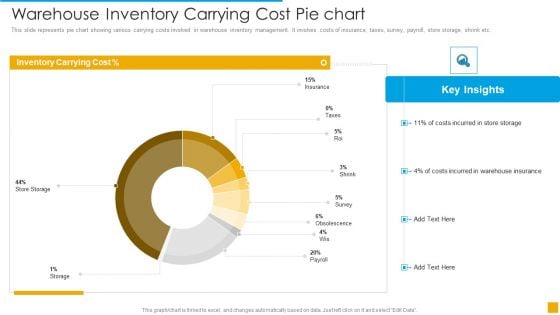
Warehouse Inventory Carrying Cost Pie Chart Demonstration PDF
This slide represents pie chart showing various carrying costs involved in warehouse inventory management. It involves costs of insurance, taxes, survey, payroll, store storage, shrink etc.Pitch your topic with ease and precision using this Warehouse Inventory Carrying Cost Pie Chart Demonstration PDF. This layout presents information on Cost, Inventory, Storage. It is also available for immediate download and adjustment. So, changes can be made in the color, design, graphics or any other component to create a unique layout.
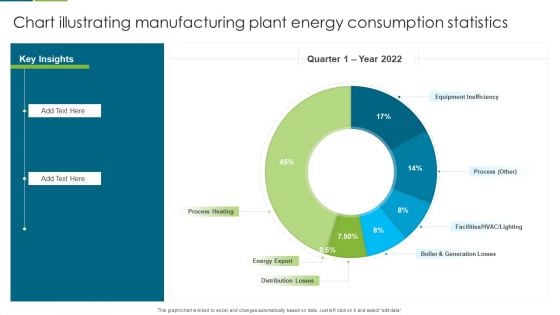
Chart Illustrating Manufacturing Plant Energy Consumption Statistics Slides PDF
This graph or chart is linked to excel, and changes automatically based on data. Just left click on it and select edit data. Pitch your topic with ease and precision using this Chart Illustrating Manufacturing Plant Energy Consumption Statistics Slides PDF. This layout presents information on Equipment Inefficiency, Process Heating, Energy Export. It is also available for immediate download and adjustment. So, changes can be made in the color, design, graphics or any other component to create a unique layout.
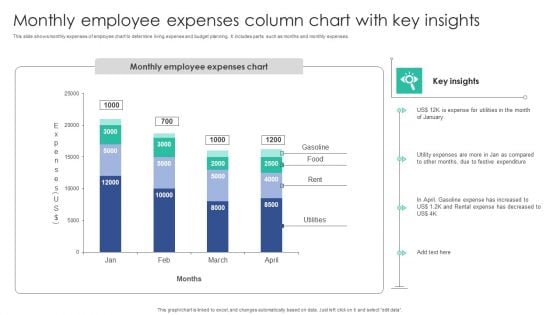
Monthly Employee Expenses Column Chart With Key Insights Download PDF
This slide shows monthly expenses of employee chart to determine living expense and budget planning. It includes parts such as months and monthly expenses.Showcasing this set of slides titled Monthly Employee Expenses Column Chart With Key Insights Download PDF. The topics addressed in these templates are Expense Utilities, Festive Expenditure, Gasoline Expense. All the content presented in this PPT design is completely editable. Download it and make adjustments in color, background, font etc. as per your unique business setting.
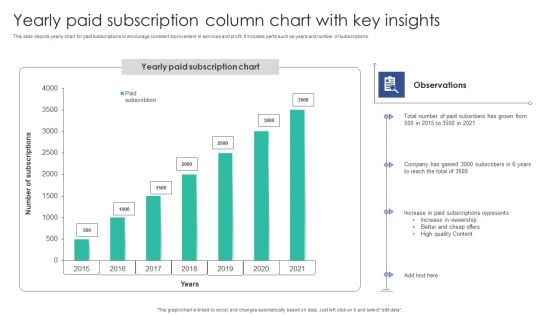
Yearly Paid Subscription Column Chart With Key Insights Microsoft PDF
This slide depicts yearly chart for paid subscriptions to encourage constant improvement in services and profit. It includes parts such as years and number of subscriptions.Showcasing this set of slides titled Yearly Paid Subscription Column Chart With Key Insights Microsoft PDF. The topics addressed in these templates are Paid Subscribers, Company Gained, Subscriptions Represents. All the content presented in this PPT design is completely editable. Download it and make adjustments in color, background, font etc. as per your unique business setting.
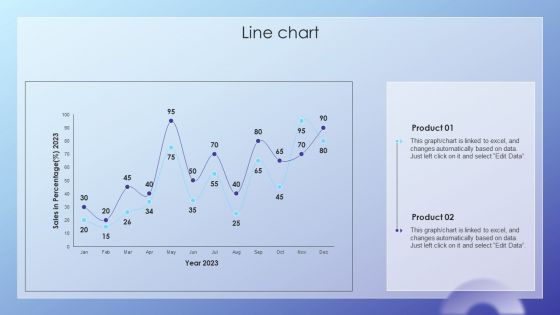
Client Acquisition Journey Plan Line Chart Ppt File Deck PDF
Create an editable Client Acquisition Journey Plan Line Chart Ppt File Deck PDF that communicates your idea and engages your audience. Whether youre presenting a business or an educational presentation, pre-designed presentation templates help save time. Client Acquisition Journey Plan Line Chart Ppt File Deck PDF is highly customizable and very easy to edit, covering many different styles from creative to business presentations. Slidegeeks has creative team members who have crafted amazing templates. So, go and get them without any delay.

Digital Advertisement Spend Trend Chart By Industries Elements PDF
This slide depicts expenditure trends for digital advertising by top industries. It includes retail, automotive, financial services, telecom, consumer products, travel, healthcare, media, entertainment, etc. Showcasing this set of slides titled Digital Advertisement Spend Trend Chart By Industries Elements PDF. The topics addressed in these templates are Retail Sector, Total Budget, Chart By Industries. All the content presented in this PPT design is completely editable. Download it and make adjustments in color, background, font etc. as per your unique business setting.
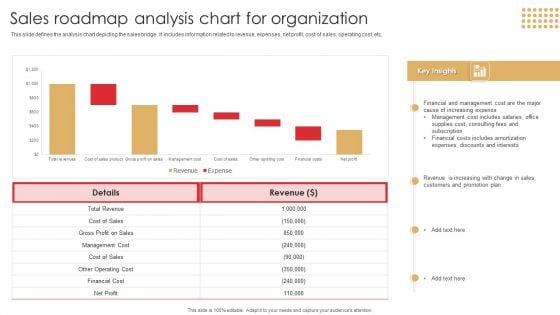
Sales Roadmap Analysis Chart For Organization Download PDF
This slide defines the analysis chart depicting the sales bridge . It includes information related to revenue, expenses, net profit, cost of sales, operating cost, etc.Showcasing this set of slides titled Sales Roadmap Analysis Chart For Organization Download PDF. The topics addressed in these templates are Management Cost, Financial Cost, Includes Amortization. All the content presented in this PPT design is completely editable. Download it and make adjustments in color, background, font etc. as per your unique business setting.
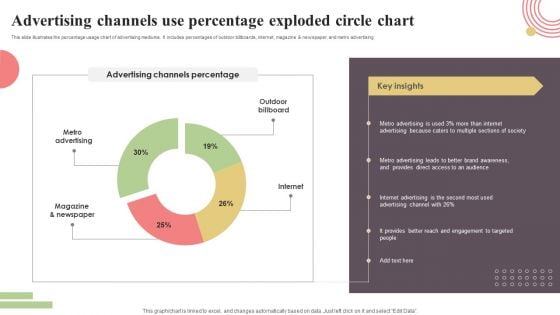
Advertising Channels Use Percentage Exploded Circle Chart Sample PDF
This slide illustrates the percentage usage chart of advertising mediums. It includes percentages of outdoor billboards, internet, magazine and newspaper, and metro advertising. Showcasing this set of slides titled Advertising Channels Use Percentage Exploded Circle Chart Sample PDF. The topics addressed in these templates are Metro Advertising, Magazine And Newspaper, Internet, Outdoor, Billboard. All the content presented in this PPT design is completely editable. Download it and make adjustments in color, background, font etc. as per your unique business setting.
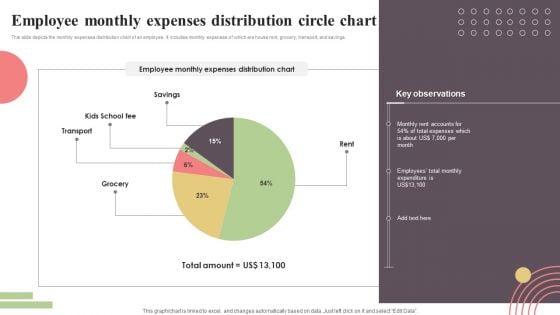
Employee Monthly Expenses Distribution Circle Chart Elements PDF
This slide depicts the monthly expenses distribution chart of an employee. It includes monthly expenses of which are house rent, grocery, transport, and savings. Showcasing this set of slides titled Employee Monthly Expenses Distribution Circle Chart Elements PDF. The topics addressed in these templates are Savings, Kids School Fee, Transport, Grocery, Rent. All the content presented in this PPT design is completely editable. Download it and make adjustments in color, background, font etc. as per your unique business setting.
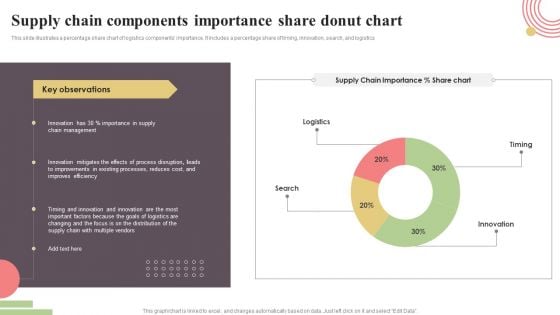
Supply Chain Components Importance Share Donut Chart Rules PDF
This slide illustrates a percentage share chart of logistics components importance. It includes a percentage share of timing, innovation, search, and logistics. Showcasing this set of slides titled Supply Chain Components Importance Share Donut Chart Rules PDF. The topics addressed in these templates are Timing, Innovation, Search, Logistics. All the content presented in this PPT design is completely editable. Download it and make adjustments in color, background, font etc. as per your unique business setting.
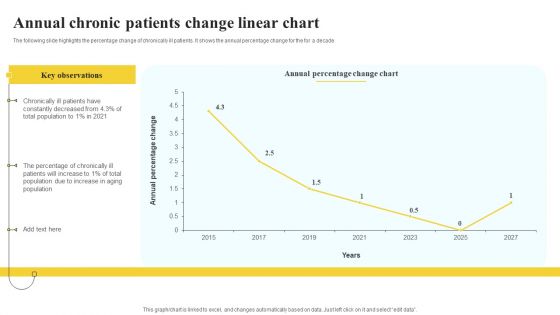
Annual Chronic Patients Change Linear Chart Demonstration PDF
The following slide highlights the percentage change of chronically ill patients. It shows the annual percentage change for the for a decade Showcasing this set of slides titled Annual Chronic Patients Change Linear Chart Demonstration PDF. The topics addressed in these templates are Key Observations, Annual Percentage, Linear Chart. All the content presented in this PPT design is completely editable. Download it and make adjustments in color, background, font etc. as per your unique business setting.
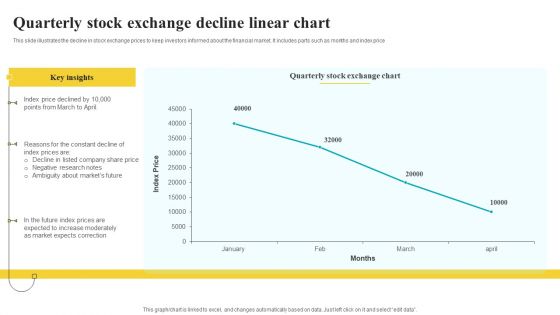
Quarterly Stock Exchange Decline Linear Chart Inspiration PDF
This slide illustrates the decline in stock exchange prices to keep investors informed about the financial market. It includes parts such as months and index price Pitch your topic with ease and precision using this Quarterly Stock Exchange Decline Linear Chart Inspiration PDF. This layout presents information on Key Insights, Exchange Chart, Correction. It is also available for immediate download and adjustment. So, changes can be made in the color, design, graphics or any other component to create a unique layout.
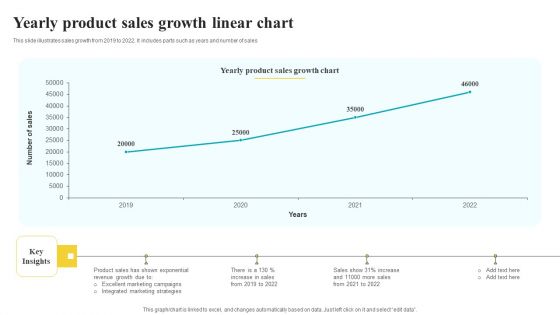
Yearly Product Sales Growth Linear Chart Pictures PDF
This slide illustrates sales growth from 2019 to 2022. It includes parts such as years and number of sales Pitch your topic with ease and precision using this Yearly Product Sales Growth Linear Chart Pictures PDF. This layout presents information on Sales Growth Chart, Key Insights, Strategies. It is also available for immediate download and adjustment. So, changes can be made in the color, design, graphics or any other component to create a unique layout.
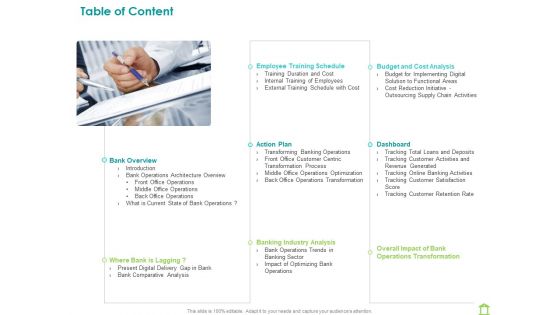
Operations Of Commercial Bank Table Of Content Ppt Professional Themes PDF
Presenting operations of commercial bank table of content ppt professional themes pdf to provide visual cues and insights. Share and navigate important information on one stages that need your due attention. This template can be used to pitch topics like employee training schedule, budget and cost analysis, dashboard, action plan, banking industry analysis, overall impact of bank operations transformation, bank overview. In addition, this PPT design contains high-resolution images, graphics, etc, that are easily editable and available for immediate download.
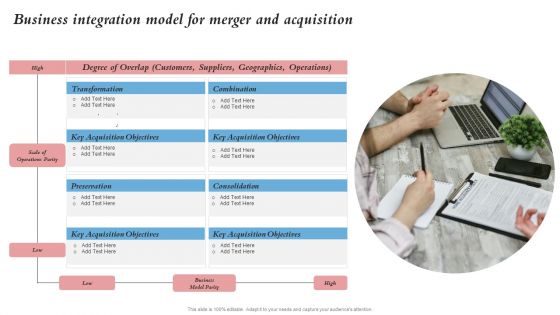
Business Integration Model For Merger And Acquisition Merger And Integration Procedure Themes PDF
Presenting Business Integration Model For Merger And Acquisition Merger And Integration Procedure Themes PDF to provide visual cues and insights. Share and navigate important information on one stage that need your due attention. This template can be used to pitch topics like Transformation, Acquisition Objectives, Preservation. In addtion, this PPT design contains high resolution images, graphics, etc, that are easily editable and available for immediate download.
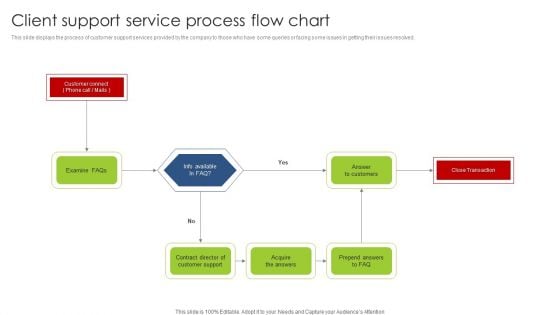
Client Support Service Process Flow Chart Structure PDF
This slide displays the process of customer support services provided by the company to those who have some queries or facing some issues in getting their issues resolved. Persuade your audience using this Client Support Service Process Flow Chart Structure PDF. This PPT design covers one stages, thus making it a great tool to use. It also caters to a variety of topics including Client Support Service, Process Flow Chart. Download this PPT design now to present a convincing pitch that not only emphasizes the topic but also showcases your presentation skills.

Website Design And Development Services Company Profile Ppt PowerPoint Presentation Complete Deck With Slides
Want to streamline the way your business operations are proceeding Here is a top Website Design And Development Services Company Profile Ppt PowerPoint Presentation Complete Deck With Slides for you to choose and devise your strategies according to your organizational goals. This PowerPoint slide exhibits coaching methods that business tycoons have for ages to streamline operations. The broad philosophy-based interactive presentation can help you choose your business approach as well. The complete deck in forty three slides also provides a description of each step and its ins and outs. Deploy this PowerPoint Diagram to get on the excellence highway. The presentation template is also equipped to do this with its 100 percent editable and customizable capability. Download now.
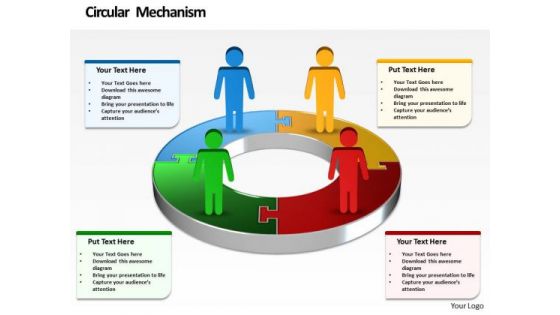
Ppt Symbol Business Men Standing On Financial Colorful Pie Chart PowerPoint Templates
PPT symbol business men standing on financial colorful pie chart PowerPoint Templates-Use this Business based PowerPoint Diagram to represent the Business issues Graphically. It indicates arrange, block out, blueprint, cast, delineate, design, devise, draft, graph , lay out, outline, plot, project, shape, sketch etc.-PPT symbol business men standing on financial colorful pie chart PowerPoint Templates-Adult, Art, Background, Business, Career, Chart, Communication, Concept, Conference, Corporate, Creative, Design, Economy, Executive, Finance, Group, Growth, Idea, Illustration, Leadership, Meeting, New, Occupation, Office, People, Person, Progress, Silhouette, Space, Speaking, Standing, Success Entertain your audience with your thoughts. Capture their imagination with our Ppt Symbol Business Men Standing On Financial Colorful Pie Chart PowerPoint Templates.
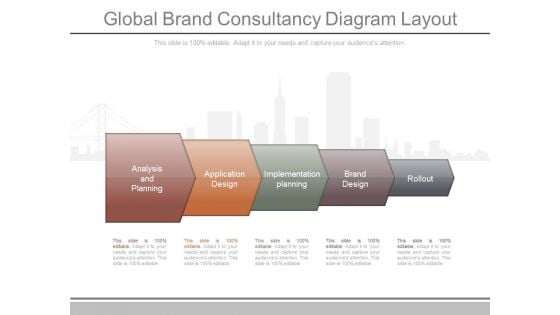
Global Brand Consultancy Diagram Layout
This is a global brand consultancy diagram layout. This is a five stage process. The stages in this process are analysis and planning, application design, implementation planning, brand design, rollout.\n\n\n\n\n\n\n\n
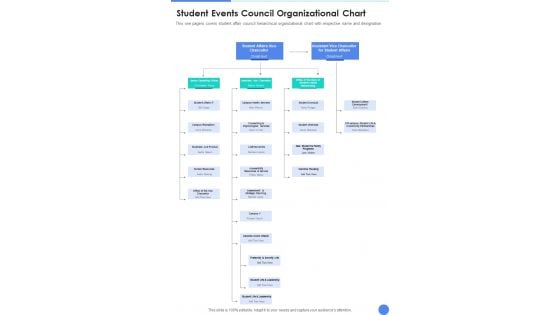
Student Events Council Organizational Chart One Pager Documents
This one pagers covers student affair council hierarchical organizational chart with respective name and designation. Presenting you an exemplary Student Events Council Organizational Chart One Pager Documents. Our one-pager comprises all the must-have essentials of an inclusive document. You can edit it with ease, as its layout is completely editable. With such freedom, you can tweak its design and other elements to your requirements. Download this Student Events Council Organizational Chart One Pager Documents brilliant piece now.
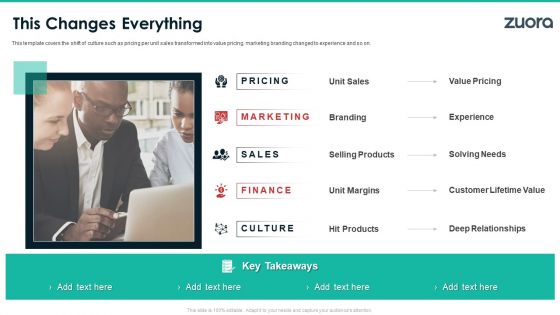
Zuora Capital Raising Elevator This Changes Everything Themes PDF
This template covers the shift of culture such as pricing per unit sales transformed into value pricing, marketing branding changed to experience and so on. This is a zuora capital raising elevator this changes everything themes pdf template with various stages. Focus and dispense information on five stages using this creative set, that comes with editable features. It contains large content boxes to add your information on topics like value, pricing, marketing, sales, finance. You can also showcase facts, figures, and other relevant content using this PPT layout. Grab it now.
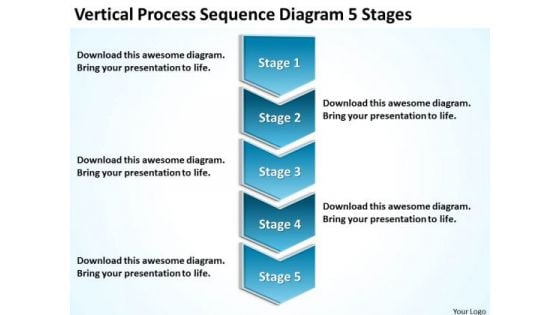
Process Sequence Diagram 5 Stages Small Business Plan Samples PowerPoint Templates
We present our process sequence diagram 5 stages small business plan samples PowerPoint templates.Download our Process and Flows PowerPoint Templates because It is Aesthetically crafted by artistic young minds. Our PowerPoint Templates and Slides are designed to display your dexterity. Use our Flow Charts PowerPoint Templates because Our PowerPoint Templates and Slides are designed to help you succeed. They have all the ingredients you need. Download and present our Business PowerPoint Templates because Our PowerPoint Templates and Slides are effectively colour coded to prioritise your plans They automatically highlight the sequence of events you desire. Download our Arrows PowerPoint Templates because Our PowerPoint Templates and Slides will provide weight to your words. They will bring out the depth of your thought process. Download and present our Success PowerPoint Templates because It will Strengthen your hand with your thoughts. They have all the aces you need to win the day.Use these PowerPoint slides for presentations relating to Design, website, sequence, page, manual, offer, step, special, layout, tutorial, order, flow, five, concept, arrow, vector, symbol, card,vertical, pointer, one, simple, label, modern, creative, illustration, options, number, instruction, web, direction, tab, paper, choice, infographic, version, progress, background, advertising, promotion, steps, process. The prominent colors used in the PowerPoint template are Blue, Blue light, White. Start delivering strong and sustainable gains with our Process Sequence Diagram 5 Stages Small Business Plan Samples PowerPoint Templates. They will make you look good.
PowerPoint Presentation Business Pie Chart List Ppt Presentation
PowerPoint Presentation Business Pie Chart list PPT Presentation-These high quality powerpoint pre-designed slides and powerpoint templates have been carefully created by our professional team to help you impress your audience. All slides have been created and are 100% editable in powerpoint. Each and every property of any graphic - color, size, orientation, shading, outline etc. can be modified to help you build an effective powerpoint presentation. Any text can be entered at any point in the powerpoint template or slide. Simply DOWNLOAD, TYPE and PRESENT! Display a fair minded approach with our PowerPoint Presentation Business Pie Chart List Ppt Presentation. Give due attention to all aspects.
PowerPoint Process Company Leadership 3d Circular Chart List Ppt Slide
PowerPoint Process Company Leadership 3d Circular Chart list PPT Slide-These high quality powerpoint pre-designed slides and powerpoint templates have been carefully created by our professional team to help you impress your audience. All slides have been created and are 100% editable in powerpoint. Each and every property of any graphic - color, size, orientation, shading, outline etc. can be modified to help you build an effective powerpoint presentation. Any text can be entered at any point in the powerpoint template or slide. Simply DOWNLOAD, TYPE and PRESENT! Entice them with our PowerPoint Process Company Leadership 3d Circular Chart List Ppt Slide. Lure them with your thoughts.
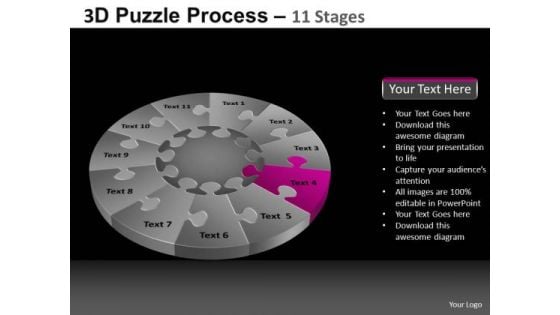
PowerPoint Process Download Pie Chart Puzzle Process Ppt Slide
PowerPoint Process Download Pie chart Puzzle Process PPT Slide-These high quality powerpoint pre-designed slides and powerpoint templates have been carefully created by our professional team to help you impress your audience. All slides have been created and are 100% editable in powerpoint. Each and every property of any graphic - color, size, orientation, shading, outline etc. can be modified to help you build an effective powerpoint presentation. Any text can be entered at any point in the powerpoint template or slide. Simply DOWNLOAD, TYPE and PRESENT! Get the correct coordination with our PowerPoint Process Download Pie Chart Puzzle Process Ppt Slide. They blend beautifully with your thoughts.
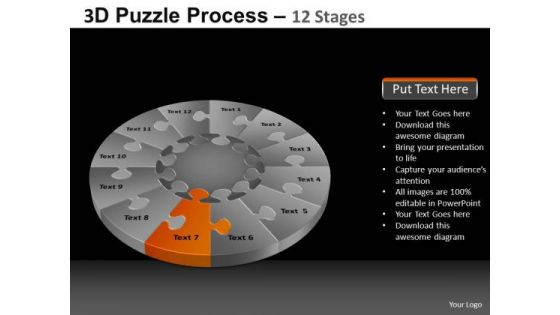
PowerPoint Process Success Pie Chart Puzzle Process Ppt Slide
PowerPoint Process Success Pie chart Puzzle Process PPT Slide-These high quality powerpoint pre-designed slides and powerpoint templates have been carefully created by our professional team to help you impress your audience. All slides have been created and are 100% editable in powerpoint. Each and every property of any graphic - color, size, orientation, shading, outline etc. can be modified to help you build an effective powerpoint presentation. Any text can be entered at any point in the powerpoint template or slide. Simply DOWNLOAD, TYPE and PRESENT! Make your presentations helpful with our PowerPoint Process Success Pie Chart Puzzle Process Ppt Slide. Dont waste time struggling with PowerPoint. Let us do it for you.
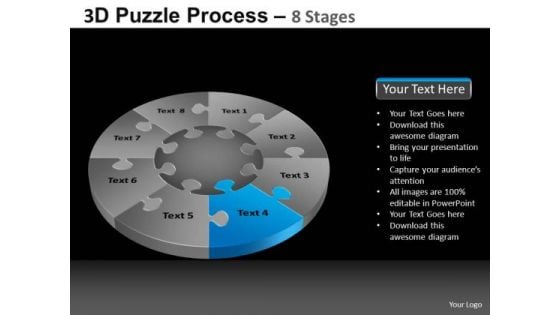
PowerPoint Slide Process Pie Chart Puzzle Process Ppt Slidelayout
PowerPoint Slide Process Pie chart Puzzle Process PPT Slidelayout-These high quality powerpoint pre-designed slides and powerpoint templates have been carefully created by our professional team to help you impress your audience. All slides have been created and are 100% editable in powerpoint. Each and every property of any graphic - color, size, orientation, shading, outline etc. can be modified to help you build an effective powerpoint presentation. Any text can be entered at any point in the powerpoint template or slide. Simply DOWNLOAD, TYPE and PRESENT! Stand on your own feet with our PowerPoint Slide Process Pie Chart Puzzle Process Ppt Slidelayout. They will deliver all the assistance you need.
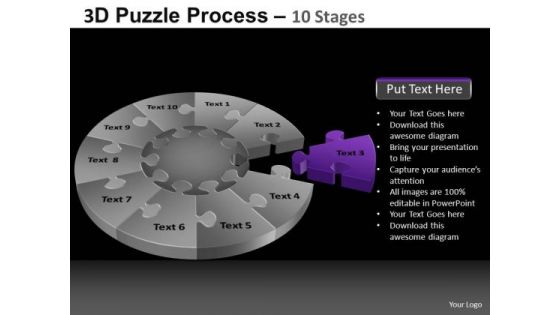
PowerPoint Slide Sales Pie Chart Puzzle Process Ppt Layout
PowerPoint Slide Sales Pie chart Puzzle Process PPT Layout-These high quality powerpoint pre-designed slides and powerpoint templates have been carefully created by our professional team to help you impress your audience. All slides have been created and are 100% editable in powerpoint. Each and every property of any graphic - color, size, orientation, shading, outline etc. can be modified to help you build an effective powerpoint presentation. Any text can be entered at any point in the powerpoint template or slide. Simply DOWNLOAD, TYPE and PRESENT! Gather the data and present with our PowerPoint Slide Sales Pie Chart Puzzle Process Ppt Layout. Try us out and see what a difference our templates make.
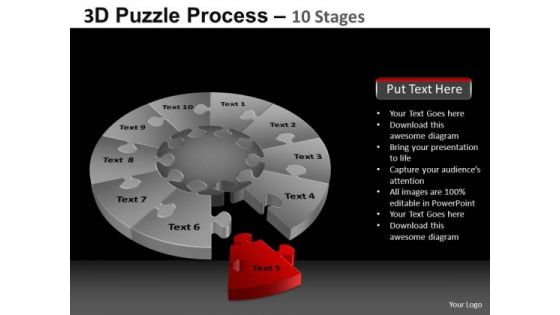
PowerPoint Slide Success Pie Chart Puzzle Process Ppt Template
PowerPoint Slide Success Pie chart Puzzle Process PPT Template-These high quality powerpoint pre-designed slides and powerpoint templates have been carefully created by our professional team to help you impress your audience. All slides have been created and are 100% editable in powerpoint. Each and every property of any graphic - color, size, orientation, shading, outline etc. can be modified to help you build an effective powerpoint presentation. Any text can be entered at any point in the powerpoint template or slide. Simply DOWNLOAD, TYPE and PRESENT! Be expressive with our PowerPoint Slide Success Pie Chart Puzzle Process Ppt Template. Bring in feeling to your thoughts.
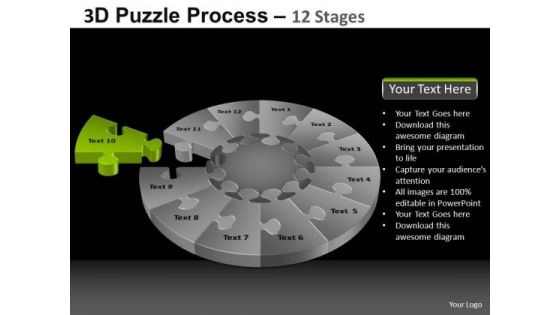
PowerPoint Slidelayout Editable Pie Chart Puzzle Process Ppt Backgrounds
PowerPoint Slidelayout Editable Pie chart Puzzle Process PPT Backgrounds-These high quality powerpoint pre-designed slides and powerpoint templates have been carefully created by our professional team to help you impress your audience. All slides have been created and are 100% editable in powerpoint. Each and every property of any graphic - color, size, orientation, shading, outline etc. can be modified to help you build an effective powerpoint presentation. Any text can be entered at any point in the powerpoint template or slide. Simply DOWNLOAD, TYPE and PRESENT! Get your experiment rolling along. Press the button with our PowerPoint Slidelayout Editable Pie Chart Puzzle Process Ppt Backgrounds.
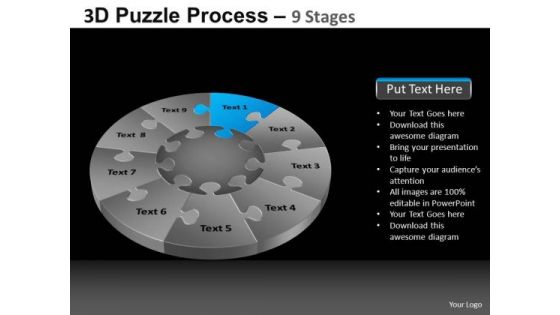
PowerPoint Slidelayout Global Pie Chart Puzzle Process Ppt Slide
PowerPoint Slidelayout Global Pie chart Puzzle Process PPT Slide-These high quality powerpoint pre-designed slides and powerpoint templates have been carefully created by our professional team to help you impress your audience. All slides have been created and are 100% editable in powerpoint. Each and every property of any graphic - color, size, orientation, shading, outline etc. can be modified to help you build an effective powerpoint presentation. Any text can be entered at any point in the powerpoint template or slide. Simply DOWNLOAD, TYPE and PRESENT! Learning from failures leads to success. Assimilate the lessons with our PowerPoint Slidelayout Global Pie Chart Puzzle Process Ppt Slide.


 Continue with Email

 Home
Home


