Executive Summary Dashboard
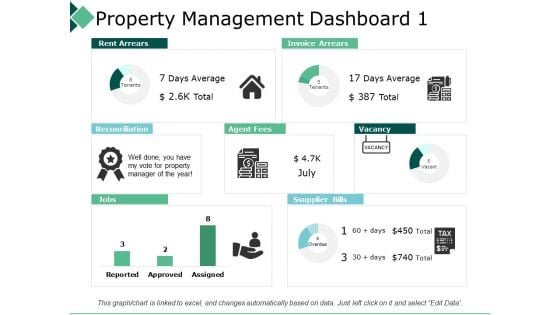
Property Management Dashboard 1 Reconciliation Ppt PowerPoint Presentation Professional Visuals
This is a property management dashboard 1 reconciliation ppt powerpoint presentation professional visuals. This is a three stage process. The stages in this process are business, management, strategy, analysis, icon.
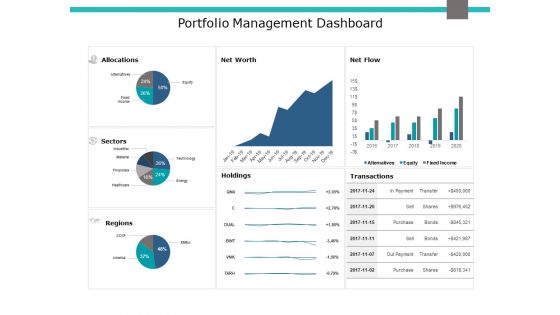
Portfolio Management Dashboard Ppt PowerPoint Presentation Gallery Example Introduction
This is a portfolio management dashboard ppt powerpoint presentation gallery example introduction. This is a three stage process. The stages in this process are area chart, finance, marketing, management, investment.
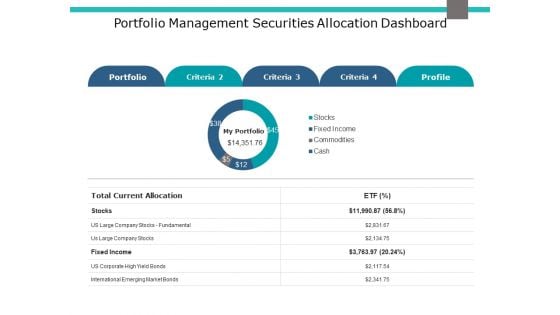
Portfolio Management Securities Allocation Dashboard Ppt PowerPoint Presentation Pictures Objects
This is a portfolio management securities allocation dashboard ppt powerpoint presentation pictures objects. This is a five stage process. The stages in this process are finance, marketing, management, investment.
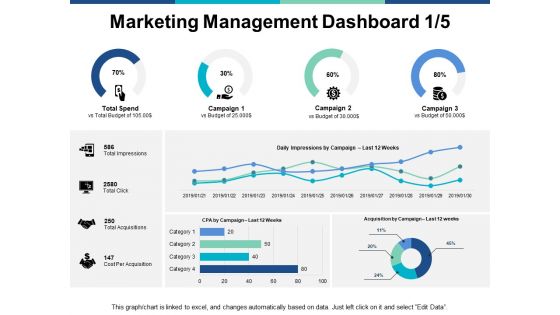
Marketing Management Dashboard Business Ppt PowerPoint Presentation Show Format
This is a marketing management dashboard business ppt powerpoint presentation show format. This is a four stage process. The stages in this process are finance, marketing, management, investment, analysis.

Marketing Management Dashboard Marketing Ppt PowerPoint Presentation Slides Graphics
This is a marketing management dashboard marketing ppt powerpoint presentation slides graphics. This is a three stage process. The stages in this process are finance, marketing, management, investment, analysis.
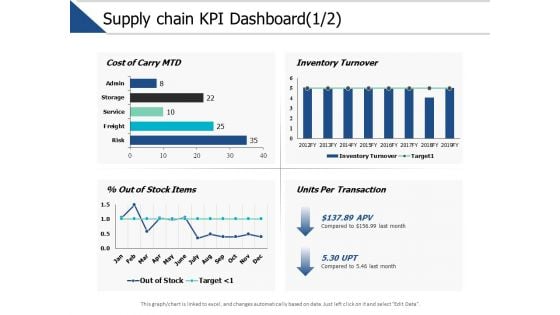
Supply Chain Kpi Dashboard Management Ppt PowerPoint Presentation Model Picture
This is a supply chain kpi dashboard management ppt powerpoint presentation model picture. This is a three stage process. The stages in this process are finance, marketing, management, investment, analysis.
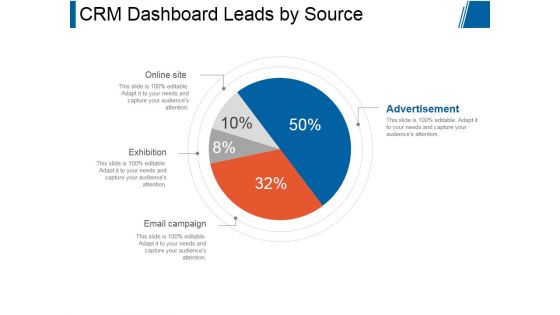
Crm Dashboard Leads By Source Ppt PowerPoint Presentation Slides
This is a crm dashboard leads by source ppt powerpoint presentation slides. This is a four stage process. The stages in this process are online site, exhibition, email campaign, advertisement.
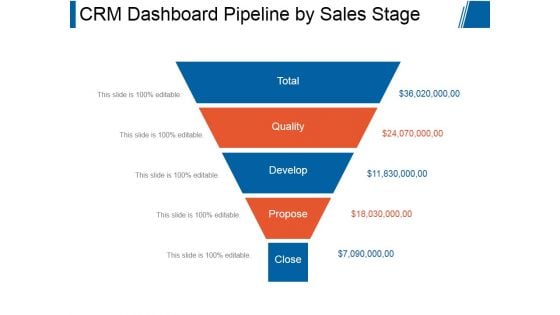
Crm Dashboard Pipeline By Sales Stage Ppt PowerPoint Presentation Show
This is a crm dashboard pipeline by sales stage ppt powerpoint presentation show. This is a five stage process. The stages in this process are total, quality, develop, propose, close.
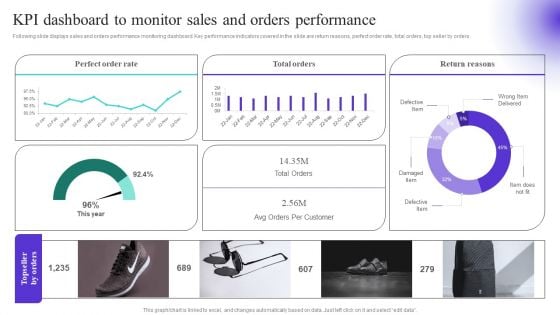
KPI Dashboard To Monitor Sales And Orders Performance Diagrams PDF
Following slide displays sales and orders performance monitoring dashboard. Key performance indicators covered in the slide are return reasons, perfect order rate, total orders, top seller by orders. Create an editable KPI Dashboard To Monitor Sales And Orders Performance Diagrams PDF that communicates your idea and engages your audience. Whether you are presenting a business or an educational presentation, pre designed presentation templates help save time. KPI Dashboard To Monitor Sales And Orders Performance Diagrams PDF is highly customizable and very easy to edit, covering many different styles from creative to business presentations. Slidegeeks has creative team members who have crafted amazing templates. So, go and get them without any delay.
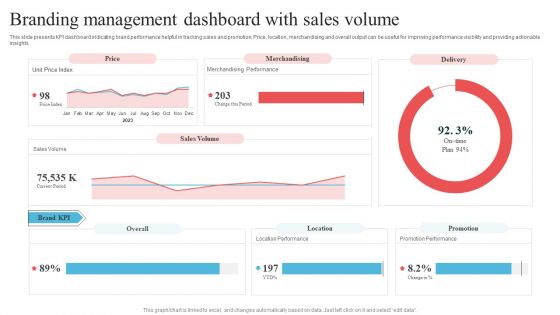
Branding Management Dashboard With Sales Volume Mockup PDF
This slide presents KPI dashboard indicating brand performance helpful in tracking sales and promotion. Price, location, merchandising and overall output can be useful for improving performance visibility and providing actionable insights. Showcasing this set of slides titled Branding Management Dashboard With Sales Volume Mockup PDF. The topics addressed in these templates are Branding Management Dashboard, Sales Volume. All the content presented in this PPT design is completely editable. Download it and make adjustments in color, background, font etc. as per your unique business setting.
Sales Performance Dashboard Ppt PowerPoint Presentation Professional Icons
This is a sales performance dashboard template ppt powerpoint presentation slides example file. This is a six stage process. The stages in this process are business, marketing, strategy, finance, planning.
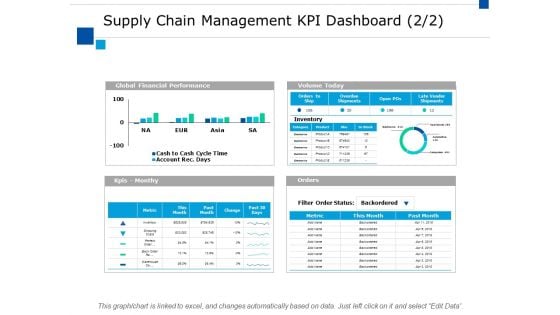
Supply Chain Management Kpi Dashboard Ppt PowerPoint Presentation File Slides
This is a supply chain management kpi dashboard ppt powerpoint presentation file slides. This is a four stage process. The stages in this process are finance, marketing, analysis, investment, million.
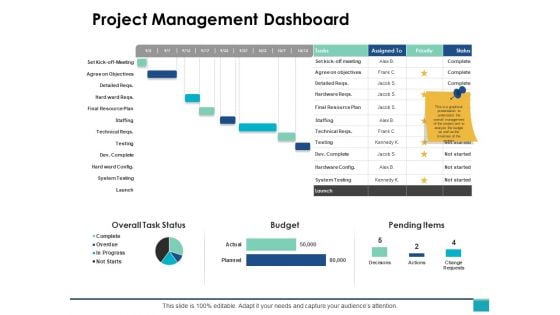
Project Management Dashboard Ppt PowerPoint Presentation Gallery Portrait
This is a project management dashboard ppt powerpoint presentation gallery portrait. The topics discussed in this diagram are finance, marketing, management, investment, analysis. This is a completely editable PowerPoint presentation, and is available for immediate download.
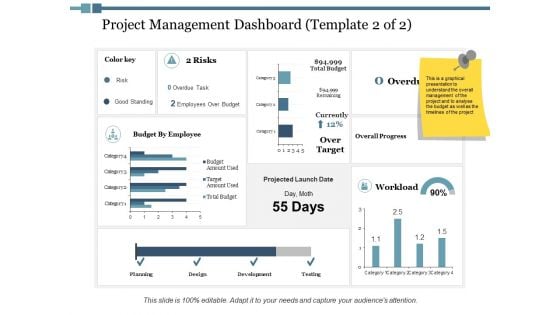
Project Management Dashboard Workload Ppt PowerPoint Presentation Inspiration Show
This is a project management dashboard workload ppt powerpoint presentation inspiration show. This is a four stage process. The stages in this process are finance, marketing, management, investment, analysis.
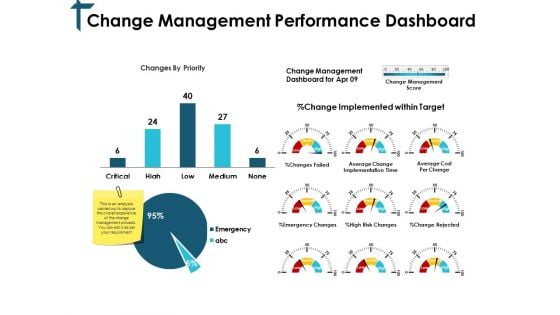
Change Management Performance Dashboard Ppt PowerPoint Presentation Professional Slides
This is a change management performance dashboard ppt powerpoint presentation professional slides. This is a three stage process. The stages in this process are finance, marketing, management, investment, analysis.
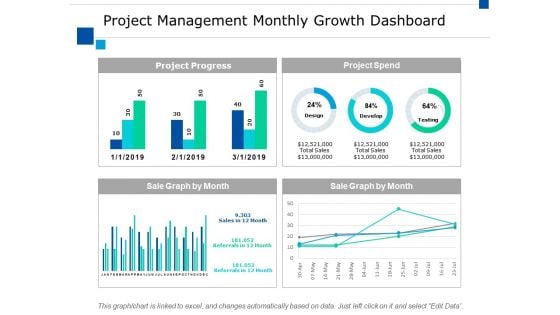
Project Management Monthly Growth Dashboard Ppt PowerPoint Presentation Pictures Guide
This is a project management monthly growth dashboard ppt powerpoint presentation pictures guide. This is a four stage process. The stages in this process are finance, marketing, management, investment, analysis.
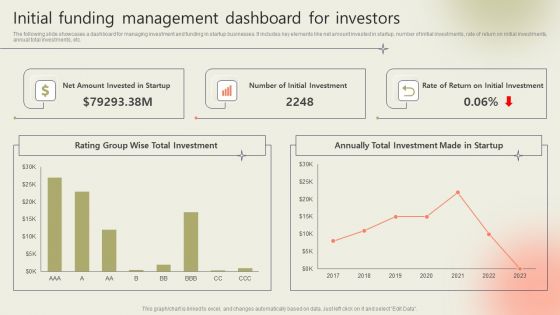
Initial Funding Management Dashboard For Investors Demonstration PDF
The following slide showcases a dashboard for managing investment and funding in startup businesses. It includes key elements like net amount invested in startup, number of initial investments, rate of return on initial investments, annual total investments, etc. Showcasing this set of slides titled Initial Funding Management Dashboard For Investors Demonstration PDF. The topics addressed in these templates are Initial Funding Management, Dashboard For Investors. All the content presented in this PPT design is completely editable. Download it and make adjustments in color, background, font etc. as per your unique business setting.
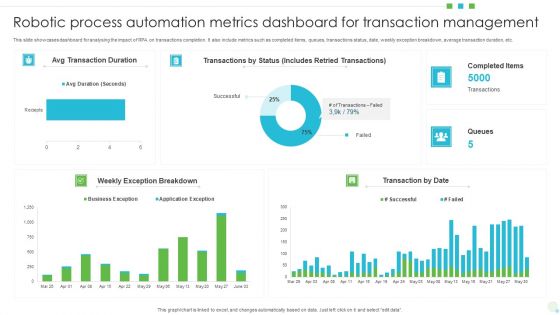
Robotic Process Automation Metrics Dashboard For Transaction Management Ideas PDF
This slide showcases dashboard for analysing the impact of RPA on transactions completion. It also include metrics such as completed items, queues, transactions status, date, weekly exception breakdown, average transaction duration, etc. Showcasing this set of slides titled Robotic Process Automation Metrics Dashboard For Transaction Management Ideas PDF. The topics addressed in these templates are Dashboard For Transaction Management, Robotic Process Automation Metrics. All the content presented in this PPT design is completely editable. Download it and make adjustments in color, background, font etc. as per your unique business setting.
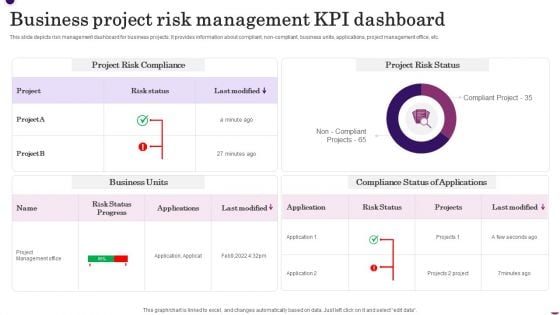
Business Project Risk Management KPI Dashboard Inspiration PDF
This slide depicts risk management dashboard for business projects. It provides information about compliant, non-compliant, business units, applications, project management office, etc. Showcasing this set of slides titled Business Project Risk Management KPI Dashboard Inspiration PDF. The topics addressed in these templates areProject Risk Compliance, Project Risk Status, Business Units . All the content presented in this PPT design is completely editable. Download it and make adjustments in color, background, font etc. as per your unique business setting.
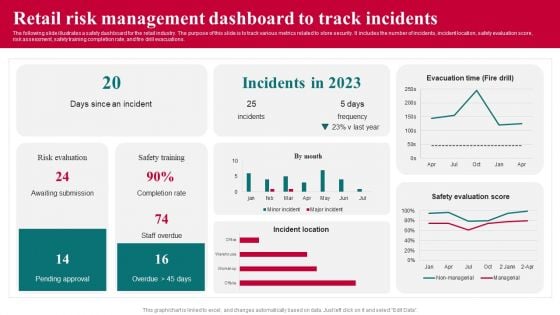
Retail Risk Management Dashboard To Track Incidents Professional PDF
The following slide illustrates a safety dashboard for the retail industry. The purpose of this slide is to track various metrics related to store security. It includes the number of incidents, incident location, safety evaluation score,risk assessment, safety training completion rate, and fire drill evacuations. Showcasing this set of slides titled Retail Risk Management Dashboard To Track Incidents Professional PDF. The topics addressed in these templates are Risk Evaluation, Retail Risk Management Dashboard, Track Incidents. All the content presented in this PPT design is completely editable. Download it and make adjustments in color, background, font etc. as per your unique business setting.
Icon For Risk Metrics Performance Indicators Dashboard Designs PDF
Persuade your audience using this Icon For Risk Metrics Performance Indicators Dashboard Designs PDF. This PPT design covers four stages, thus making it a great tool to use. It also caters to a variety of topics including Icon For Risk Metrics Performance Indicators Dashboard. Download this PPT design now to present a convincing pitch that not only emphasizes the topic but also showcases your presentation skills.
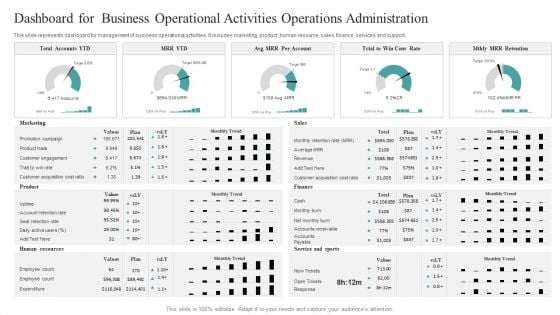
Dashboard For Business Operational Activities Operations Administration Designs PDF
This slide represents dashboard for management of business operational activities. It includes marketing, product, human resource, sales, finance, services and support. Pitch your topic with ease and precision using this Dashboard For Business Operational Activities Operations Administration Designs PDF. This layout presents information on Marketing, Product, Human Resources. It is also available for immediate download and adjustment. So, changes can be made in the color, design, graphics or any other component to create a unique layout.
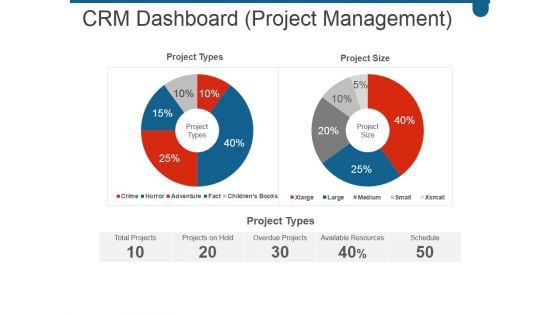
Crm Dashboard Project Management Ppt PowerPoint Presentation Show
This is a crm dashboard project management ppt powerpoint presentation show. This is a two stage process. The stages in this process are total projects, projects on hold, overdue projects, available resources, schedule.

Project Management Dashboard Ppt PowerPoint Presentation Portfolio Portrait
This is a project management dashboard ppt powerpoint presentation portfolio portrait. This is a five stage process. The stages in this process are overall task status, assigned to, budget, pending items, business.
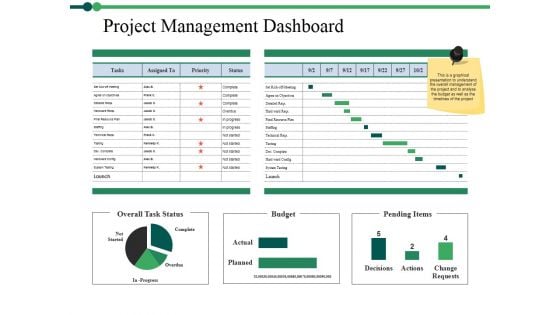
Project Management Dashboard Ppt PowerPoint Presentation Portfolio Objects
This is a project management dashboard ppt powerpoint presentation portfolio objects. This is a three stage process. The stages in this process are complete, overdue, overall task status, budget, pending items.
Project Management Dashboard Finance Ppt PowerPoint Presentation Styles Icons
This is a project management dashboard finance ppt powerpoint presentation styles icons. This is a three stage process. The stages in this process are finance, analysis, business, investment, marketing.

Project Management Report Dashboard Exhibiting Task Progress Diagrams PDF
This slide showcase report dashboard of project management representing task progress status. It covers project name, status, tasks, priority, budget and pending items for the project. Showcasing this set of slides titled Project Management Report Dashboard Exhibiting Task Progress Diagrams PDF. The topics addressed in these templates are Company Website Development, Tasks Status, Budget. All the content presented in this PPT design is completely editable. Download it and make adjustments in color, background, font etc. as per your unique business setting.
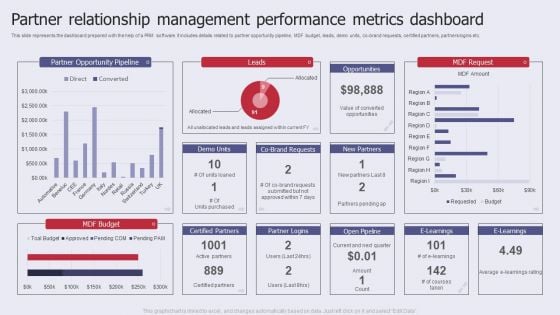
Partner Relationship Management Performance Metrics Dashboard Pictures PDF
This slide represents the dashboard prepared with the help of a PRM software. It includes details related to partner opportunity pipeline, MDF budget, leads, demo units, co brand requests, certified partners, partners logins etc. Showcasing this set of slides titled Partner Relationship Management Performance Metrics Dashboard Pictures PDF. The topics addressed in these templates are Partner Opportunity Pipeline, MDF Budget, Performance Metrics Dashboard. All the content presented in this PPT design is completely editable. Download it and make adjustments in color, background, font etc. as per your unique business setting.
Project Tracking Management And Workload Tracker Dashboard Clipart PDF
The following slide highlights the workload status of various projects to administer cost and timeliness. It includes KPAs such activity, workload status, total cost, task duration etc. Showcasing this set of slides titled Project Tracking Management And Workload Tracker Dashboard Clipart PDF. The topics addressed in these templates are Project Tracking Management, Workload Tracker Dashboard. All the content presented in this PPT design is completely editable. Download it and make adjustments in color, background, font etc. as per your unique business setting.
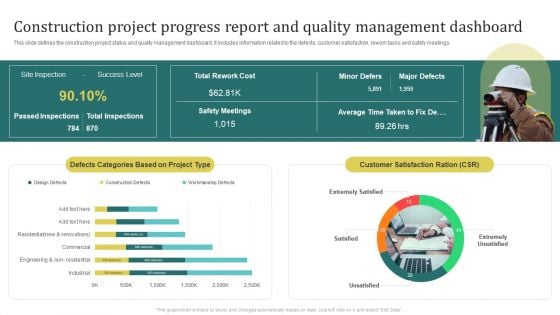
Construction Project Progress Report And Quality Management Dashboard Sample PDF
This slide defines the construction project status and quality management dashboard. It includes information related to the defects, customer satisfaction, rework tasks and safety meetings.Showcasing this set of slides titled Construction Project Progress Report And Quality Management Dashboard Sample PDF. The topics addressed in these templates are Passed Inspections, Customer Satisfaction, Defects Categories. All the content presented in this PPT design is completely editable. Download it and make adjustments in color, background, font etc. as per your unique business setting.
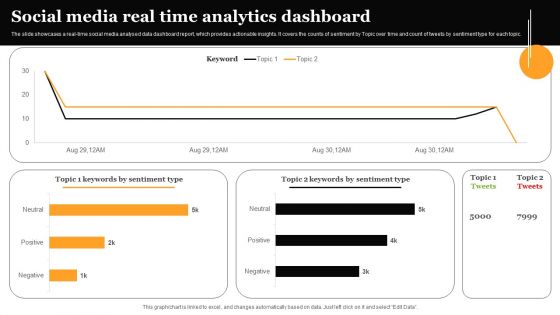
Social Media Real Time Analytics Dashboard Formats PDF
The slide showcases a real-time social media analysed data dashboard report, which provides actionable insights. It covers the counts of sentiment by Topic over time and count of tweets by sentiment type for each topic. Showcasing this set of slides titled Social Media Real Time Analytics Dashboard Formats PDF. The topics addressed in these templates are Social Media Real, Time Analytics, Dashboard. All the content presented in this PPT design is completely editable. Download it and make adjustments in color, background, font etc. as per your unique business setting.
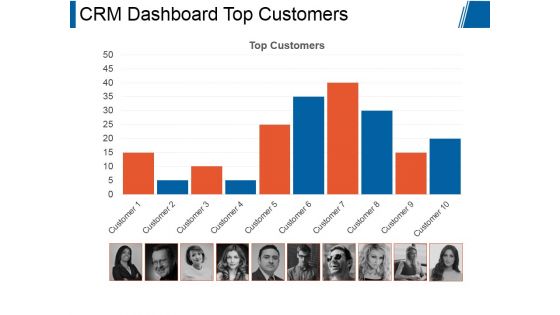
Crm Dashboard Top Customers Ppt PowerPoint Presentation Graphics
This is a crm dashboard top customers ppt powerpoint presentation graphics. This is a ten stage process. The stages in this process are top customers, business, marketing, process, management.

Business Referral Marketing Program Performance Metrics Dashboard Introduction PDF
This slide shows KPI dashboard to effectively track performance of business referral program in order to attract more leads and potential customers to the busines. It includes details related to key metrics such as referral participation rate, referred customers, referral conversion rate and total revenue generated. Showcasing this set of slides titled Business Referral Marketing Program Performance Metrics Dashboard Introduction PDF. The topics addressed in these templates are Referral Participation Rate, Referred Customers, Referral Conversion Rate, Total Revenue Generated. All the content presented in this PPT design is completely editable. Download it and make adjustments in color, background, font etc. as per your unique business setting.
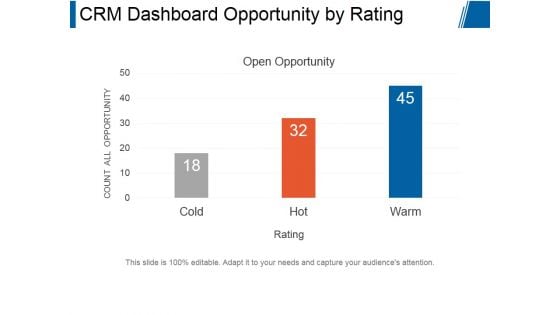
Crm Dashboard Opportunity By Rating Ppt PowerPoint Presentation Backgrounds
This is a crm dashboard opportunity by rating ppt powerpoint presentation backgrounds. This is a three stage process. The stages in this process are open opportunity, count all opportunity, rating.
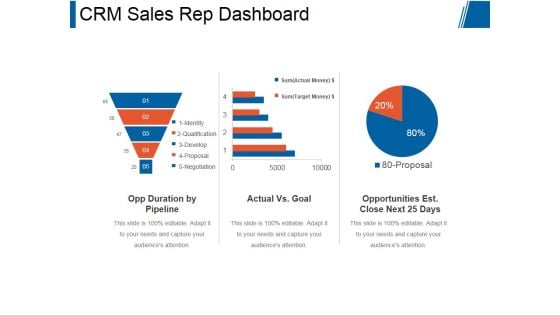
Crm Sales Rep Dashboard Ppt PowerPoint Presentation Influencers
This is a crm sales rep dashboard ppt powerpoint presentation influencers. This is a three stage process. The stages in this process are opp duration by pipeline, actual vs goal, opportunities est close next 25 days.
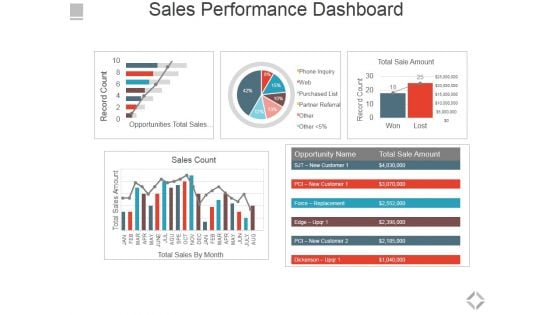
Sales Performance Dashboard Ppt PowerPoint Presentation File Graphics Pictures
This is a sales performance dashboard ppt powerpoint presentation file graphics pictures. This is a five stage process. The stages in this process are total sales by month, sales count, opportunities total sales by probability, total sale amount.
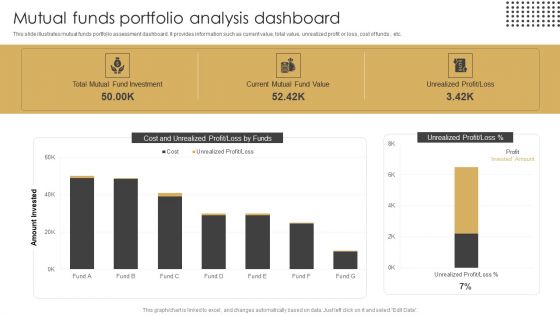
Mutual Funds Portfolio Analysis Dashboard Ppt Layouts Brochure PDF
This slide illustrates mutual funds portfolio assessment dashboard. It provides information such as current value, total value, unrealized profit or loss, cost of funds , etc. Showcasing this set of slides titled Mutual Funds Portfolio Analysis Dashboard Ppt Layouts Brochure PDF. The topics addressed in these templates are Total Mutual, Fund Investment, Current Mutual, Fund Value. All the content presented in this PPT design is completely editable. Download it and make adjustments in color, background, font etc. as per your unique business setting.
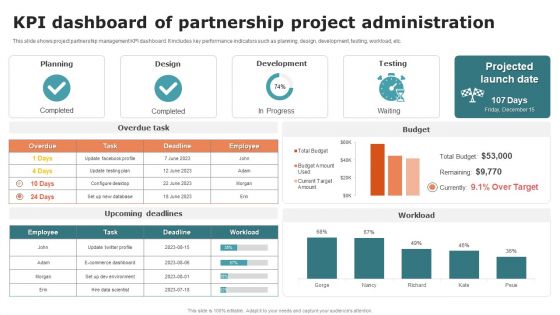
KPI Dashboard Of Partnership Project Administration Ideas PDF
This slide shows project partnership management KPI dashboard. It includes key performance indicators such as planning, design, development, testing, workload, etc. Showcasing this set of slides titled KPI Dashboard Of Partnership Project Administration Ideas PDF. The topics addressed in these templates are Planning, Design, Development. All the content presented in this PPT design is completely editable. Download it and make adjustments in color, background, font etc. as per your unique business setting.
Driver Attention Monitoring Software Dashboard For Automotive Vehicles Icons PDF
This slide covers the dashboard representing the automotive vehicles driver monitoring system. It includes details related to content performance, platform wise volume of mentions, media and website overview. Pitch your topic with ease and precision using this Driver Attention Monitoring Software Dashboard For Automotive Vehicles Icons PDF. This layout presents information on Content Performance, Website Overview, Media Overview. It is also available for immediate download and adjustment. So, changes can be made in the color, design, graphics or any other component to create a unique layout.
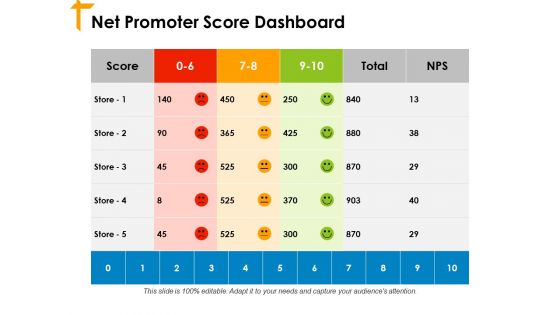
Net Promoter Score Dashboard Ppt PowerPoint Presentation Slides Influencers
This is a net promoter score dashboard ppt powerpoint presentation slides influencers. This is a six stage process. The stages in this process are business, planning, marketing, management, strategy.
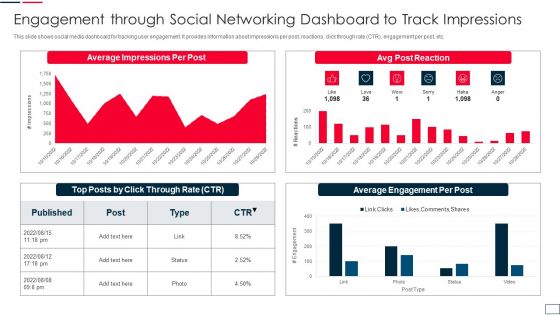
Engagement Through Social Networking Dashboard To Track Impressions Template PDF
This slide shows social media dashboard for tracking user engagement. It provides information about impressions per post, reactions, click through rate CTR, engagement per post, etc. Showcasing this set of slides titled engagement through social networking dashboard to track impressions template pdf. The topics addressed in these templates are engagement through social networking dashboard to track impressions. All the content presented in this PPT design is completely editable. Download it and make adjustments in color, background, font etc. as per your unique business setting.
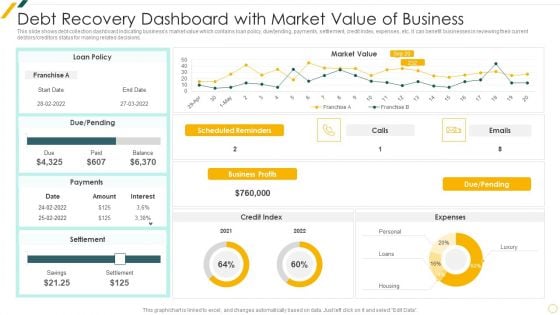
Debt Recovery Dashboard With Market Value Of Business Template PDF
This slide shows debt collection dashboard indicating businesss market value which contains loan policy, due ending, payments, settlement, credit index, expenses, etc. It can benefit businesses in reviewing their current debtors creditors status for making related decisions.Showcasing this set of slides titled Debt Recovery Dashboard With Market Value Of Business Template PDF The topics addressed in these templates are Debt Recovery, Dashboard Market, Value Of Business All the content presented in this PPT design is completely editable. Download it and make adjustments in color, background, font etc. as per your unique business setting.
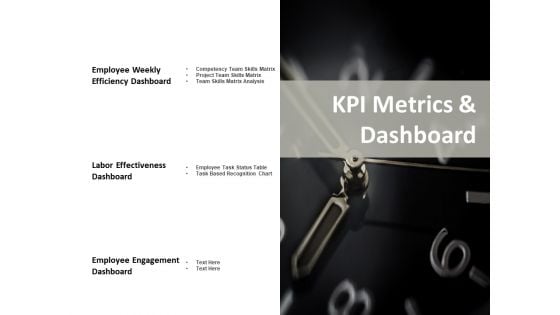
Kpi Metrics And Dashboard Ppt PowerPoint Presentation Show Skills
This is a kpi metrics and dashboard ppt powerpoint presentation show skills. This is a three stage process. The stages in this process are measure, business, management, planning, strategy.
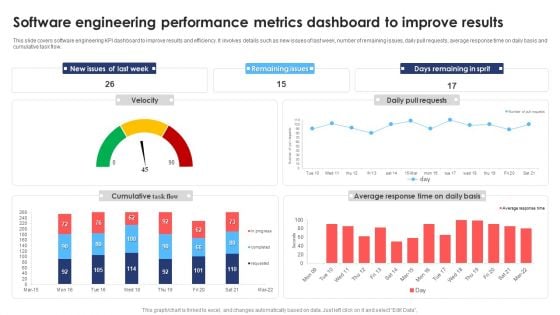
Software Engineering Performance Metrics Dashboard To Improve Results Infographics PDF
This slide covers software engineering KPI dashboard to improve results and efficiency. It involves details such as new issues of last week, number of remaining issues, daily pull requests, average response time on daily basis and cumulative task flow. Pitch your topic with ease and precision using this Software Engineering Performance Metrics Dashboard To Improve Results Infographics PDF. This layout presents information on Software Engineering Performance, Metrics Dashboard Improve Results. It is also available for immediate download and adjustment. So, changes can be made in the color, design, graphics or any other component to create a unique layout.
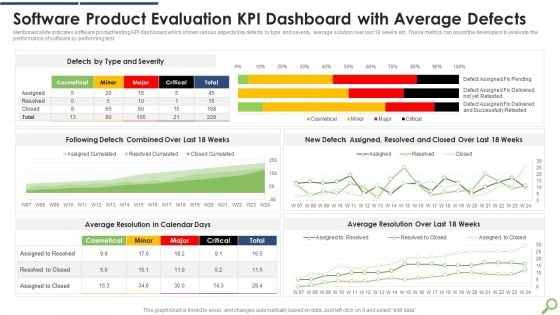
Software Product Evaluation KPI Dashboard With Average Defects Infographics PDF
Mentioned slide indicates software product testing KPI dashboard which shows various aspects like defects by type and severity, average solution over last 18 weeks etc. These metrics can assist the developers to evaluate the performance of software by performing test.Showcasing this set of slides titled Software Product Evaluation KPI Dashboard With Average Defects Infographics PDF The topics addressed in these templates are Software Product, Evaluation Dashboard, Average Defects All the content presented in this PPT design is completely editable. Download it and make adjustments in color, background, font etc. as per your unique business setting.
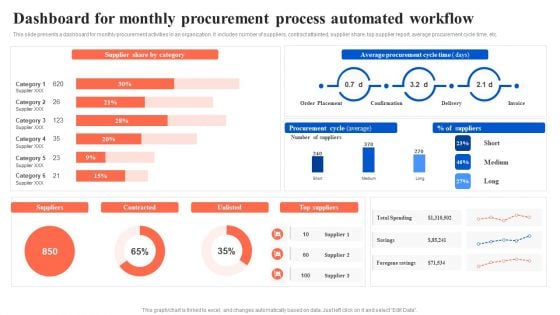
Dashboard For Monthly Procurement Process Automated Workflow Microsoft PDF
This slide presents a dashboard for monthly procurement activities in an organization. It includes number of suppliers, contract attainted, supplier share, top supplier report, average procurement cycle time, etc. Presenting this PowerPoint presentation, titled Dashboard For Monthly Procurement Process Automated Workflow Microsoft PDF, with topics curated by our researchers after extensive research. This editable presentation is available for immediate download and provides attractive features when used. Download now and captivate your audience. Presenting this Dashboard For Monthly Procurement Process Automated Workflow Microsoft PDF. Our researchers have carefully researched and created these slides with all aspects taken into consideration. This is a completely customizable Dashboard For Monthly Procurement Process Automated Workflow Microsoft PDF that is available for immediate downloading. Download now and make an impact on your audience. Highlight the attractive features available with our PPTs.
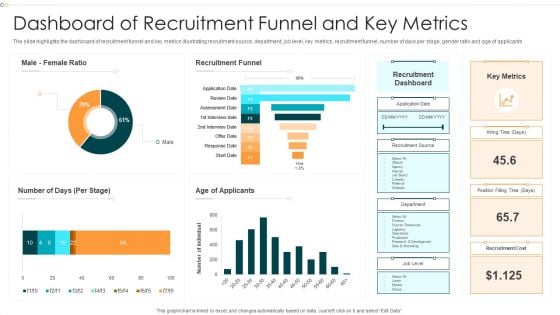
Dashboard Of Recruitment Funnel And Key Metrics Information PDF
The slide highlights the dashboard of recruitment funnel and key metrics illustrating recruitment source, department, job level, key metrics, recruitment funnel, number of days per stage, gender ratio and age of applicants.Pitch your topic with ease and precision using this Dashboard Of Recruitment Funnel And Key Metrics Information PDF This layout presents information on Recruitment Funnel, Recruitment Dashboard, Recruitment Cost It is also available for immediate download and adjustment. So, changes can be made in the color, design, graphics or any other component to create a unique layout.
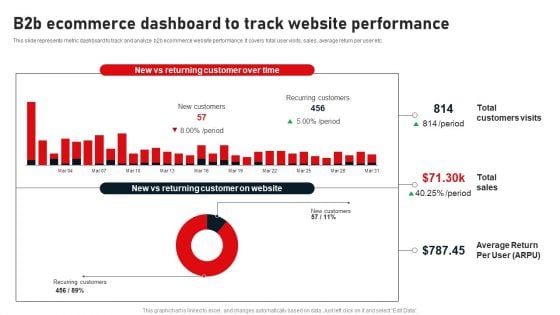
B2B Ecommerce Dashboard To Track Website Performance Designs PDF
This slide represents metric dashboard to track and analyze b2b ecommerce website performance. It covers total user visits, sales, average return per user etc. Presenting this PowerPoint presentation, titled B2B Ecommerce Dashboard To Track Website Performance Designs PDF, with topics curated by our researchers after extensive research. This editable presentation is available for immediate download and provides attractive features when used. Download now and captivate your audience. Presenting this B2B Ecommerce Dashboard To Track Website Performance Designs PDF. Our researchers have carefully researched and created these slides with all aspects taken into consideration. This is a completely customizable B2B Ecommerce Dashboard To Track Website Performance Designs PDF that is available for immediate downloading. Download now and make an impact on your audience. Highlight the attractive features available with our PPTs.
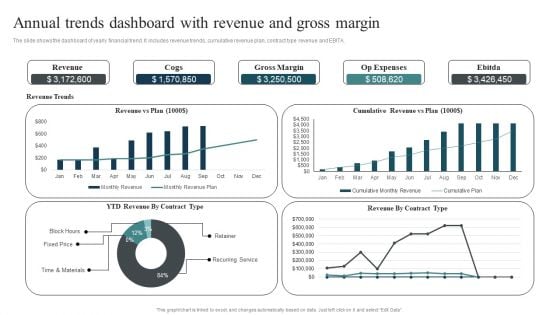
Annual Trends Dashboard With Revenue And Gross Margin Designs PDF
The slide shows the dashboard of yearly financial trend. It includes revenue trends, cumulative revenue plan, contract type revenue and EBITA. Showcasing this set of slides titled Annual Trends Dashboard With Revenue And Gross Margin Designs PDF. The topics addressed in these templates are Cumulative Revenue, Time Materials, Recurring Service. All the content presented in this PPT design is completely editable. Download it and make adjustments in color, background, font etc. as per your unique business setting.
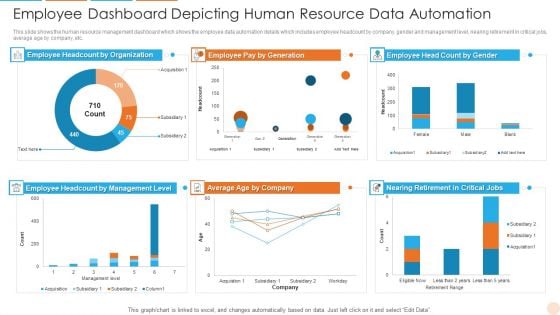
Employee Dashboard Depicting Human Resource Data Automation Professional PDF
This slide shows the human resource management dashboard which shows the employee data automation details which includes employee headcount by company, gender and management level, nearing retirement in critical jobs, average age by company, etc. Showcasing this set of slides titled Employee Dashboard Depicting Human Resource Data Automation Professional PDF. The topics addressed in these templates are Employee Dashboard Depicting Human Resource Data Automation. All the content presented in this PPT design is completely editable. Download it and make adjustments in color, background, font etc. as per your unique business setting.
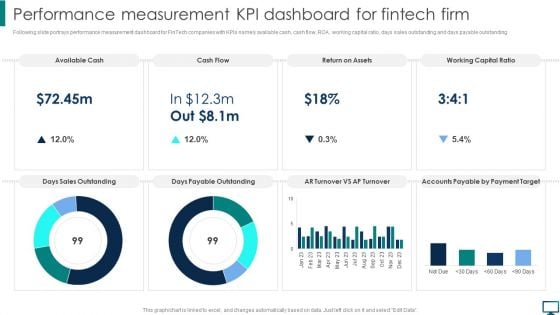
Performance Measurement KPI Dashboard For Fintech Firm Topics PDF
Following slide portrays performance measurement dashboard for FinTech companies with KPIs namely available cash, cash flow, ROA, working capital ratio, days sales outstanding and days payable outstanding. Create an editable Performance Measurement KPI Dashboard For Fintech Firm Topics PDF that communicates your idea and engages your audience. Whether you are presenting a business or an educational presentation, pre designed presentation templates help save time. Performance Measurement KPI Dashboard For Fintech Firm Topics PDF is highly customizable and very easy to edit, covering many different styles from creative to business presentations. Slidegeeks has creative team members who have crafted amazing templates. So, go and get them without any delay.
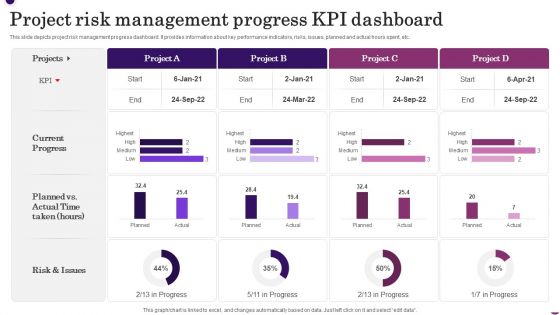
Project Risk Management Progress KPI Dashboard Template PDF
This slide depicts project risk management progress dashboard. It provides information about key performance indicators, risks, issues, planned and actual hours spent, etc. Pitch your topic with ease and precision using this Project Risk Management Progress KPI Dashboard Template PDF. This layout presents information on Current Progress, Risk And Issues. It is also available for immediate download and adjustment. So, changes can be made in the color, design, graphics or any other component to create a unique layout.
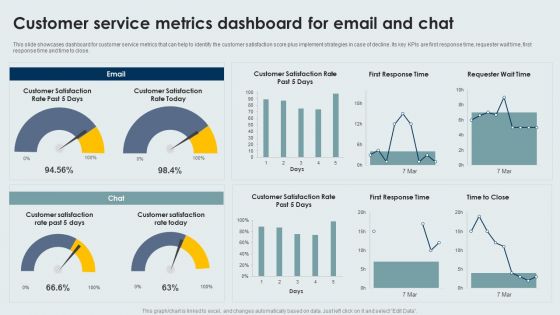
Customer Service Metrics Dashboard For Email And Chat Infographics PDF
This slide showcases dashboard for customer service metrics that can help to identify the customer satisfaction score plus implement strategies in case of decline. Its key KPIs are first response time, requester wait time, first response time and time to close. Pitch your topic with ease and precision using this Customer Service Metrics Dashboard For Email And Chat Infographics PDF. This layout presents information on Customer Service, Metrics Dashboard, Email And Chat. It is also available for immediate download and adjustment. So, changes can be made in the color, design, graphics or any other component to create a unique layout.
Cloud Platform Dashboard For Tracking Project Team Activities Microsoft PDF
The following slide depicts project team task tracking cloud dashboard. It provides information about hours worked, projects worked, time spent, daily limit, product design, weekly activity, etc. Create an editable Cloud Platform Dashboard For Tracking Project Team Activities Microsoft PDF that communicates your idea and engages your audience. Whether you are presenting a business or an educational presentation, pre-designed presentation templates help save time. Cloud Platform Dashboard For Tracking Project Team Activities Microsoft PDF is highly customizable and very easy to edit, covering many different styles from creative to business presentations. Slidegeeks has creative team members who have crafted amazing templates. So, go and get them without any delay.
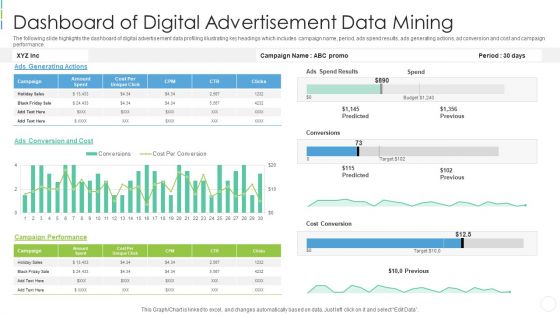
Dashboard Of Digital Advertisement Data Mining Professional PDF
The following slide highlights the dashboard of digital advertisement data profiling illustrating key headings which includes campaign name, period, ads spend results, ads generating actions, ad conversion and cost and campaign performance. Pitch your topic with ease and precision using this dashboard of digital advertisement data mining professional pdf . This layout presents information on dashboard of digital advertisement data mining . It is also available for immediate download and adjustment. So, changes can be made in the color, design, graphics or any other component to create a unique layout.
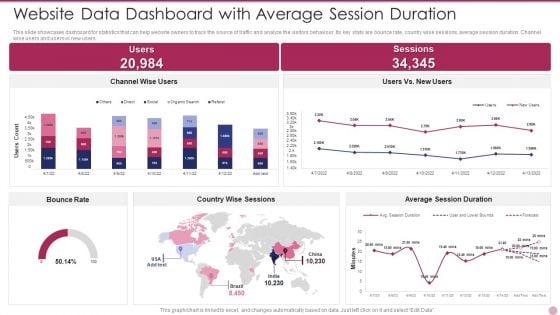
Website Data Dashboard With Average Session Duration Ideas PDF
This slide showcases dashboard for statistics that can help website owners to track the source of traffic and analyze the visitors behaviour. Its key stats are bounce rate, country wise sessions, average session duration. Channel wise users and users vs new users. Pitch your topic with ease and precision using this Website Data Dashboard With Average Session Duration Ideas PDF. This layout presents information on Website Data Dashboard With Average Session Duration. It is also available for immediate download and adjustment. So, changes can be made in the color, design, graphics or any other component to create a unique layout.
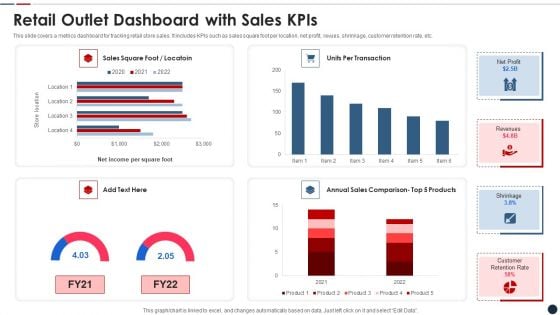
Retail Outlet Dashboard With Sales Kpis Clipart PDF
This slide covers a metrics dashboard for tracking retail store sales. It includes KPIs such as sales square foot per location, net profit, revues, shrinkage, customer retention rate, etc. Pitch your topic with ease and precision using this retail outlet dashboard with sales kpis clipart pdf This layout presents information on Retail outlet dashboard with sales kpis It is also available for immediate download and adjustment. So, changes can be made in the color, design, graphics or any other component to create a unique layout.
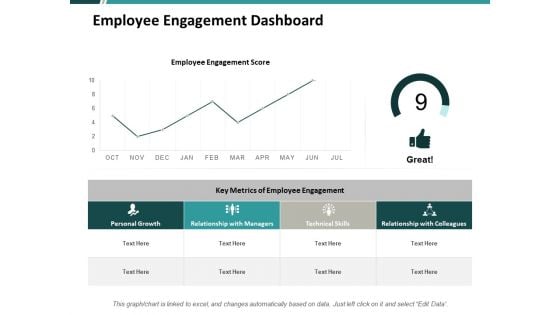
Employee Engagement Dashboard Ppt PowerPoint Presentation Professional File Formats
This is a employee engagement dashboard ppt powerpoint presentation professional file formats. This is a four stage process. The stages in this process are finance, marketing, management, investment, analysis.

Blockchain Based Applicant Status Monitoring Dashboard Graphics PDF
The slide highlights the application status monitoring and recruitment dashboard depicting requisition cancellation rate, requisition authorization time, active jobs, requisition and candidates for review. Create an editable Blockchain Based Applicant Status Monitoring Dashboard Graphics PDF that communicates your idea and engages your audience. Whether you are presenting a business or an educational presentation, pre designed presentation templates help save time. Blockchain Based Applicant Status Monitoring Dashboard Graphics PDF is highly customizable and very easy to edit, covering many different styles from creative to business presentations. Slidegeeks has creative team members who have crafted amazing templates. So, go and get them without any delay.
Optimize Brand Valuation Product Branding Performance Tracking Dashboard Background PDF
This slide provides information regarding product branding performance tracking dashboard in terms of revenues, new customers, customer satisfaction rate. Create an editable Optimize Brand Valuation Product Branding Performance Tracking Dashboard Background PDF that communicates your idea and engages your audience. Whether you are presenting a business or an educational presentation, pre-designed presentation templates help save time. Optimize Brand Valuation Product Branding Performance Tracking Dashboard Background PDF is highly customizable and very easy to edit, covering many different styles from creative to business presentations. Slidegeeks has creative team members who have crafted amazing templates. So, go and get them without any delay.


 Continue with Email

 Home
Home


