Finance Executive Summary

Stock Photo Red And White Arrows With Leadership PowerPoint Slide
This innovative image has design of progressive arrow crossing the wall and leading other arrows. Use this image in business presentations to display concepts like leadership, success etc. Highlight the results of you thought process using this image.
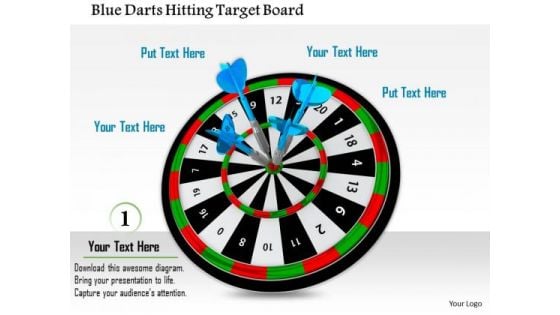
Stock Photo Blue Darts Hitting Target Board PowerPoint Slide
Explain the concept of target achievement with this innovative image slide. This slide contains the graphic of blue darts hitting the target board. Make an exclusive presentation for your viewers with this slide design.
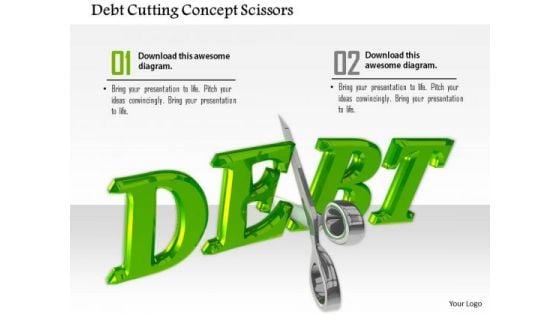
Stock Photo Debt Cutting Concept Scissors PowerPoint Slide
This image slide is designed with scissors cutting the debt word. This image contains the graphic debt cutting scissors depicting how to reduce your debt. This image is suitable for business and marketing related presentations.
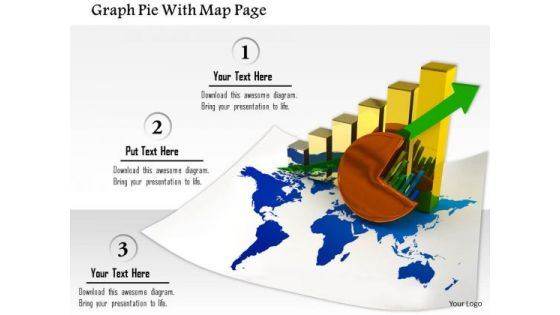
Stock Photo Graph Pie With Map Page PowerPoint Slide
This image slide contains business charts on world map. This image is designed with bar graph and pie chart on world map depicting global economy. Use this image slide to represent financial growth in any business presentation.
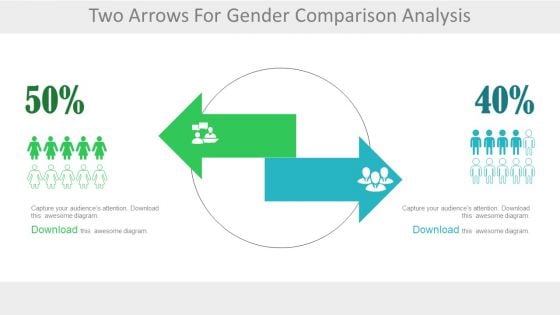
Two Arrows For Male Female Ratio Analysis Powerpoint Slides
Use this professionally created PowerPoint template to create the perfect slide to educate your audience about comparisons between choices and opinions of different genders. The slide can be used to denote the sex ratio or the changes occurring in the same. The 2 colored arrows can be used to refer to the 2 genders or even 2 teams or groups. This slide can be effectively used in corporate or business presentations to demonstrate the conversion of probable customers to sale. Other concepts like brain drain or brand preference or people making different choices can also be demonstrated using this template. A human resource manager can use this slide to demonstrate the transfer of employees to other locations or companies.
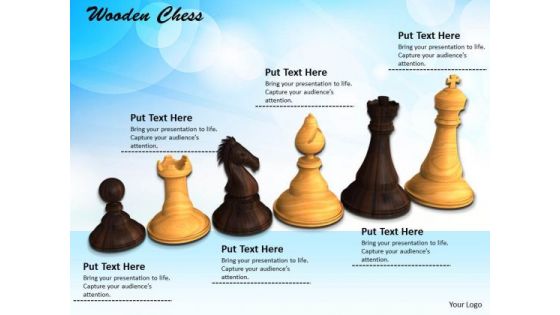
Stock Photo White Black Pieces Of Chess Game PowerPoint Slide
This image slide displays dark brown and light brown chess pieces. This image slide has been designed with graphic of wooden chess pawns on blue background. Use this image slide, in your presentations to express views on leadership, teamwork, strategy and challenges. This image slide may also be used in game presentations. This image slide will enhance the quality of your presentations.
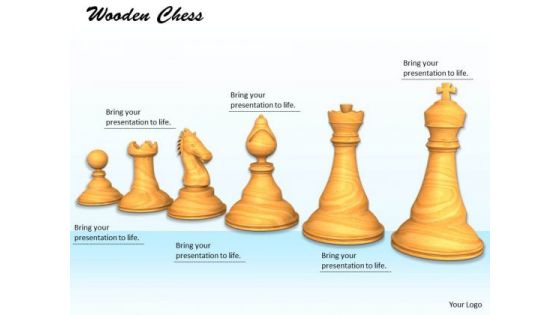
Stock Photo White Pieces Of Chess Game PowerPoint Slide
This image slide displays light brown color chess pieces. This image slide has been designed with graphic of wooden chess pawns on blue shaded background. Use this image slide, in your presentations to express views on leadership, teamwork, strategy and challenges. This image slide may also be used in game presentations. This image slide will enhance the quality of your presentations.
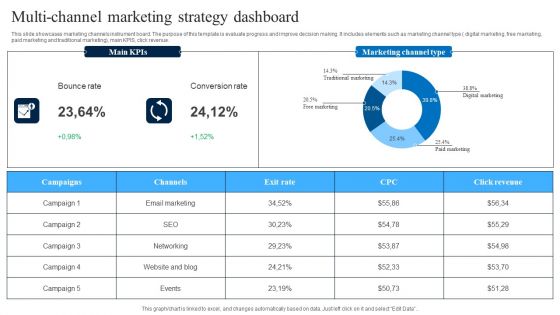
Multi Channel Marketing Strategy Dashboard Slides PDF
This slide showcases marketing channels instrument board. The purpose of this template is evaluate progress and improve decision making. It includes elements such as marketing channel type digital marketing, free marketing, paid marketing and traditional marketing, main KPIS, click revenue. Pitch your topic with ease and precision using this Multi Channel Marketing Strategy Dashboard Slides PDF. This layout presents information on Bounce Rate, Conversion Rate, Marketing Channel Type. It is also available for immediate download and adjustment. So, changes can be made in the color, design, graphics or any other component to create a unique layout.
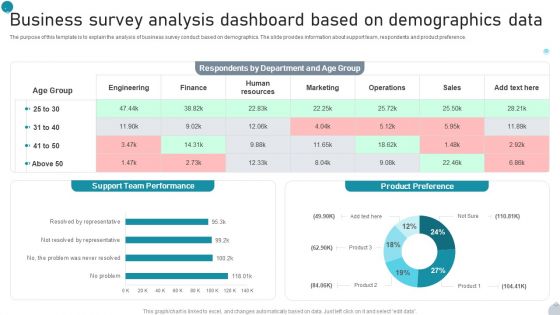
Business Survey Analysis Dashboard Based On Demographics Data Microsoft PDF
The purpose of this template is to explain the analysis of business survey conduct based on demographics. The slide provides information about support team, respondents and product preference. Pitch your topic with ease and precision using this Business Survey Analysis Dashboard Based On Demographics Data Microsoft PDF. This layout presents information on Support, Team Performance, Product Preference It is also available for immediate download and adjustment. So, changes can be made in the color, design, graphics or any other component to create a unique layout.
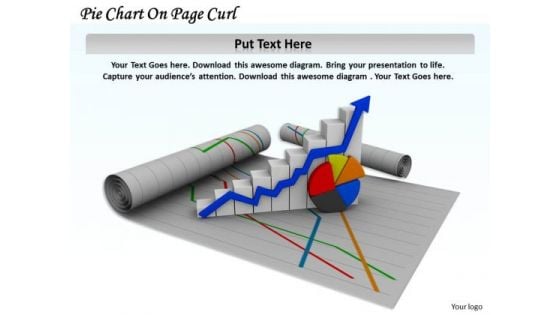
Stock Photo Pie Chart On Page Curl Arrow PowerPoint Slide
This image slide displays pie chart and growth bar graph on page curl. Use this image slide, in your presentations to express views on progress, growth and achievements. This image slide may also be used to depict strategic business planning. Make professional presentations using this image slide.
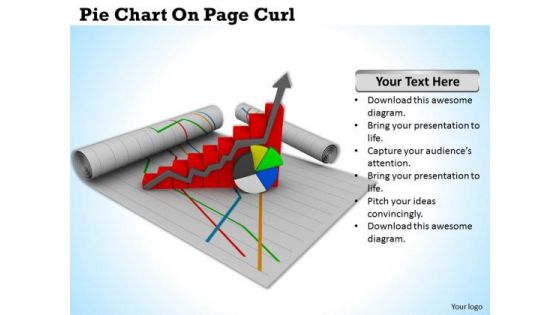
Stock Photo Pie Chart On Page Curl PowerPoint Slide
This image slide displays pie chart and growth bar graph on page curl on blue shaded background. Use this image slide, in your presentations to express views on progress, growth and achievements. This image slide may also be used to depict strategic business planning. Make professional presentations using this image slide.

Protect Business From Financial Crisis PowerPoint Templates Ppt Backgrounds For Slides 0513
Plan your storyboard with our Protect Business From Financial Crisis PowerPoint Templates Umbrellas Backgrounds For Slide. Give an outline to the solutions you have. Give power to your elbow with our Protect Business From Financial Crisis PowerPoint Templates Ppt Backgrounds For Slides 0513 PowerPoint Templates. Get that extra information you need. Drum up support with our Arrows PowerPoint Templates. They will come in droves to stand by you. Feel the ' chi ' with our Protect Business From Financial Crisis PowerPoint Templates Ppt Backgrounds For Slides 0513. Your inner energies will be on the rise.

Run Fast And Win The Race PowerPoint Templates Ppt Backgrounds For Slides 0613
Touch base with our Run Fast And Win The Race PowerPoint Templates PPT Backgrounds For Slides. Review your growth with your audience. Take a deep dive with our Competition PowerPoint Templates. Get into the nitty-gritty of it all. Plan your storyboard with our People PowerPoint Templates. Give an outline to the solutions you have. Give the gift of career growth with our Run Fast And Win The Race PowerPoint Templates Ppt Backgrounds For Slides 0613. Dont waste time struggling with PowerPoint. Let us do it for you.
Make A Good Home With Honest Effort PowerPoint Templates Ppt Backgrounds For Slides 0613
Touch base with our Make A Good Home With Honest Effort PowerPoint Templates PPT Backgrounds For Slides. Review your growth with your audience. Take a deep dive with our Puzzles or Jigsaws PowerPoint Templates. Get into the nitty-gritty of it all. Plan your storyboard with our Real Estate PowerPoint Templates. Give an outline to the solutions you have. Give a good account with our Make A Good Home With Honest Effort PowerPoint Templates Ppt Backgrounds For Slides 0613. Put your views across with clarity.
PowerPoint Slide Showing Sales Tag Diagram
PowerPoint Slide showing sales Tag diagram-These high quality, editable pre-designed powerpoint slides have been carefully created by our professional team to help you impress your audience. Each graphic in every slide is vector based and is 100% editable in powerpoint. Each and every property of any slide - color, size, shading etc can be modified to build an effective powerpoint presentation. Use these slides to convey complex business concepts in a simplified manner. Any text can be entered at any point in the powerpoint slide. Simply DOWNLOAD, TYPE and PRESENT! Brilliant backdrops are the essence of our PowerPoint Slide Showing Sales Tag Diagram. Guaranteed to impress your audience.
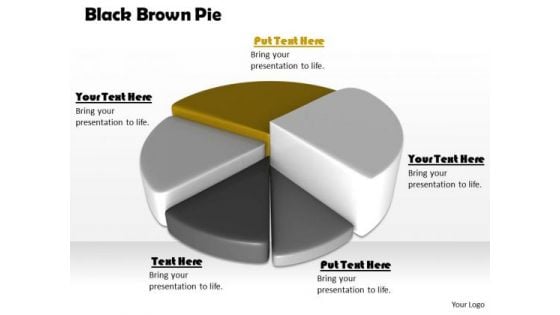
Stock Photo Black Brown Pie Chart For Business Result PowerPoint Slide
This high quality image is designed with pie chart. Use this image to make business reports. Use this outstanding image in presentations relating to data analysis and reports. Go ahead and add charm to your presentations.
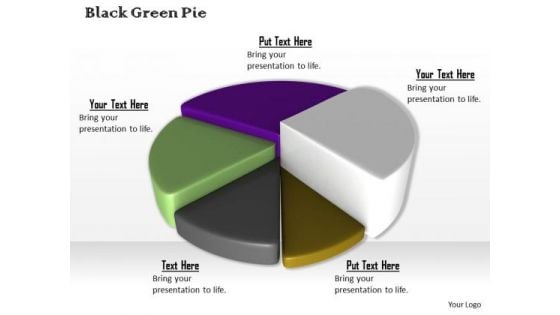
Stock Photo Colorful 3d Pie Chart For Business Result PowerPoint Slide
This high quality image is designed with pie chart. Use this image to make business reports. Use this outstanding image in presentations relating to data analysis and reports. Go ahead and add charm to your presentations.
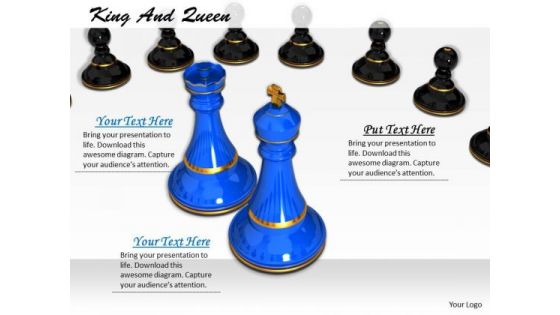
Stock Photo Blue Chess King And Queen With Pawns PowerPoint Slide
This image has been designed with graphics of blue chess king and queen with pawns. You can download this image to make presentations on business strategy and chess strategies. This image offers an excellent background to build professional presentations.
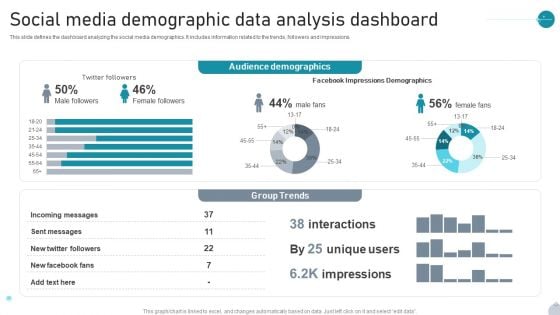
Social Media Demographic Data Analysis Dashboard Infographics PDF
This slide defines the dashboard analyzing the social media demographics. It includes information related to the trends, followers and impressions. Pitch your topic with ease and precision using this Social Media Demographic Data Analysis Dashboard Infographics PDF. This layout presents information on Audience Demographics, Group Trends, Impressions Demographics It is also available for immediate download and adjustment. So, changes can be made in the color, design, graphics or any other component to create a unique layout.
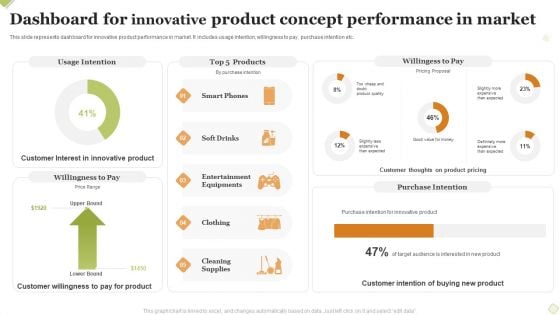
Dashboard For Innovative Product Concept Performance In Market Formats PDF
This slide represents dashboard for innovative product performance in market. It includes usage intention, willingness to pay, purchase intention etc. Pitch your topic with ease and precision using this Dashboard For Innovative Product Concept Performance In Market Formats PDF This layout presents information on Usage Intention, Willingess To Pay, Purchase Intention . It is also available for immediate download and adjustment. So, changes can be made in the color, design, graphics or any other component to create a unique layout.
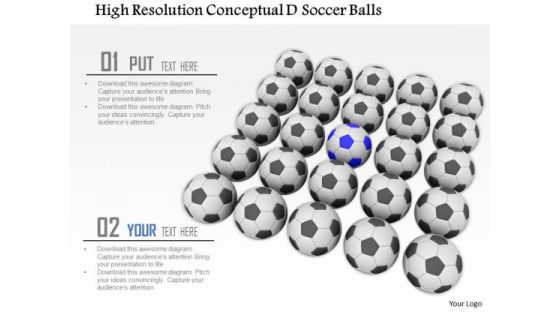
0814 Conceptual Image Of Soccer Balls On White Background Image Graphics For PowerPoint
Above image has a design of soccer balls with One Standing Out. This conceptual soccer balls image designed to portray concepts of leadership or differentiation. Add this image to your presentation to visually support your content and to transmit your ideas to target audience.
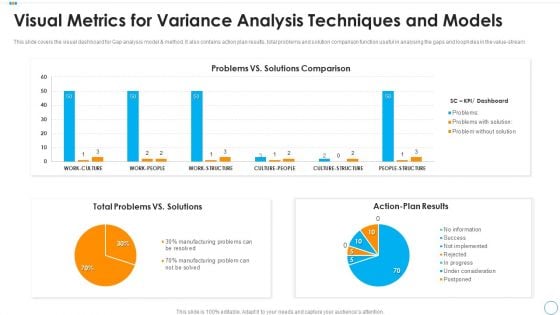
Visual Metrics For Variance Analysis Techniques And Models Mockup PDF
This slide covers the visual dashboard for Gap analysis model and method. It also contains action plan results, total problems and solution comparison function useful in analysing the gaps and loopholes in the value stream. Showcasing this set of slides titled visual metrics for variance analysis techniques and models mockup pdf. The topics addressed in these templates are total problems vs solutions, action plan results, problems vs solutions comparison. All the content presented in this PPT design is completely editable. Download it and make adjustments in color, background, font etc. as per your unique business setting.
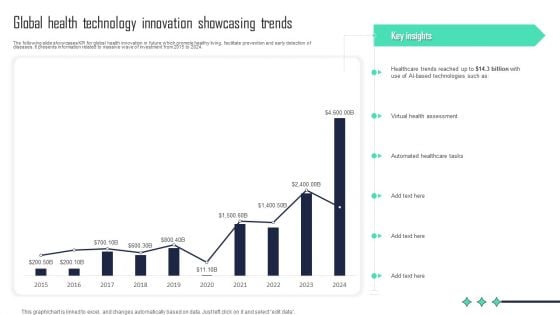
Global Health Technology Innovation Showcasing Trends Formats PDF
The following slide showcases KPI for global health innovation in future which promote healthy living, facilitate prevention and early detection of diseases. It presents information related to massive wave of investment from 2015 to 2024. Showcasing this set of slides titled Global Health Technology Innovation Showcasing Trends Formats PDF. The topics addressed in these templates are Virtual Health Assessment, Automated Healthcare Tasks, Key Insights. All the content presented in this PPT design is completely editable. Download it and make adjustments in color, background, font etc. as per your unique business setting.

0814 1 Label Ribbon Batch Image For Championship Image Graphics For PowerPoint
This business image has been designed with number 1 label ribbon batch. This image shows the concept of championship and winner. Use this image in your sports and tournament related topics. Make awesome presentation with this innovative image.

0814 2 Label Ribbon Batch Image For Championship Image Graphics For PowerPoint
This business image has been designed with number2 label ribbon batch. This image shows the concept of championship and winner. Use this image in your sports and tournament related topics. Make awesome presentation with this innovative image.
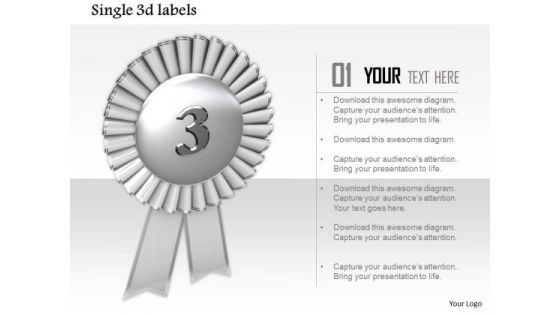
0814 3 Label Ribbon Batch For Championship Image Graphics For PowerPoint
Define the concepts of Sports, Award and winners with this unique image. This image has been designed with graphic of ribbon batch with number 3 label. Make a professional presentation for your audience with this unique image.
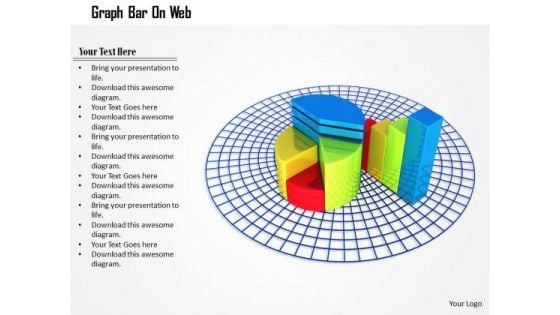
Stock Photo Pie Chart And Bar Graph On Web PowerPoint Slide
This image is designed with pie chart and bar graph on web. Use this diagram to explain your strategy to co-ordinate activities. Deliver amazing presentations to mesmerize your audience.
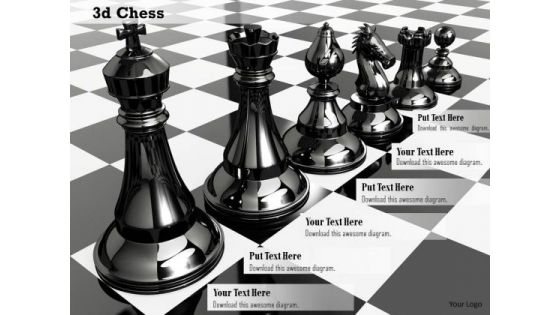
Stock Photo Set Of Chess Pieces On Chess Board PowerPoint Slide
This image contains the graphic of chess pieces on chess board. This image is designed to depict chess strategies. Use this image in business presentations to display team strategy.
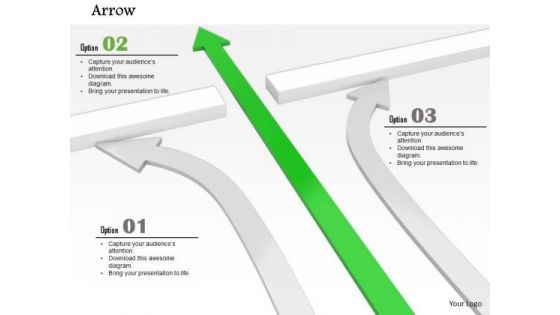
Stock Photo Green Arrow Leading And Breaking Wall Leadership Concept PowerPoint Slide
This innovative image has design of progressive arrow crossing the wall and leading other arrows. Use this image in business presentations to display concepts like leadership, success etc. Highlight the results of you thought process using this image.
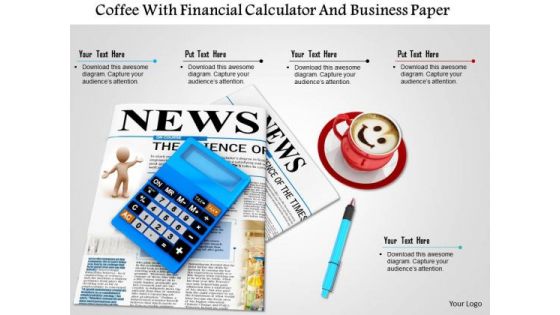
Stock Photo Coffee With Financial Calculator And Business Paper PowerPoint Slide
This image slide is designed with graphic of financial calculator with coffee cup and news paper. This image explains the concept of workplace and coffee break with its suitable graphics. Use this image to make business presentations.

Stock Photo Video Marketing Text On Blue Key PowerPoint Slide
This image slide displays blue color video marketing key with video camera icon. This image slide has been designed with graphic of computer keyboard with video marketing key. Use this image slide in technology, marketing, sales and business. This image slide make your presentations outshine.
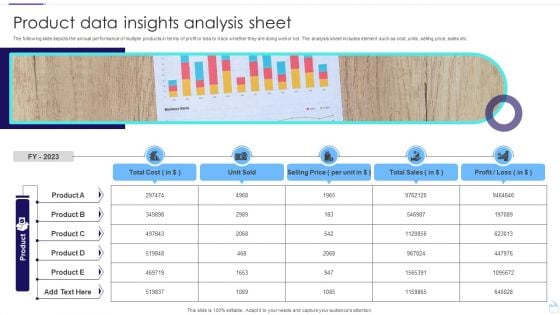
Product Data Insights Analysis Sheet Infographics PDF
The following slide depicts the annual performance of multiple products in terms of profit or loss to track whether they are doing well or not. The analysis sheet includes element such as cost, units, selling price, sales etc. Pitch your topic with ease and precision using this Product Data Insights Analysis Sheet Infographics PDF. This layout presents information on Unit Sold, Selling Price, Total Sales. It is also available for immediate download and adjustment. So, changes can be made in the color, design, graphics or any other component to create a unique layout.
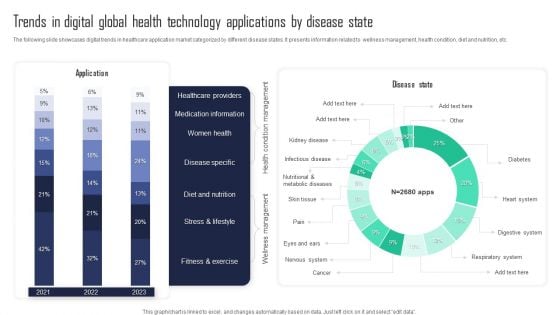
Trends In Digital Global Health Technology Applications By Disease State Pictures PDF
The following slide showcases digital trends in healthcare application market categorized by different disease states. It presents information related to wellness management, health condition, diet and nutrition, etc. Showcasing this set of slides titled Trends In Digital Global Health Technology Applications By Disease State Pictures PDF. The topics addressed in these templates are Healthcare Providers, Medication Information, Women Health. All the content presented in this PPT design is completely editable. Download it and make adjustments in color, background, font etc. as per your unique business setting.
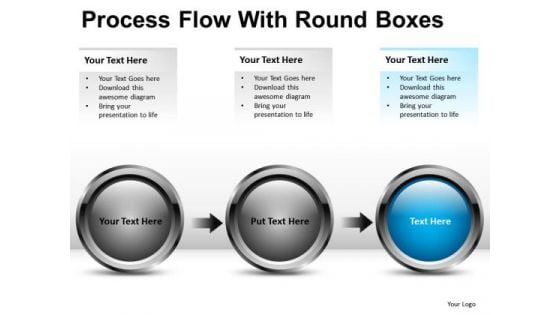
Process Diagram Chart In PowerPoint With 3 Stages
Process Diagram Chart in Powerpoint with 3 Stages-These high quality, editable pre-designed powerpoint slides have been carefully created by our professional team to help you impress your audience. Each graphic in every slide is vector based and is 100% editable in powerpoint. Each and every property of any slide - color, size, shading etc can be modified to build an effective powerpoint presentation. Use these slides to convey complex business concepts in a simplified manner. Any text can be entered at any point in the powerpoint slide. Simply DOWNLOAD, TYPE and PRESENT! Put your best foot forward with our Process Diagram Chart In PowerPoint With 3 Stages. You will appear that much better.

Stock Photo Red Arrow Crossing From Center Of The Wall PowerPoint Slide
This image slide displays wall and arrows graphic. This image slide has been designed with graphic of red arrow crossing the wall. This image slide may be used to depict clearing the hurdle and reaching the target. This image slide may be used to express views on competition, success and goal achievement in your presentations. This image slide will give edge to your presentations.
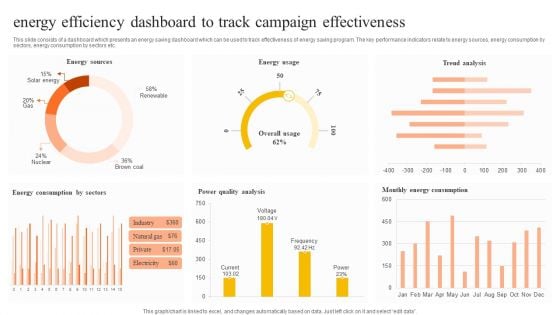
Energy Efficiency Dashboard To Track Campaign Effectiveness Pictures PDF
This slide consists of a dashboard which presents an energy saving dashboard which can be used to track effectiveness of energy saving program. The key performance indicators relate to energy sources, energy consumption by sectors, energy consumption by sectors etc. Pitch your topic with ease and precision using this Energy Efficiency Dashboard To Track Campaign Effectiveness Pictures PDF. This layout presents information on Energy Sources, Energy Usage, Trend Analysis. It is also available for immediate download and adjustment. So, changes can be made in the color, design, graphics or any other component to create a unique layout.
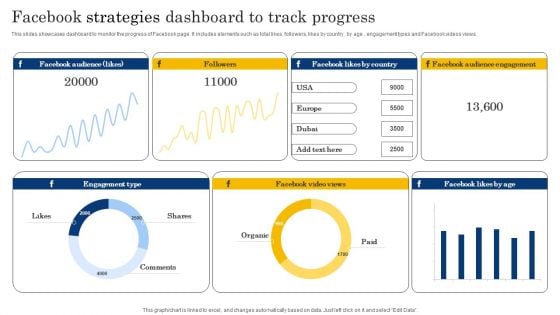
Facebook Strategies Dashboard To Track Progress Structure PDF
This slides showcases dashboard to monitor the progress of Facebook page. It includes elements such as total likes, followers, likes by country, by age , engagement types and Facebook videos views. Pitch your topic with ease and precision using this Facebook Strategies Dashboard To Track Progress Structure PDF. This layout presents information on Followers, Engagement Type, Shares. It is also available for immediate download and adjustment. So, changes can be made in the color, design, graphics or any other component to create a unique layout.
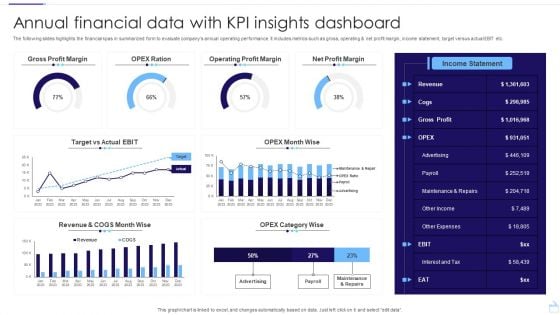
Annual Financial Data With KPI Insights Dashboard Structure PDF
The following slides highlights the financial kpas in summarized form to evaluate companys annual operating performance. It includes metrics such as gross, operating and net profit margin, income statement, target versus actual EBIT etc. Pitch your topic with ease and precision using this Annual Financial Data With KPI Insights Dashboard Structure PDF. This layout presents information on Gross Profit Margin, Operating Profit Margin, Net Profit Margin. It is also available for immediate download and adjustment. So, changes can be made in the color, design, graphics or any other component to create a unique layout.
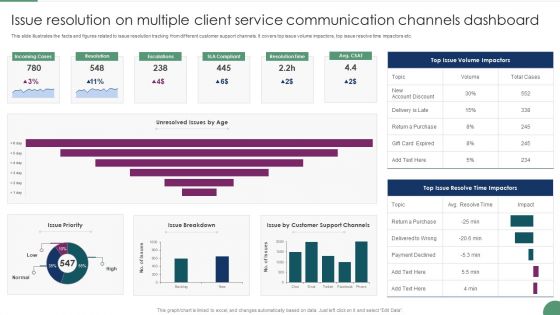
Issue Resolution On Multiple Client Service Communication Channels Dashboard Microsoft PDF
This slide illustrates the facts and figures related to issue resolution tracking from different customer support channels. It covers top issue volume impactors, top issue resolve time impactors etc. Pitch your topic with ease and precision using this Issue Resolution On Multiple Client Service Communication Channels Dashboard Microsoft PDF This layout presents information on Incoming Cases, Resolution, Escalations. It is also available for immediate download and adjustment. So, changes can be made in the color, design, graphics or any other component to create a unique layout.
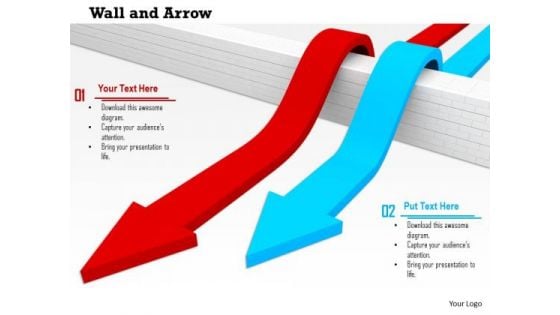
Stock Photo Red And Blue Arrow Jumping Over The Wall PowerPoint Slide
This image slide displays wall and arrows graphic. This image slide has been designed with graphic of red and blue arrow jumping the wall. This image slide may be used to depict passing the hurdle and reaching the target. This image slide may be used to express views on competition, success and goal achievement in your presentations. This image slide will give edge to your presentations.
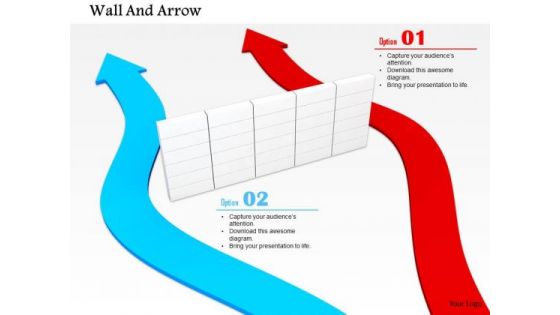
Stock Photo Red And Blue Arrow Passing Besides The Wall PowerPoint Slide
This image slide displays wall and arrows graphic. This image slide has been designed with graphic of red and blue arrow passing besides the wall. This image slide may be used to depict passing the hurdle and reaching the target. This image slide may be used to express views on competition, success and goal achievement in your presentations. This image slide will give edge to your presentations.

Stock Photo Red Arrow Achieves Success Breaking The Hurdle Wall PowerPoint Slide
This image slide displays wall and arrows graphic. This image slide has been designed with graphic of white arrows and red arrow breaking the wall. This image slide may be used to depict clearing the hurdle and reaching the target. This image slide may be used to express views on competition, success and goal achievement in your presentations. This image slide will give edge to your presentations.

Stock Photo Red Arrow Leads The Way And Achieves Success PowerPoint Slide
This image slide displays wall and arrows graphic. This image slide has been designed with graphic of white arrows and red arrow jumping the wall. This image slide may be used to depict passing the hurdle and reaching the target. This image slide may be used to express views on competition, success and goal achievement in your presentations. This image slide will give edge to your presentations.
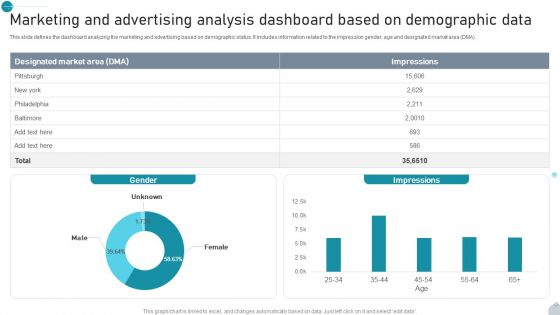
Marketing And Advertising Analysis Dashboard Based On Demographic Data Demonstration PDF
This slide defines the dashboard analyzing the marketing and advertising based on demographic status. It includes information related to the impression gender, age and designated market area DMA. Showcasing this set of slides titled Marketing And Advertising Analysis Dashboard Based On Demographic Data Demonstration PDF. The topics addressed in these templates are Gender, Impressions, Demographic Data All the content presented in this PPT design is completely editable. Download it and make adjustments in color, background, font etc. as per your unique business setting.
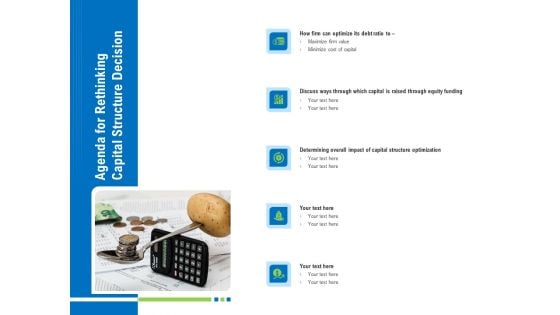
Revaluate Capital Structure Resolution Agenda For Rethinking Capital Structure Decision Structure PDF
Presenting revaluate capital structure resolution agenda for rethinking capital structure decision structure pdf. to provide visual cues and insights. Share and navigate important information on five stages that need your due attention. This template can be used to pitch topics like maximize firm value, structure optimization, minimize cost of capital. In addtion, this PPT design contains high resolution images, graphics, etc, that are easily editable and available for immediate download.
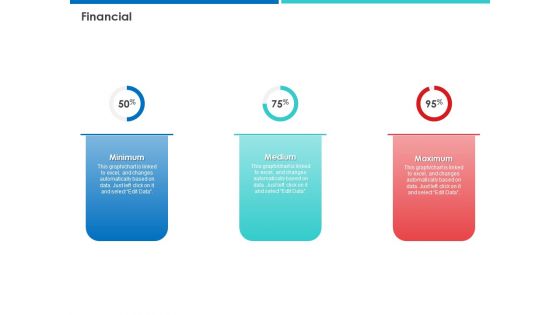
Accelerating COVID 19 Recovery In Maritime Sector Financial Graphics PDF
Presenting accelerating COVID 19 recovery in maritime sector financial graphics pdf. to provide visual cues and insights. Share and navigate important information on three stages that need your due attention. This template can be used to pitch topics like minimum, medium, maximum. In addtion, this PPT design contains high resolution images, graphics, etc, that are easily editable and available for immediate download.
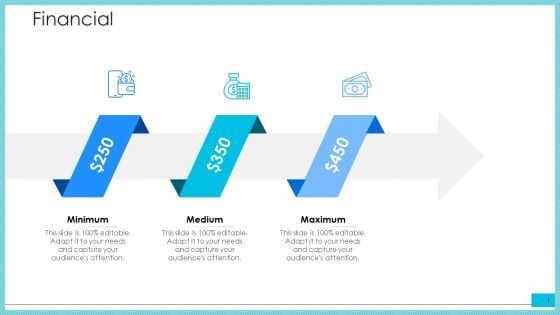
Post Initial Public Offering Investor Pitch Deck Financial Clipart PDF
Presenting post initial public offering investor pitch deck financial clipart pdf. to provide visual cues and insights. Share and navigate important information on three stages that need your due attention. This template can be used to pitch topics like minimum, medium, maximum. In addtion, this PPT design contains high resolution images, graphics, etc, that are easily editable and available for immediate download.
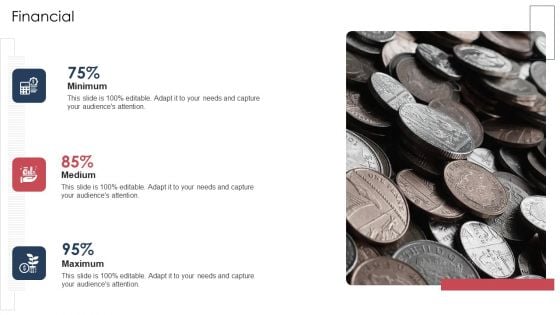
World Energy Trends Problems And Solutions Case Competition Financial Information PDF
Presenting world energy trends problems and solutions case competition financial information pdf. to provide visual cues and insights. Share and navigate important information on three stages that need your due attention. This template can be used to pitch topics like minimum, medium, maximum. In addtion, this PPT design contains high resolution images, graphics, etc, that are easily editable and available for immediate download.
Business Data Insights Report Icon Download PDF
Showcasing this set of slides titled Business Data Insights Report Icon Download PDF. The topics addressed in these templates are Business, Data Insights, Report. All the content presented in this PPT design is completely editable. Download it and make adjustments in color, background, font etc. as per your unique business setting.

Employee Demographics Data And Gender Distribution Dashboard Topics PDF
The purpose of this template is to explain the employee demographics and gender distribution dashboard. The slide provides information about distribution, hire and turnover based gender. Showcasing this set of slides titled Employee Demographics Data And Gender Distribution Dashboard Topics PDF. The topics addressed in these templates are Gender Distribution, Turnover By Gender, Hires By Gender All the content presented in this PPT design is completely editable. Download it and make adjustments in color, background, font etc. as per your unique business setting.
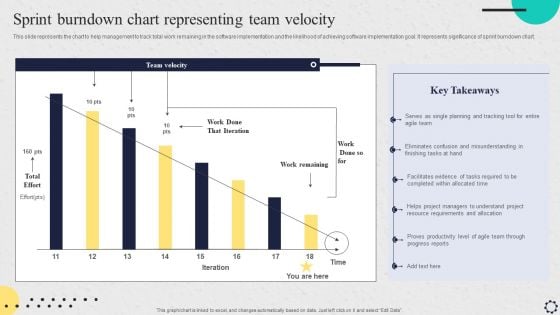
Software Implementation Strategy Sprint Burndown Chart Representing Team Velocity Brochure PDF
This slide represents the chart to help management to track total work remaining in the software implementation and the likelihood of achieving software implementation goal. It represents significance of sprint burndown chart. If your project calls for a presentation, then Slidegeeks is your go to partner because we have professionally designed, easy to edit templates that are perfect for any presentation. After downloading, you can easily edit Software Implementation Strategy Sprint Burndown Chart Representing Team Velocity Brochure PDF and make the changes accordingly. You can rearrange slides or fill them with different images. Check out all the handy templates.
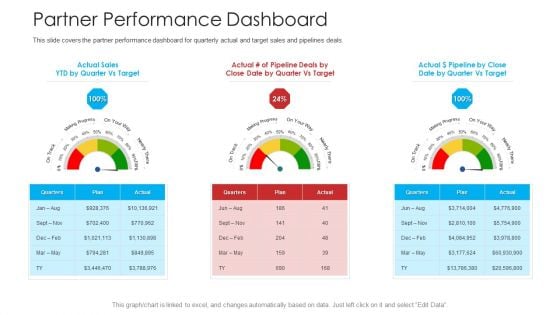
Retailer Channel Partner Boot Camp Partner Performance Dashboard Sample PDF
This slide covers the partner performance dashboard for quarterly actual and target sales and pipelines deals. Presenting retailer channel partner boot camp partner performance dashboard sample pdf to provide visual cues and insights. Share and navigate important information on three stages that need your due attention. This template can be used to pitch topics like performance dashboard, target sales, marketing progress. In addition, this PPT design contains high-resolution images, graphics, etc, that are easily editable and available for immediate download.
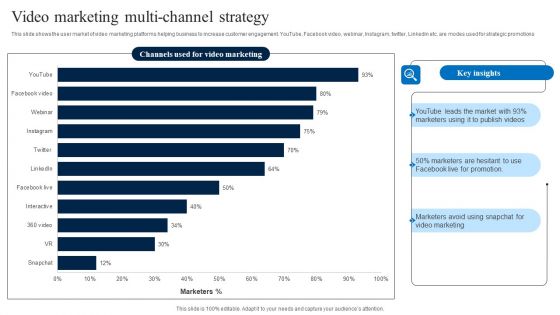
Video Marketing Multi Channel Strategy Download PDF
This slide shows the user market of video marketing platforms helping business to increase customer engagement. YouTube, Facebook video, webinar, Instagram, twitter, Linkedin etc. are modes used for strategic promotions Showcasing this set of slides titled Video Marketing Multi Channel Strategy Download PDF. The topics addressed in these templates are Marketing, Key Insights, Strategy. All the content presented in this PPT design is completely editable. Download it and make adjustments in color, background, font etc. as per your unique business setting.
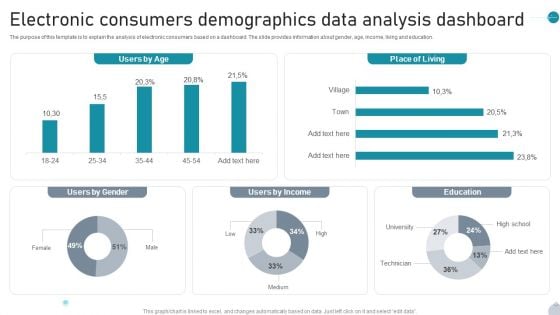
Electronic Consumers Demographics Data Analysis Dashboard Topics PDF
The purpose of this template is to explain the analysis of electronic consumers based on a dashboard. The slide provides information about gender, age, income, living and education. Showcasing this set of slides titled Electronic Consumers Demographics Data Analysis Dashboard Topics PDF. The topics addressed in these templates are Users By Age, Place Of Living, Users By Income All the content presented in this PPT design is completely editable. Download it and make adjustments in color, background, font etc. as per your unique business setting.
Implementing Client Onboarding Process Customer Reviews And Ratings For Product Evaluation Icons PDF
This slide provides glimpse about client reviews about the product offered by the brand so the customers can check reviews of products users and realize the products value. It includes multiple KPIs such as quality, effectiveness, fragrance, etc. If you are looking for a format to display your unique thoughts, then the professionally designed Implementing Client Onboarding Process Customer Reviews And Ratings For Product Evaluation Icons PDF is the one for you. You can use it as a Google Slides template or a PowerPoint template. Incorporate impressive visuals, symbols, images, and other charts. Modify or reorganize the text boxes as you desire. Experiment with shade schemes and font pairings. Alter, share or cooperate with other people on your work. Download Implementing Client Onboarding Process Customer Reviews And Ratings For Product Evaluation Icons PDF and find out how to give a successful presentation. Present a perfect display to your team and make your presentation unforgettable.
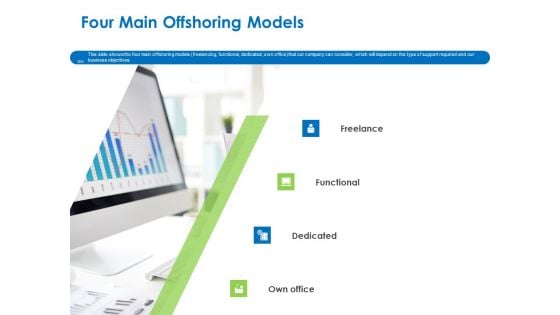
Relocation Of Business Process Offshoring Four Main Offshoring Models Mockup PDF
This slide shows the four main offshoring models freelancing, functional, dedicated, own office that our company can consider, which will depend on the type of support required and our business objectives. Presenting relocation of business process offshoring four main offshoring models mockup pdf to provide visual cues and insights. Share and navigate important information on four stages that need your due attention. This template can be used to pitch topics like freelance, functional, dedicated, own office. In addition, this PPT design contains high-resolution images, graphics, etc, that are easily editable and available for immediate download.
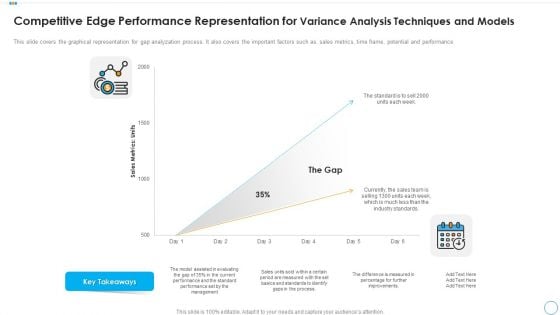
Competitive Edge Performance Representation For Variance Analysis Techniques And Models Ideas PDF
This slide covers the graphical representation for gap analyzation process. It also covers the important factors such as, sales metrics, time frame, potential and performance. Showcasing this set of slides titled competitive edge performance representation for variance analysis techniques and models ideas pdf. The topics addressed in these templates are competitive edge performance representation for variance analysis techniques and models. All the content presented in this PPT design is completely editable. Download it and make adjustments in color, background, font etc. as per your unique business setting.
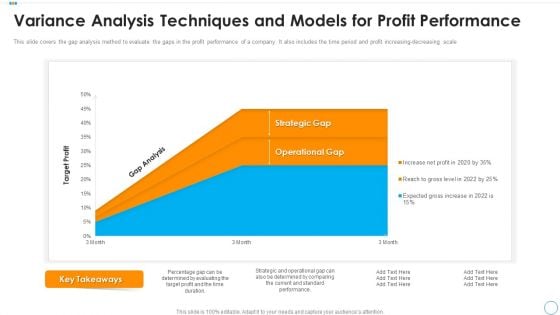
Variance Analysis Techniques And Models For Profit Performance Sample PDF
This slide covers the gap analysis method to evaluate the gaps in the profit performance of a company. It also includes the time period and profit increasing decreasing scale. Showcasing this set of slides titled variance analysis techniques and models for profit performance sample pdf. The topics addressed in these templates are variance analysis techniques and models for profit performance. All the content presented in this PPT design is completely editable. Download it and make adjustments in color, background, font etc. as per your unique business setting.
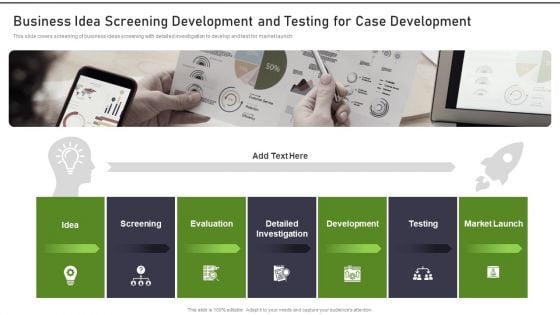
Modernization And Product Business Idea Screening Development And Testing For Guidelines PDF
This slide covers screening of business ideas screening with detailed investigation to develop and test for market launch. Presenting modernization and product business idea screening development and testing for guidelines pdf to provide visual cues and insights. Share and navigate important information on one stages that need your due attention. This template can be used to pitch topics like screening, evaluation, development, testing, market launch. In addtion, this PPT design contains high resolution images, graphics, etc, that are easily editable and available for immediate download.
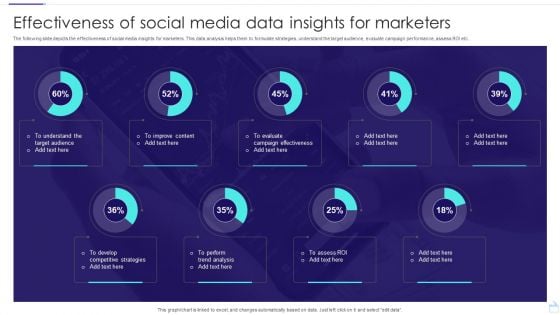
Effectiveness Of Social Media Data Insights For Marketers Ideas PDF
The following slide depicts the effectiveness of social media insights for marketers. This data analysis helps them to formulate strategies, understand the target audience, evaluate campaign performance, assess ROI etc. Showcasing this set of slides titled Effectiveness Of Social Media Data Insights For Marketers Ideas PDF. The topics addressed in these templates are Effectiveness, Social Media, Marketers. All the content presented in this PPT design is completely editable. Download it and make adjustments in color, background, font etc. as per your unique business setting.


 Continue with Email

 Home
Home


