Financial Budget
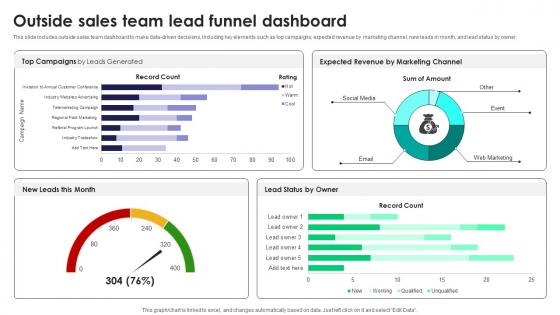
Outside Sales Team Lead Funnel Dashboard Tactics For Improving Field Sales Team SA SS V
This slide includes outside sales team dashboard to make data-driven decisions, including key elements such as top campaigns, expected revenue by marketing channel, new leads in month, and lead status by owner.Retrieve professionally designed Outside Sales Team Lead Funnel Dashboard Tactics For Improving Field Sales Team SA SS V to effectively convey your message and captivate your listeners. Save time by selecting pre-made slideshows that are appropriate for various topics, from business to educational purposes. These themes come in many different styles, from creative to corporate, and all of them are easily adjustable and can be edited quickly. Access them as PowerPoint templates or as Google Slides themes. You do not have to go on a hunt for the perfect presentation because Slidegeeks got you covered from everywhere. This slide includes outside sales team dashboard to make data-driven decisions, including key elements such as top campaigns, expected revenue by marketing channel, new leads in month, and lead status by owner.
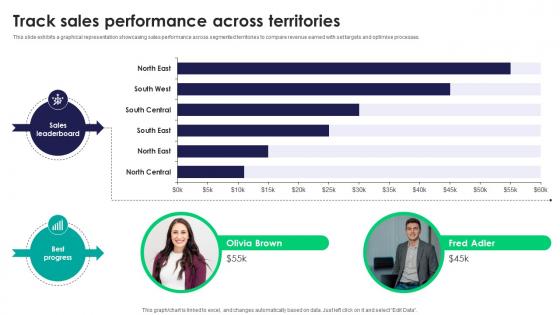
Track Sales Performance Across Territories Tactics For Improving Field Sales Team SA SS V
This slide exhibits a graphical representation showcasing sales performance across segmented territories to compare revenue earned with set targets and optimise processes. Here you can discover an assortment of the finest PowerPoint and Google Slides templates. With these templates, you can create presentations for a variety of purposes while simultaneously providing your audience with an eye-catching visual experience. Download Track Sales Performance Across Territories Tactics For Improving Field Sales Team SA SS V to deliver an impeccable presentation. These templates will make your job of preparing presentations much quicker, yet still, maintain a high level of quality. Slidegeeks has experienced researchers who prepare these templates and write high-quality content for you. Later on, you can personalize the content by editing the Track Sales Performance Across Territories Tactics For Improving Field Sales Team SA SS V. This slide exhibits a graphical representation showcasing sales performance across segmented territories to compare revenue earned with set targets and optimise processes.
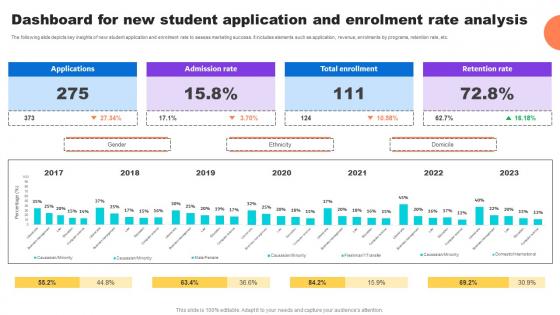
Dashboard For New Student Application And Enrolment Key Step To Implementation University Strategy SS V
The following slide depicts key insights of new student application and enrolment rate to assess marketing success. It includes elements such as application, revenue, enrolments by programs, retention rate, etc.Crafting an eye-catching presentation has never been more straightforward. Let your presentation shine with this tasteful yet straightforward Dashboard For New Student Application And Enrolment Key Step To Implementation University Strategy SS V template. It offers a minimalistic and classy look that is great for making a statement. The colors have been employed intelligently to add a bit of playfulness while still remaining professional. Construct the ideal Dashboard For New Student Application And Enrolment Key Step To Implementation University Strategy SS V that effortlessly grabs the attention of your audience Begin now and be certain to wow your customers The following slide depicts key insights of new student application and enrolment rate to assess marketing success. It includes elements such as application, revenue, enrolments by programs, retention rate, etc.
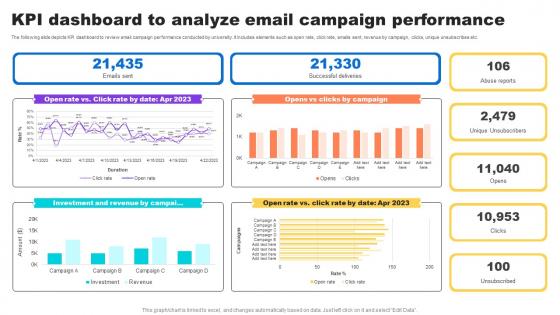
Kpi Dashboard To Analyze Email Campaign Key Step To Implementation University Strategy SS V
The following slide depicts KPI dashboard to review email campaign performance conducted by university. It includes elements such as open rate, click rate, emails sent, revenue by campaign, clicks, unique unsubscribes etc.The Kpi Dashboard To Analyze Email Campaign Key Step To Implementation University Strategy SS V is a compilation of the most recent design trends as a series of slides. It is suitable for any subject or industry presentation, containing attractive visuals and photo spots for businesses to clearly express their messages. This template contains a variety of slides for the user to input data, such as structures to contrast two elements, bullet points, and slides for written information. Slidegeeks is prepared to create an impression. The following slide depicts KPI dashboard to review email campaign performance conducted by university. It includes elements such as open rate, click rate, emails sent, revenue by campaign, clicks, unique unsubscribes etc.
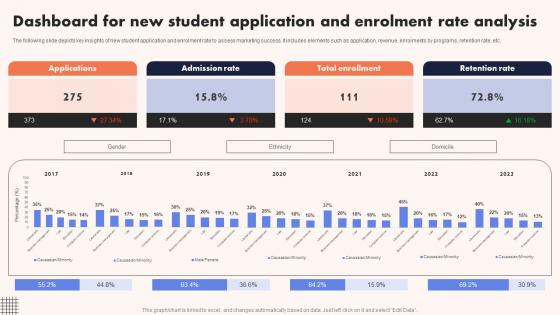
University Marketing Guide Dashboard For New Student Application And Enrolment Strategy SS V
The following slide depicts key insights of new student application and enrolment rate to assess marketing success. It includes elements such as application, revenue, enrolments by programs, retention rate, etc. Coming up with a presentation necessitates that the majority of the effort goes into the content and the message you intend to convey. The visuals of a PowerPoint presentation can only be effective if it supplements and supports the story that is being told. Keeping this in mind our experts created University Marketing Guide Dashboard For New Student Application And Enrolment Strategy SS V to reduce the time that goes into designing the presentation. This way, you can concentrate on the message while our designers take care of providing you with the right template for the situation. The following slide depicts key insights of new student application and enrolment rate to assess marketing success. It includes elements such as application, revenue, enrolments by programs, retention rate, etc.
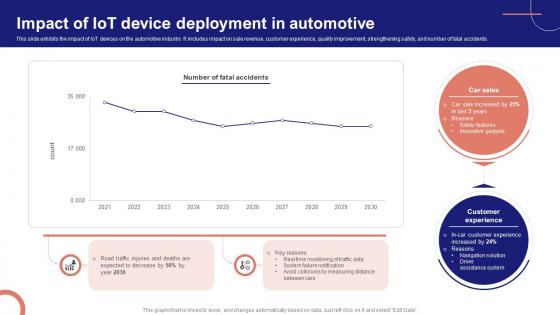
IoT Device Management Fundamentals Impact Of IoT Device Deployment In Automotive IoT Ss V
This slide exhibits the impact of IoT devices on the automotive industry. It includes impact on sale revenue, customer experience, quality improvement, strengthening safety, and number of fatal accidents. This modern and well-arranged IoT Device Management Fundamentals Impact Of IoT Device Deployment In Automotive IoT SS V provides lots of creative possibilities. It is very simple to customize and edit with the Powerpoint Software. Just drag and drop your pictures into the shapes. All facets of this template can be edited with Powerpoint, no extra software is necessary. Add your own material, put your images in the places assigned for them, adjust the colors, and then you can show your slides to the world, with an animated slide included. This slide exhibits the impact of IoT devices on the automotive industry. It includes impact on sale revenue, customer experience, quality improvement, strengthening safety, and number of fatal accidents.
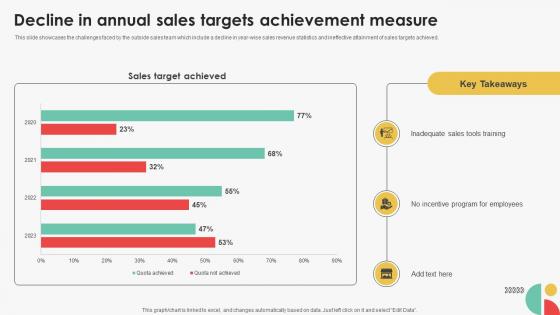
Decline In Annual Sales Targets Achievement Efficient Sales Territory Management To Build SA SS V
This slide showcases the challenges faced by the outside sales team which include a decline in year-wise sales revenue statistics and ineffective attainment of sales targets achieved. Slidegeeks is here to make your presentations a breeze with Decline In Annual Sales Targets Achievement Efficient Sales Territory Management To Build SA SS V With our easy-to-use and customizable templates, you can focus on delivering your ideas rather than worrying about formatting. With a variety of designs to choose from, you are sure to find one that suits your needs. And with animations and unique photos, illustrations, and fonts, you can make your presentation pop. So whether you are giving a sales pitch or presenting to the board, make sure to check out Slidegeeks first This slide showcases the challenges faced by the outside sales team which include a decline in year-wise sales revenue statistics and ineffective attainment of sales targets achieved.
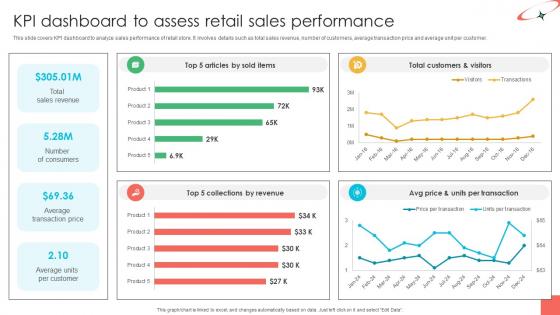
Marketing Strategies For Effective KPI Dashboard To Assess Retail Sales Performance
This slide covers KPI dashboard to analyze sales performance of retail store. It involves details such as total sales revenue, number of customers, average transaction price and average unit per customer. This Marketing Strategies For Effective KPI Dashboard To Assess Retail Sales Performance is perfect for any presentation, be it in front of clients or colleagues. It is a versatile and stylish solution for organizing your meetings. The Marketing Strategies For Effective KPI Dashboard To Assess Retail Sales Performance features a modern design for your presentation meetings. The adjustable and customizable slides provide unlimited possibilities for acing up your presentation. Slidegeeks has done all the homework before launching the product for you. So, do not wait, grab the presentation templates today This slide covers KPI dashboard to analyze sales performance of retail store. It involves details such as total sales revenue, number of customers, average transaction price and average unit per customer.
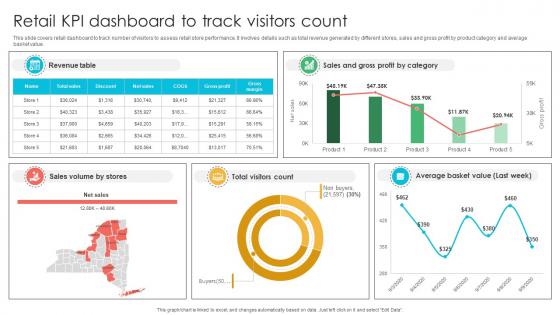
Marketing Strategies For Effective Retail KPI Dashboard To Track Visitors Count
This slide covers retail dashboard to track number of visitors to assess retail store performance. It involves details such as total revenue generated by different stores, sales and gross profit by product category and average basket value. Want to ace your presentation in front of a live audience Our Marketing Strategies For Effective Retail KPI Dashboard To Track Visitors Count can help you do that by engaging all the users towards you. Slidegeeks experts have put their efforts and expertise into creating these impeccable powerpoint presentations so that you can communicate your ideas clearly. Moreover, all the templates are customizable, and easy-to-edit and downloadable. Use these for both personal and commercial use. This slide covers retail dashboard to track number of visitors to assess retail store performance. It involves details such as total revenue generated by different stores, sales and gross profit by product category and average basket value.
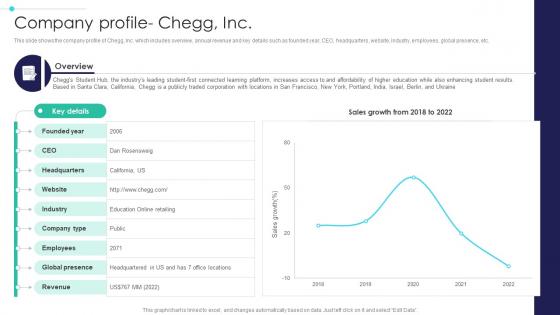
Global Digital Education Company Profile Chegg Inc IR SS V
This slide shows the company profile of Chegg, Inc. which includes overview, annual revenue and key details such as founded year, CEO, headquarters, website, industry, employees, global presence, etc. Want to ace your presentation in front of a live audience Our Global Digital Education Company Profile Chegg Inc IR SS V can help you do that by engaging all the users towards you. Slidegeeks experts have put their efforts and expertise into creating these impeccable powerpoint presentations so that you can communicate your ideas clearly. Moreover, all the templates are customizable, and easy-to-edit and downloadable. Use these for both personal and commercial use. This slide shows the company profile of Chegg, Inc. which includes overview, annual revenue and key details such as founded year, CEO, headquarters, website, industry, employees, global presence, etc.
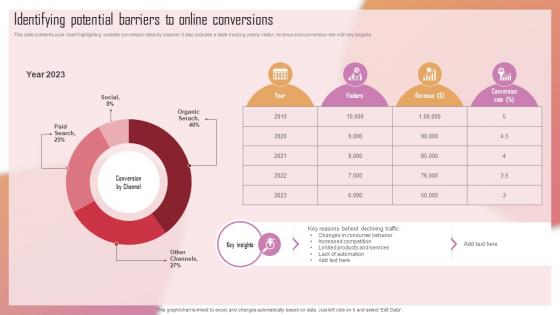
Customizing The Salon Experience Identifying Potential Barriers To Online Conversions Strategy SS V
This slide presents a pie chart highlighting website conversion rates by channel. It also includes a table tracking yearly visitor, revenue and conversion rate with key insights. Are you searching for a Customizing The Salon Experience Identifying Potential Barriers To Online Conversions Strategy SS V that is uncluttered, straightforward, and original Its easy to edit, and you can change the colors to suit your personal or business branding. For a presentation that expresses how much effort you have put in, this template is ideal With all of its features, including tables, diagrams, statistics, and lists, its perfect for a business plan presentation. Make your ideas more appealing with these professional slides. Download Customizing The Salon Experience Identifying Potential Barriers To Online Conversions Strategy SS V from Slidegeeks today. This slide presents a pie chart highlighting website conversion rates by channel. It also includes a table tracking yearly visitor, revenue and conversion rate with key insights.
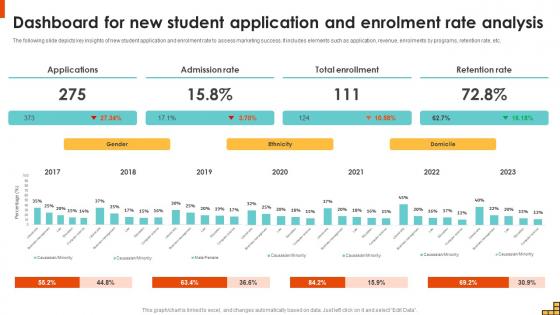
Dashboard For New Student Application And Enrolment Running Marketing Campaigns Strategy SS V
The following slide depicts key insights of new student application and enrolment rate to assess marketing success. It includes elements such as application, revenue, enrolments by programs, retention rate, etc. Crafting an eye-catching presentation has never been more straightforward. Let your presentation shine with this tasteful yet straightforward Dashboard For New Student Application And Enrolment Running Marketing Campaigns Strategy SS V template. It offers a minimalistic and classy look that is great for making a statement. The colors have been employed intelligently to add a bit of playfulness while still remaining professional. Construct the ideal Dashboard For New Student Application And Enrolment Running Marketing Campaigns Strategy SS V that effortlessly grabs the attention of your audience Begin now and be certain to wow your customers The following slide depicts key insights of new student application and enrolment rate to assess marketing success. It includes elements such as application, revenue, enrolments by programs, retention rate, etc.

Marketing Growth Strategy KPI Dashboard To Evaluate Sales Performance Strategy SS V
The following slide outlines key performance indicator KPI dashboard to monitor sales performance of company. The key metrics covered in slide are total sales by location, monthly sales trend, average revenue AR by clients, etc. This Marketing Growth Strategy KPI Dashboard To Evaluate Sales Performance Strategy SS V is perfect for any presentation, be it in front of clients or colleagues. It is a versatile and stylish solution for organizing your meetings. The Marketing Growth Strategy KPI Dashboard To Evaluate Sales Performance Strategy SS V features a modern design for your presentation meetings. The adjustable and customizable slides provide unlimited possibilities for acing up your presentation. Slidegeeks has done all the homework before launching the product for you. So, do not wait, grab the presentation templates today The following slide outlines key performance indicator KPI dashboard to monitor sales performance of company. The key metrics covered in slide are total sales by location, monthly sales trend, average revenue AR by clients, etc.
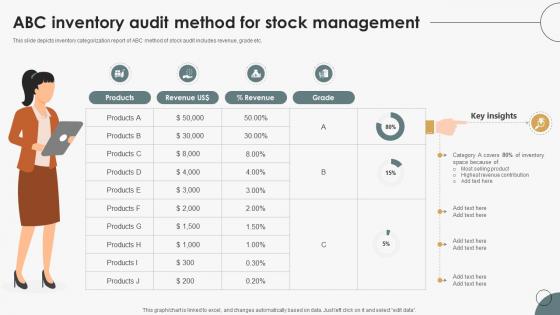
Boosting Efficiency In Inventory ABC Inventory Audit Method For Stock Management
This slide depicts inventory categorization report of ABC method of stock audit includes revenue, grade etc. Create an editable Boosting Efficiency In Inventory ABC Inventory Audit Method For Stock Management that communicates your idea and engages your audience. Whether you are presenting a business or an educational presentation, pre-designed presentation templates help save time. Boosting Efficiency In Inventory ABC Inventory Audit Method For Stock Management is highly customizable and very easy to edit, covering many different styles from creative to business presentations. Slidegeeks has creative team members who have crafted amazing templates. So, go and get them without any delay. This slide depicts inventory categorization report of ABC method of stock audit includes revenue, grade etc.
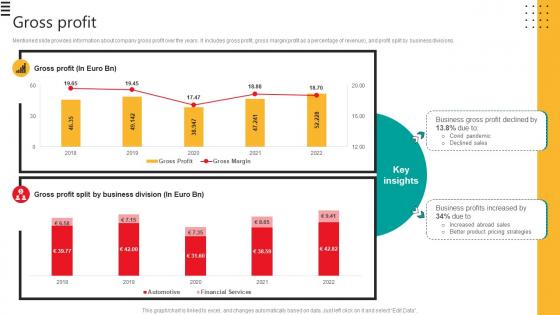
Gross Profit Automobile Development Company Profile CP SS V
Mentioned slide provides information about company gross profit over the years. It includes gross profit, gross marginprofit as a percentage of revenue, and profit split by business divisions.Formulating a presentation can take up a lot of effort and time, so the content and message should always be the primary focus. The visuals of the PowerPoint can enhance the presenters message, so our Gross Profit Automobile Development Company Profile CP SS V was created to help save time. Instead of worrying about the design, the presenter can concentrate on the message while our designers work on creating the ideal templates for whatever situation is needed. Slidegeeks has experts for everything from amazing designs to valuable content, we have put everything into Gross Profit Automobile Development Company Profile CP SS V. Mentioned slide provides information about company gross profit over the years. It includes gross profit, gross marginprofit as a percentage of revenue, and profit split by business divisions.
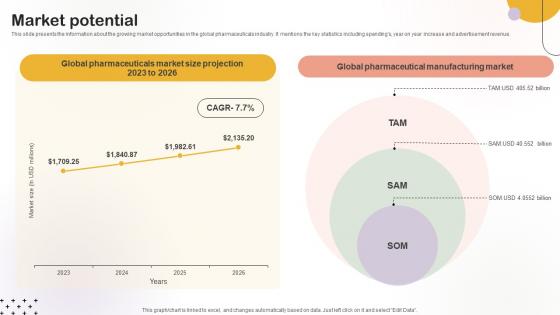
Market Potential Medical Research Organization Pitch Deck
This slide presents the information about the growing market opportunities in the global pharmaceuticals industry. It mentions the key statistics including spendings, year on year increase and advertisement revenue.If you are looking for a format to display your unique thoughts, then the professionally designed Market Potential Medical Research Organization Pitch Deck is the one for you. You can use it as a Google Slides template or a PowerPoint template. Incorporate impressive visuals, symbols, images, and other charts. Modify or reorganize the text boxes as you desire. Experiment with shade schemes and font pairings. Alter, share or cooperate with other people on your work. Download Market Potential Medical Research Organization Pitch Deck and find out how to give a successful presentation. Present a perfect display to your team and make your presentation unforgettable. This slide presents the information about the growing market opportunities in the global pharmaceuticals industry. It mentions the key statistics including spendings, year on year increase and advertisement revenue.
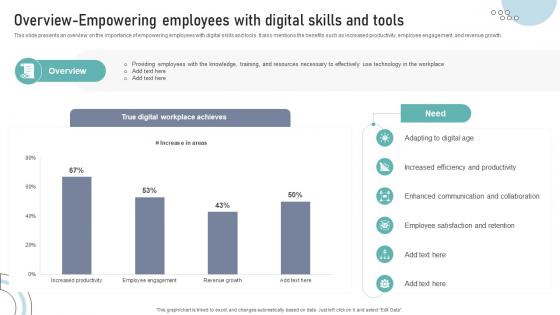
Overview Empowering Employees With Digital Skills And Tools DT SS V
This slide presents an overview on the importance of empowering employees with digital skills and tools. It also mentions the benefits such as increased productivity, employee engagement, and revenue growth.Are you in need of a template that can accommodate all of your creative concepts This one is crafted professionally and can be altered to fit any style. Use it with Google Slides or PowerPoint. Include striking photographs, symbols, depictions, and other visuals. Fill, move around, or remove text boxes as desired. Test out color palettes and font mixtures. Edit and save your work, or work with colleagues. Download Overview Empowering Employees With Digital Skills And Tools DT SS V and observe how to make your presentation outstanding. Give an impeccable presentation to your group and make your presentation unforgettable. This slide presents an overview on the importance of empowering employees with digital skills and tools. It also mentions the benefits such as increased productivity, employee engagement, and revenue growth.
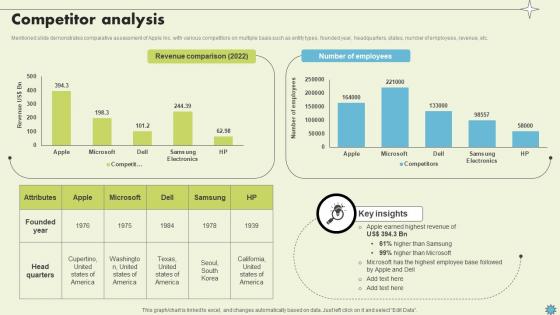
Competitor Analysis Consumer Electronics Company Profile CP SS V
Mentioned slide demonstrates comparative assessment of Apple Inc. with various competitors on multiple basis such as entity types, founded year, headquarters, states, number of employees, revenue, etc.Crafting an eye-catching presentation has never been more straightforward. Let your presentation shine with this tasteful yet straightforward Competitor Analysis Consumer Electronics Company Profile CP SS V template. It offers a minimalistic and classy look that is great for making a statement. The colors have been employed intelligently to add a bit of playfulness while still remaining professional. Construct the ideal Competitor Analysis Consumer Electronics Company Profile CP SS V that effortlessly grabs the attention of your audience Begin now and be certain to wow your customers Mentioned slide demonstrates comparative assessment of Apple Inc. with various competitors on multiple basis such as entity types, founded year, headquarters, states, number of employees, revenue, etc.
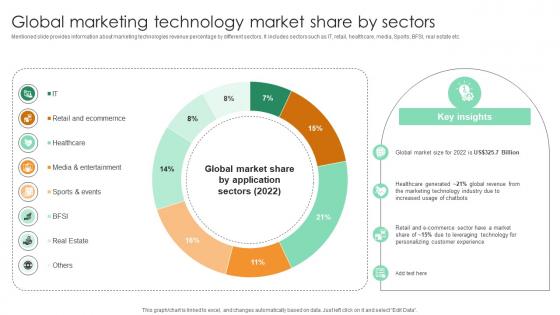
Global Marketing Technology Market Share By Sectors Comprehensive Guide For Marketing Technology
Mentioned slide provides information about marketing technologies revenue percentage by different sectors. It includes sectors such as IT, retail, healthcare, media, Sports, BFSI, real estate etc. This Global Marketing Technology Market Share By Sectors Comprehensive Guide For Marketing Technology from Slidegeeks makes it easy to present information on your topic with precision. It provides customization options, so you can make changes to the colors, design, graphics, or any other component to create a unique layout. It is also available for immediate download, so you can begin using it right away. Slidegeeks has done good research to ensure that you have everything you need to make your presentation stand out. Make a name out there for a brilliant performance. Mentioned slide provides information about marketing technologies revenue percentage by different sectors. It includes sectors such as IT, retail, healthcare, media, Sports, BFSI, real estate etc.
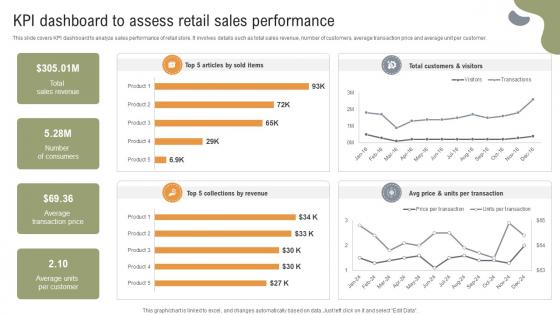
Implementing Strategies To Enhance KPI Dashboard To Assess Retail Sales Performance
This slide covers KPI dashboard to analyze sales performance of retail store. It involves details such as total sales revenue, number of customers, average transaction price and average unit per customer. The Implementing Strategies To Enhance KPI Dashboard To Assess Retail Sales Performance is a compilation of the most recent design trends as a series of slides. It is suitable for any subject or industry presentation, containing attractive visuals and photo spots for businesses to clearly express their messages. This template contains a variety of slides for the user to input data, such as structures to contrast two elements, bullet points, and slides for written information. Slidegeeks is prepared to create an impression. This slide covers KPI dashboard to analyze sales performance of retail store. It involves details such as total sales revenue, number of customers, average transaction price and average unit per customer.
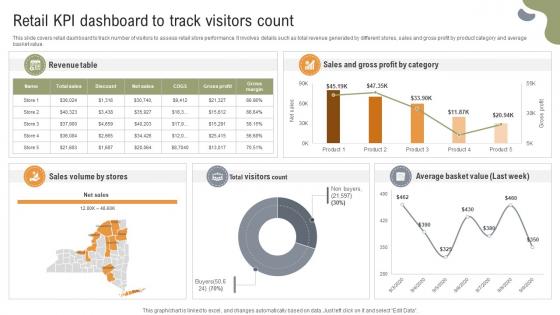
Implementing Strategies To Enhance Retail KPI Dashboard To Track Visitors Count
This slide covers retail dashboard to track number of visitors to assess retail store performance. It involves details such as total revenue generated by different stores, sales and gross profit by product category and average basket value. Want to ace your presentation in front of a live audience Our Implementing Strategies To Enhance Retail KPI Dashboard To Track Visitors Count can help you do that by engaging all the users towards you. Slidegeeks experts have put their efforts and expertise into creating these impeccable powerpoint presentations so that you can communicate your ideas clearly. Moreover, all the templates are customizable, and easy-to-edit and downloadable. Use these for both personal and commercial use. This slide covers retail dashboard to track number of visitors to assess retail store performance. It involves details such as total revenue generated by different stores, sales and gross profit by product category and average basket value.

Strategies For Stabilizing Corporate Company Profit And Loss Dashboard With Income Statement
This slide provides a KPI dashboard that enables an organization to track revenue, expenses, and profit incurred in a specific period. It includes gross profit margin, OPEX ratio, operating profit margin, and net profit margin. There are so many reasons you need a Strategies For Stabilizing Corporate Company Profit And Loss Dashboard With Income Statement. The first reason is you can not spend time making everything from scratch, Thus, Slidegeeks has made presentation templates for you too. You can easily download these templates from our website easily. This slide provides a KPI dashboard that enables an organization to track revenue, expenses, and profit incurred in a specific period. It includes gross profit margin, OPEX ratio, operating profit margin, and net profit margin.

Complete Beginners Guide Statistics Associates With Market Of Crypto Wallets Fin SS V
This slide shows key statistical facts related to crypto wallets or Bitcoin wallets. It includes information such as highest revenue generating region, fastest growing region, total number if crypto wallet users, etc. Create an editable Complete Beginners Guide Statistics Associates With Market Of Crypto Wallets Fin SS V that communicates your idea and engages your audience. Whether you are presenting a business or an educational presentation, pre-designed presentation templates help save time. Complete Beginners Guide Statistics Associates With Market Of Crypto Wallets Fin SS V is highly customizable and very easy to edit, covering many different styles from creative to business presentations. Slidegeeks has creative team members who have crafted amazing templates. So, go and get them without any delay. This slide shows key statistical facts related to crypto wallets or Bitcoin wallets. It includes information such as highest revenue generating region, fastest growing region, total number if crypto wallet users, etc.
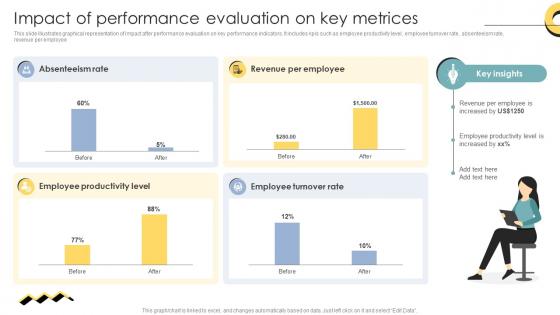
Skill Enhancement Performance Impact Of Performance Evaluation On Key Metrices
This slide illustrates graphical representation of impact after performance evaluation on key performance indicators. It includes kpis such as employee productivity level, employee turnover rate, absenteeism rate, revenue per employee. Do you have to make sure that everyone on your team knows about any specific topic I yes, then you should give Skill Enhancement Performance Impact Of Performance Evaluation On Key Metrices a try. Our experts have put a lot of knowledge and effort into creating this impeccable Skill Enhancement Performance Impact Of Performance Evaluation On Key Metrices. You can use this template for your upcoming presentations, as the slides are perfect to represent even the tiniest detail. You can download these templates from the Slidegeeks website and these are easy to edit. So grab these today This slide illustrates graphical representation of impact after performance evaluation on key performance indicators. It includes kpis such as employee productivity level, employee turnover rate, absenteeism rate, revenue per employee.
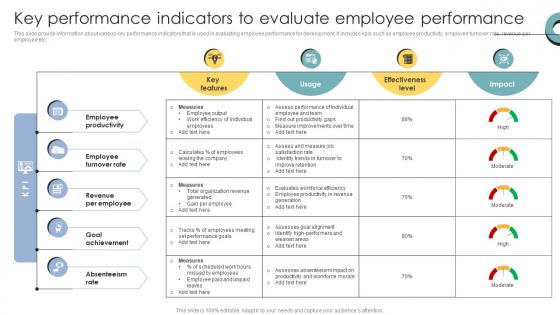
Skill Enhancement Performance Key Performance Indicators To Evaluate Employee Performance
This slide provide information about various key performance indicators that is used in evaluating employee performance for development. It includes kpis such as employee productivity, employee turnover rate, revenue per employee etc. Get a simple yet stunning designed Skill Enhancement Performance Key Performance Indicators To Evaluate Employee Performance. It is the best one to establish the tone in your meetings. It is an excellent way to make your presentations highly effective. So, download this PPT today from Slidegeeks and see the positive impacts. Our easy-to-edit Skill Enhancement Performance Key Performance Indicators To Evaluate Employee Performance can be your go-to option for all upcoming conferences and meetings. So, what are you waiting for Grab this template today. This slide provide information about various key performance indicators that is used in evaluating employee performance for development. It includes kpis such as employee productivity, employee turnover rate, revenue per employee etc.
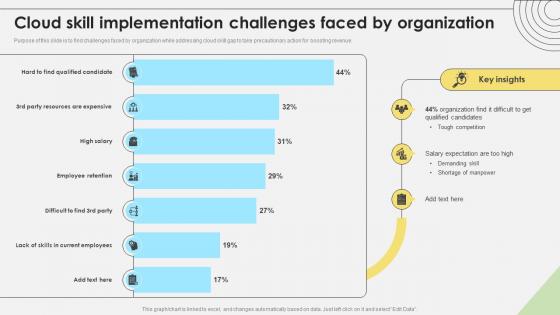
Workforce Competency Enhancement Cloud Skill Implementation Challenges Faced By Organization DTE SS V
Purpose of this slide is to find challenges faced by organization while addressing cloud skill gap to take precautionary action for boosting revenue. Present like a pro with Workforce Competency Enhancement Cloud Skill Implementation Challenges Faced By Organization DTE SS V. Create beautiful presentations together with your team, using our easy-to-use presentation slides. Share your ideas in real-time and make changes on the fly by downloading our templates. So whether you are in the office, on the go, or in a remote location, you can stay in sync with your team and present your ideas with confidence. With Slidegeeks presentation got a whole lot easier. Grab these presentations today. Purpose of this slide is to find challenges faced by organization while addressing cloud skill gap to take precautionary action for boosting revenue.
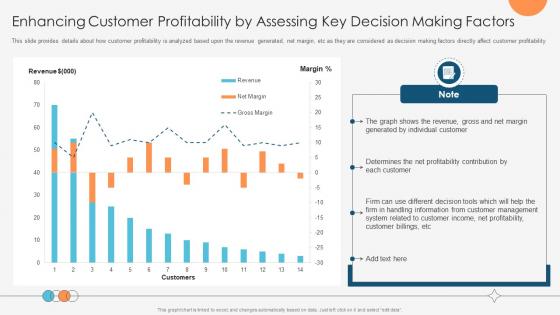
Enhancing Profitability Modelling Enhancing Customer Profitability By Assessing Key Decision Making
This slide provides details about how customer profitability is analyzed based upon the revenue generated, net margin, etc as they are considered as decision making factors directly affect customer profitability. Find highly impressive Enhancing Profitability Modelling Enhancing Customer Profitability By Assessing Key Decision Making on Slidegeeks to deliver a meaningful presentation. You can save an ample amount of time using these presentation templates. No need to worry to prepare everything from scratch because Slidegeeks experts have already done a huge research and work for you. You need to download Enhancing Profitability Modelling Enhancing Customer Profitability By Assessing Key Decision Making for your upcoming presentation. All the presentation templates are 100 percent editable and you can change the color and personalize the content accordingly. Download now This slide provides details about how customer profitability is analyzed based upon the revenue generated, net margin, etc as they are considered as decision making factors directly affect customer profitability

KPI Dashboard To Assess Retail Sales Food And Grocery Retail Ppt Sample
This slide covers KPI dashboard to analyze sales performance of retail store. It involves details such as total sales revenue, number of customers, average transaction price and average unit per customer. From laying roadmaps to briefing everything in detail, our templates are perfect for you. You can set the stage with your presentation slides. All you have to do is download these easy-to-edit and customizable templates. KPI Dashboard To Assess Retail Sales Food And Grocery Retail Ppt Sample will help you deliver an outstanding performance that everyone would remember and praise you for. Do download this presentation today. This slide covers KPI dashboard to analyze sales performance of retail store. It involves details such as total sales revenue, number of customers, average transaction price and average unit per customer.
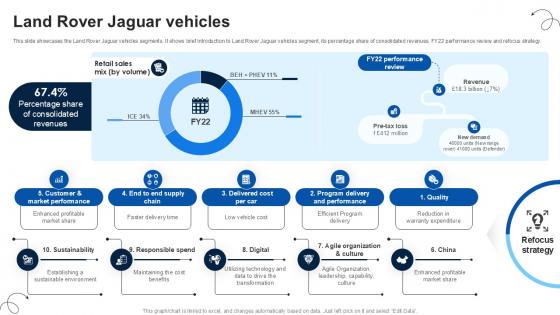
Land Rover Jaguar Vehicles Luxury Automobile Vehicles PPT Example CP SS V
This slide showcases the Land Rover Jaguar vehicles segments. It shows brief introduction to Land Rover Jaguar vehicles segment, its percentage share of consolidated revenues, FY22 performance review and refocus strategy. Are you searching for a Land Rover Jaguar Vehicles Luxury Automobile Vehicles PPT Example CP SS V that is uncluttered, straightforward, and original Its easy to edit, and you can change the colors to suit your personal or business branding. For a presentation that expresses how much effort you have put in, this template is ideal With all of its features, including tables, diagrams, statistics, and lists, its perfect for a business plan presentation. Make your ideas more appealing with these professional slides. Download Land Rover Jaguar Vehicles Luxury Automobile Vehicles PPT Example CP SS V from Slidegeeks today. This slide showcases the Land Rover Jaguar vehicles segments. It shows brief introduction to Land Rover Jaguar vehicles segment, its percentage share of consolidated revenues, FY22 performance review and refocus strategy.
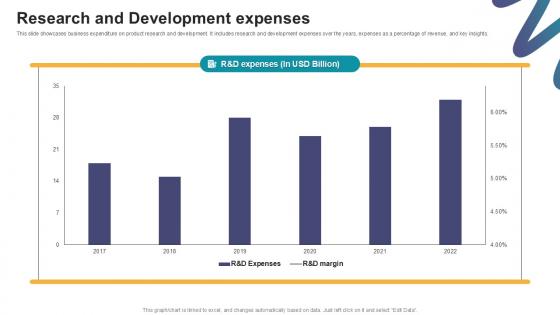
Research And Development Expenses Digital Marketings Strategies PPT PowerPoint CP SS V
This slide showcases business expenditure on product research and development. It includes research and development expenses over the years, expenses as a percentage of revenue, and key insights. This Research And Development Expenses Digital Marketings Strategies PPT PowerPoint CP SS V from Slidegeeks makes it easy to present information on your topic with precision. It provides customization options, so you can make changes to the colors, design, graphics, or any other component to create a unique layout. It is also available for immediate download, so you can begin using it right away. Slidegeeks has done good research to ensure that you have everything you need to make your presentation stand out. Make a name out there for a brilliant performance. This slide showcases business expenditure on product research and development. It includes research and development expenses over the years, expenses as a percentage of revenue, and key insights.
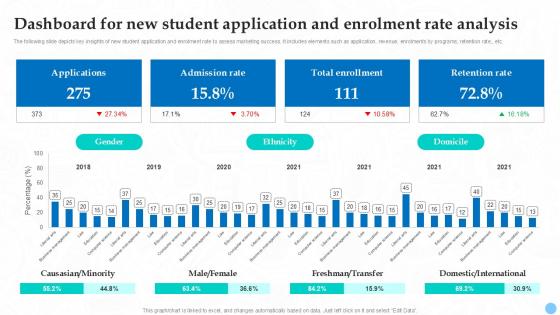
Dashboard For New Student Application Higher Education Ppt Sample Strategy SS V
The following slide depicts key insights of new student application and enrolment rate to assess marketing success. It includes elements such as application, revenue, enrolments by programs, retention rate, etc. Crafting an eye-catching presentation has never been more straightforward. Let your presentation shine with this tasteful yet straightforward Dashboard For New Student Application Higher Education Ppt Sample Strategy SS V template. It offers a minimalistic and classy look that is great for making a statement. The colors have been employed intelligently to add a bit of playfulness while still remaining professional. Construct the ideal Dashboard For New Student Application Higher Education Ppt Sample Strategy SS V that effortlessly grabs the attention of your audience Begin now and be certain to wow your customers The following slide depicts key insights of new student application and enrolment rate to assess marketing success. It includes elements such as application, revenue, enrolments by programs, retention rate, etc.
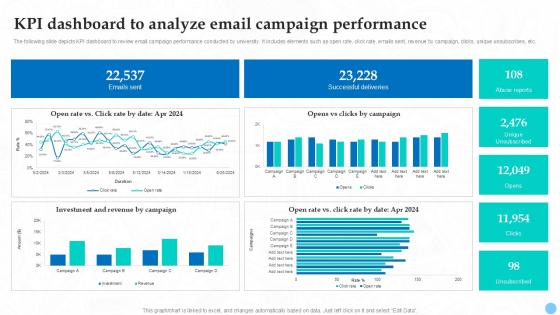
KPI Dashboard To Analyze Email Campaign Higher Education Ppt Sample Strategy SS V
The following slide depicts KPI dashboard to review email campaign performance conducted by university. It includes elements such as open rate, click rate, emails sent, revenue by campaign, clicks, unique unsubscribes, etc. The KPI Dashboard To Analyze Email Campaign Higher Education Ppt Sample Strategy SS V is a compilation of the most recent design trends as a series of slides. It is suitable for any subject or industry presentation, containing attractive visuals and photo spots for businesses to clearly express their messages. This template contains a variety of slides for the user to input data, such as structures to contrast two elements, bullet points, and slides for written information. Slidegeeks is prepared to create an impression. The following slide depicts KPI dashboard to review email campaign performance conducted by university. It includes elements such as open rate, click rate, emails sent, revenue by campaign, clicks, unique unsubscribes, etc.
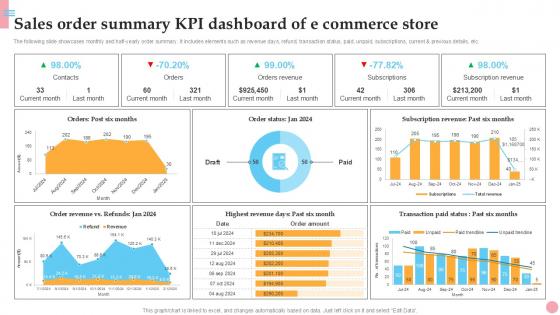
Sales Order Summary KPI Dashboard How To Improve Company PPT Sample Strategy SS V
The following slide showcases monthly and half-yearly order summary. It includes elements such as revenue days, refund, transaction status, paid, unpaid, subscriptions, current and previous details, etc. Do you know about Slidesgeeks Sales Order Summary KPI Dashboard How To Improve Company PPT Sample Strategy SS V These are perfect for delivering any kind od presentation. Using it, create PowerPoint presentations that communicate your ideas and engage audiences. Save time and effort by using our pre-designed presentation templates that are perfect for a wide range of topic. Our vast selection of designs covers a range of styles, from creative to business, and are all highly customizable and easy to edit. Download as a PowerPoint template or use them as Google Slides themes. The following slide showcases monthly and half-yearly order summary. It includes elements such as revenue days, refund, transaction status, paid, unpaid, subscriptions, current and previous details, etc.
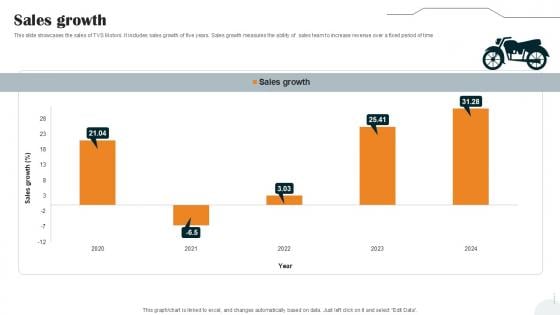
Sales Growth Vehicle Manufacturer Company Profile PPT Template CP SS V
This slide showcases the sales of TVS Motors. It includes sales growth of five years. Sales growth measures the ability of sales team to increase revenue over a fixed period of time. Are you searching for a Sales Growth Vehicle Manufacturer Company Profile PPT Template CP SS V that is uncluttered, straightforward, and original Its easy to edit, and you can change the colors to suit your personal or business branding. For a presentation that expresses how much effort you have put in, this template is ideal With all of its features, including tables, diagrams, statistics, and lists, its perfect for a business plan presentation. Make your ideas more appealing with these professional slides. Download Sales Growth Vehicle Manufacturer Company Profile PPT Template CP SS V from Slidegeeks today. This slide showcases the sales of TVS Motors. It includes sales growth of five years. Sales growth measures the ability of sales team to increase revenue over a fixed period of time
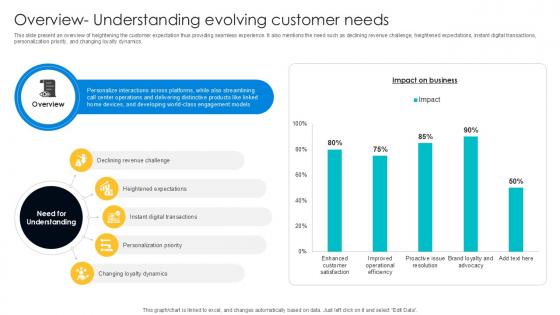
Overview Understanding Evolving Digital Transformation Journey PPT Presentation DT SS V
This slide present an overview of heightening the customer expectation thus providing seamless experience. It also mentions the need such as declining revenue challenge, heightened expectations, instant digital transactions, personalization priority, and changing loyalty dynamics. Explore a selection of the finest Instant Digital Transactions, Personalization Priority, Changing Loyalty Dynamics here. With a plethora of professionally designed and pre-made slide templates, you can quickly and easily find the right one for your upcoming presentation. You can use our Instant Digital Transactions, Personalization Priority, Changing Loyalty Dynamics to effectively convey your message to a wider audience. Slidegeeks has done a lot of research before preparing these presentation templates. The content can be personalized and the slides are highly editable. Grab templates today from Slidegeeks. This slide present an overview of heightening the customer expectation thus providing seamless experience. It also mentions the need such as declining revenue challenge, heightened expectations, instant digital transactions, personalization priority, and changing loyalty dynamics.
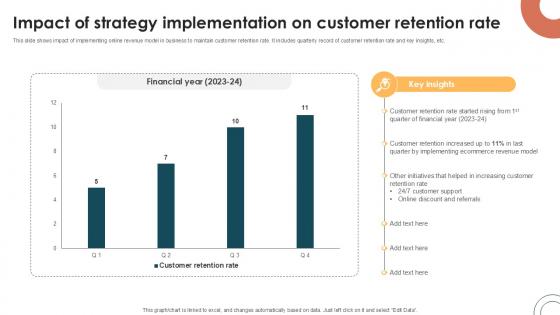
Impact Of Strategy Implementation Internet Based Trade Structure Ppt Slide
This slide shows impact of implementing online revenue model in business to maintain customer retention rate. It includes quarterly record of customer retention rate and key insights, etc. Are you searching for a Impact Of Strategy Implementation Internet Based Trade Structure Ppt Slide that is uncluttered, straightforward, and original Its easy to edit, and you can change the colors to suit your personal or business branding. For a presentation that expresses how much effort you have put in, this template is ideal With all of its features, including tables, diagrams, statistics, and lists, its perfect for a business plan presentation. Make your ideas more appealing with these professional slides. Download Impact Of Strategy Implementation Internet Based Trade Structure Ppt Slide from Slidegeeks today. This slide shows impact of implementing online revenue model in business to maintain customer retention rate. It includes quarterly record of customer retention rate and key insights, etc.

Quarterly Report Depicting Business Growth And Performance Quarterly Report Ppt Template
This slide depicts a report highlighting exceptional client retention, enhanced user engagement across key stages, and strong revenue growth driven by effective marketing strategies. Present like a pro with Quarterly Report Depicting Business Growth And Performance Quarterly Report Ppt Template Create beautiful presentations together with your team, using our easy-to-use presentation slides. Share your ideas in real-time and make changes on the fly by downloading our templates. So whether you are in the office, on the go, or in a remote location, you can stay in sync with your team and present your ideas with confidence. With Slidegeeks presentation got a whole lot easier. Grab these presentations today. This slide depicts a report highlighting exceptional client retention, enhanced user engagement across key stages, and strong revenue growth driven by effective marketing strategies.

Sales Strategy Interior Design Company Market Entry Plan PPT PowerPoint GTM SS V
This slide highlights various sales strategies to maximize sales and revenue. It highlights techniques such as identify potential customers, quick response to customers a d build trust and address customer fear. This modern and well-arranged Sales Strategy Interior Design Company Market Entry Plan PPT PowerPoint GTM SS V provides lots of creative possibilities. It is very simple to customize and edit with the Powerpoint Software. Just drag and drop your pictures into the shapes. All facets of this template can be edited with Powerpoint, no extra software is necessary. Add your own material, put your images in the places assigned for them, adjust the colors, and then you can show your slides to the world, with an animated slide included. This slide highlights various sales strategies to maximize sales and revenue. It highlights techniques such as identify potential customers, quick response to customers a d build trust and address customer fear.
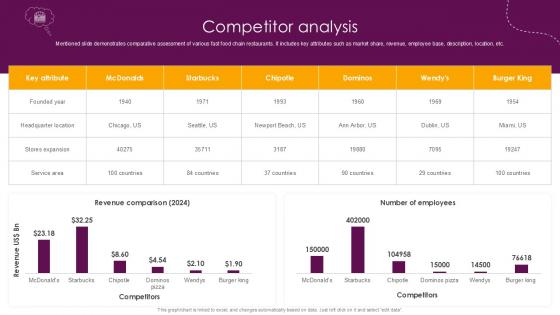
Competitor Analysis Food And Beverages Company Profile Ppt Powerpoint CP SS V
Mentioned slide demonstrates comparative assessment of various fast food chain restaurants. It includes key attributes such as market share, revenue, employee base, description, location, etc. Slidegeeks is here to make your presentations a breeze with Competitor Analysis Food And Beverages Company Profile Ppt Powerpoint CP SS V With our easy-to-use and customizable templates, you can focus on delivering your ideas rather than worrying about formatting. With a variety of designs to choose from, you are sure to find one that suits your needs. And with animations and unique photos, illustrations, and fonts, you can make your presentation pop. So whether you are giving a sales pitch or presenting to the board, make sure to check out Slidegeeks first Mentioned slide demonstrates comparative assessment of various fast food chain restaurants. It includes key attributes such as market share, revenue, employee base, description, location, etc.

Key Statistics Associated With Effective Strategies To Succeed At Virtual Ppt Sample SA SS V
Following slide highlights key statistics to understand role and adoption of insides sales intelligence technology to improve revenue. Are you searching for a Key Statistics Associated With Effective Strategies To Succeed At Virtual Ppt Sample SA SS V that is uncluttered, straightforward, and original Its easy to edit, and you can change the colors to suit your personal or business branding. For a presentation that expresses how much effort you have put in, this template is ideal With all of its features, including tables, diagrams, statistics, and lists, its perfect for a business plan presentation. Make your ideas more appealing with these professional slides. Download Key Statistics Associated With Effective Strategies To Succeed At Virtual Ppt Sample SA SS V from Slidegeeks today. Following slide highlights key statistics to understand role and adoption of insides sales intelligence technology to improve revenue.
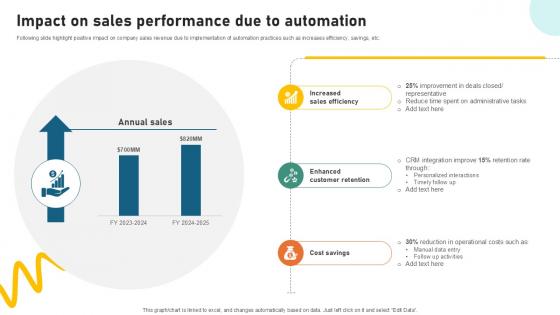
Impact On Sales Performance Due Sample Pitch Deck For Video Ppt Powerpoint
Following slide highlight positive impact on company sales revenue due to implementation of automation practices such as increases efficiency, savings, etc. If you are looking for a format to display your unique thoughts, then the professionally designed Impact On Sales Performance Due Sample Pitch Deck For Video Ppt Powerpoint is the one for you. You can use it as a Google Slides template or a PowerPoint template. Incorporate impressive visuals, symbols, images, and other charts. Modify or reorganize the text boxes as you desire. Experiment with shade schemes and font pairings. Alter, share or cooperate with other people on your work. Download Impact On Sales Performance Due Sample Pitch Deck For Video Ppt Powerpoint and find out how to give a successful presentation. Present a perfect display to your team and make your presentation unforgettable. Following slide highlight positive impact on company sales revenue due to implementation of automation practices such as increases efficiency, savings, etc.
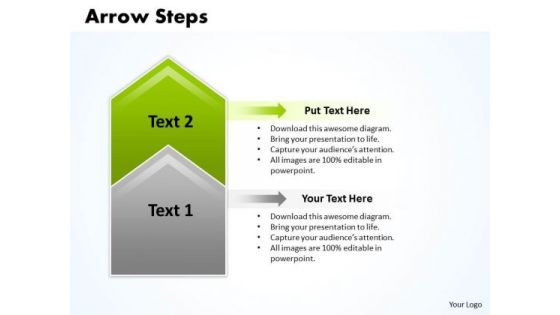
Strategy Ppt Theme Arrow Practice PowerPoint Macro Steps 2 Stages 3 Design
We present our strategy PPT Theme arrow practice powerpoint macro Steps 2 stages 3 design.Use our Advertising PowerPoint Templates because; there are different paths to gain the necessary knowledge to achieve it. Use our Arrows PowerPoint Templates because, you are the star of your enlightened team. Use our Marketing PowerPoint Templates because, your brain is always churning out ideas like cogs in a wheel. Use our Business PowerPoint Templates because, Marketing Strategy Business Template:- Maximizing sales of your product is the intended destination. Use our Process and flows PowerPoint Templates because, the lessons have been analyzed, studied and conclusions drawn. Use these PowerPoint slides for presentations relating to Advertising, arrow, banner, bookmark, card, choice, concept, creative, design, direction, flow, illustration, info graphic, instruction, label, layout, manual, marketing, modern, offer, options, order, pointer, process, product, promotion, sequence, simple, special, step, symbol, template. The prominent colors used in the PowerPoint template are Green, Gray, and White Orient teams with our Strategy Ppt Theme Arrow Practice PowerPoint Macro Steps 2 Stages 3 Design. Download without worries with our money back guaranteee.

Usa Ppt Succedent Illustration Of 9 Concepts Communication Skills PowerPoint 4 Graphic
We present our USA PPT succulent illustration of 9 concepts communication skills power point 4 Graphic. Use our Arrows PowerPoint Templates because, illustrate the means to prevent or control them using our imaginative templates. Use our Symbol PowerPoint Templates because, the core of any organization is the people who work for it. Use our Business PowerPoint Templates because, Marketing Strategy Business Template: - Maximizing sales of your product is the intended destination. Use our Shapes PowerPoint Templates because, you have the basic goal in mind. Use our Process and Flows PowerPoint Templates because; explain the process by which you intend to right it. Use these PowerPoint slides for presentations relating to abstract, age, ancient, arrow, art, artistic, background, colors, contemporary, crack, dark, decoration, design, dirt, dynamic, future, grunge, illustration, index, linear, lines, paper, pattern, pointer, poster, retro, scratch, sign, symbol. The prominent colors used in the PowerPoint template are Blue, Gray, and Black Progress is inevitable with our Usa Ppt Succedent Illustration Of 9 Concepts Communication Skills PowerPoint 4 Graphic. Download without worries with our money back guaranteee.
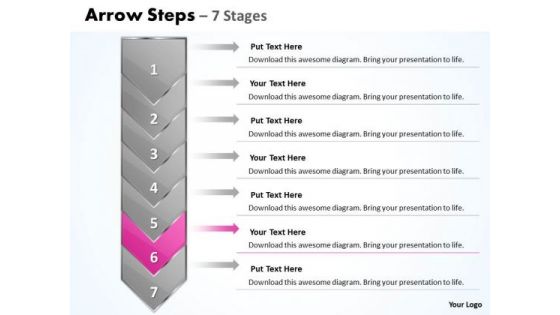
Flow Ppt Theme Arrow 7 Stages 1 Business Management PowerPoint Image
We present our flow PPT Theme arrow 7 stages 1 business management power point Image. Use our Advertising PowerPoint Templates because, There are so many different pieces to the puzzle. Use our Arrows PowerPoint Templates because; Use our templates for your colleagues knowledge to feed. Use our Shapes PowerPoint Templates because, The Venn graphic comprising interlinking circles geometrically demonstrate how various functions operating independently, to a large extent, are essentially interdependent. Use our Business PowerPoint Templates because, Marketing Strategy Business Template: - Maximizing sales of your product is the intended destination. Use our Process and Flows PowerPoint Templates because, To take it along a sure fire road to good profit. Use these PowerPoint slides for presentations relating to advertising, arrow, background, banner, blue, bookmark, card, choice, concept, creative, design, direction, flow, label, manual, marketing, modern, next, number, offer, page, paper, pointer, process, product, promotion, sequence, simple, step, symbol. The prominent colors used in the PowerPoint template are Pink, Gray, and Black Implement plans with our Flow Ppt Theme Arrow 7 Stages 1 Business Management PowerPoint Image. Download without worries with our money back guaranteee.
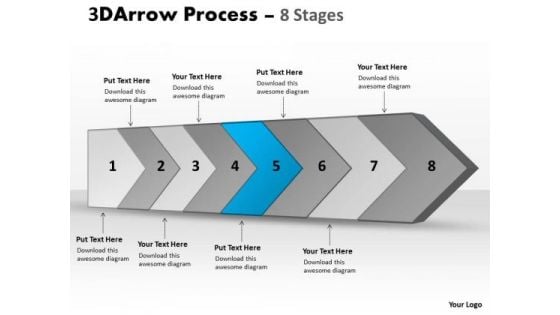
Ppt Theme Continous Business Representation Magazines PowerPoint Tips Flow Diagram 6 Design
We present our PPT Theme continuous business representation magazines PowerPoint tips flow diagram 6 designs. Use our Arrows PowerPoint Templates because; Get your listeners to put on their thinking caps. Use our Symbol PowerPoint Templates because, now spread the fruits of your efforts and elaborate your ideas on the prevention, diagnosis, control and cure of prevalent diseases. Use our Business PowerPoint Templates because, Marketing Strategy Business Template: - Maximizing sales of your product is the intended destination. Use our Process and Flows PowerPoint Templates because, you understand the ailment and how to fight it. Use our Marketing PowerPoint Templates because; Use our templates for your colleague's knowledge to feed. Use these PowerPoint slides for presentations relating to Arrow, Process, Business, Circle, Circular, Collection, Connection, Cursor, Decoration, Design, Dimensional, Direction, Element, Icon, Illustration, Information, Modern, Motion, Paper, Perspective, Plastic, Pointer, Pointing, Recycle, Recycling, Reflective, Set, Shape, Shiny, Sign, Symbol, Technology. The prominent colors used in the PowerPoint template are Blue, Gray, and Black Train your team with our Ppt Theme Continous Business Representation Magazines PowerPoint Tips Flow Diagram 6 Design. Download without worries with our money back guaranteee.

Ppt 11 Steps Working With Slide Numbers Straight Line Linear Arrows Process Graphic
We present our PPT 11 steps working with slide numbers straight line linear arrows Process Graphic. Use our Arrows PowerPoint Templates because, Puzzles or Jigsaw Template: - It is all there in bits and pieces. Use our Signs PowerPoint Templates because; Illustrate these thoughts with this slide. Use our Process and Flows PowerPoint Templates because, Health of the determines the quality of our lives. Use our Metaphor PowerPoint Templates because; Use our templates to lustrate your ability. Use our Business PowerPoint Templates because, The pyramid is a symbol of the desire to reach the top in a steady manner. Use these PowerPoint slides for presentations relating to Abstract, Age, Ancient, Antique, Arrows, Art, Artistic, Background, Colors, Decoration, Design, Dynamic, Elegant, Element, Future, Illustration, Index, Linear, Lines, Modern, Old, Paper, Pattern, Scratch, Text, Texture, Up, Vintage. The prominent colors used in the PowerPoint template are Brown, Tan, White Define growth with our Ppt 11 Steps Working With Slide Numbers Straight Line Linear Arrows Process Graphic. Download without worries with our money back guaranteee.
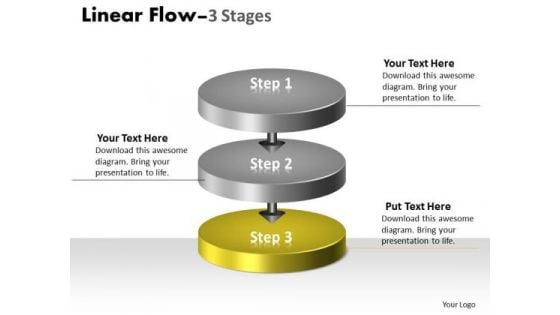
Ppt Background Vertical Steps For Free Idea Strategy 4 Design
We present our PPT Background vertical Steps for free idea strategy 4 design. Use our Circle Charts PowerPoint Templates because, Spread the light of knowledge around you, clear the doubts and enlighten the questioning minds with your brilliance and ability. Use our Arrows PowerPoint Templates because, But you have an idea of which you are sure. Use our Communication PowerPoint Templates because, the structure of our templates allows you to effectively highlight the key issues concerning the growth of your business. Use our Layers PowerPoint Templates because, you have the right arrows in your quiver. Use our Business PowerPoint Templates because; transmit your passion via our creative templates. Use these PowerPoint slides for presentations relating to background, blog, business, chain, communication, community, concept, connection, constructive, contact, design, flow, interaction, internet, line, linear, location, logistic, modern, movement, network, path, pointer, reaction, structure, system, team, . The prominent colors used in the PowerPoint template are Yellow, Gray, and Black Exceed expectations with our Ppt Background Vertical Steps For Free Idea Strategy 4 Design. Download without worries with our money back guaranteee.
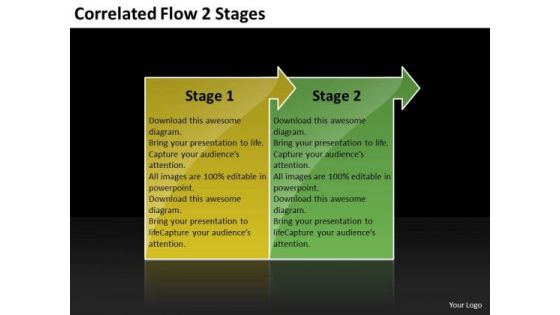
Correlated Flow 2 Stages Oil Chart PowerPoint Slides
We present our correlated flow 2 stages oil chart PowerPoint Slides. Use our Arrows PowerPoint Templates because, Weak Links & Chains:- Chain reactions and the element of teamwork add value to your efforts. Use our Symbol PowerPoint Templates because, However there is a key aspect to be emphasized. Use our Business PowerPoint Templates because, Marketing Strategy Business Template:- Maximizing sales of your product is the intended destination. Use our Metaphor PowerPoint Templates because, are truly some of the wonders of our life. Use our Process and Flows PowerPoint Templates because, you have understood the essence of this chain reaction like sequence of events. Use these PowerPoint slides for presentations relating to Arrow, Background, Banner, Blue, Bookmark, Card, Choice, Concept, Corporate, Creative, Design, Direction, Flow, Green, Illustration, Info graphic, Instruction, Label, Layout, Manual, Modern, Number, Offer, One, Options, Order, Page, Paper, Pointer, Product, Progress, Promotion, Red, Retro, Sequence, Simple, Special, Step, Symbol, Tab, Tag, Template, Three, Tutorial, Two, Vector, Version. The prominent colors used in the PowerPoint template are Green, Yellow, and Black Our Correlated Flow 2 Stages Oil Chart PowerPoint Slides capture the attention of your audience. With our money back guarantee you have nothing to lose.
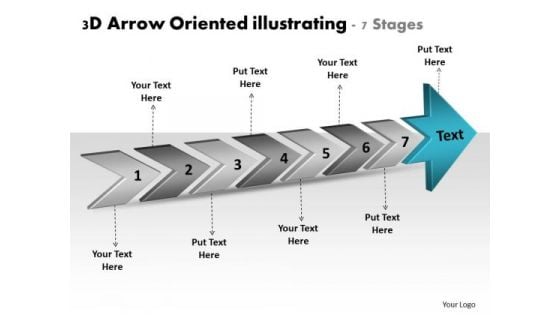
3d Arrow Oriented Illustrating 7 Stages Free Flowchart PowerPoint Slides
We present our 3d arrow oriented illustrating 7 stages free flowchart PowerPoint Slides. Use our Marketing PowerPoint Templates because; represent the progress in our lives. Use our Business PowerPoint Templates because, Present your views using our innovative slides and be assured of leaving a lasting impression. Use our Shapes PowerPoint Templates because, you know your business and have a vision for it. Use our Process and Flows PowerPoint Templates because, Gears interconnected: - The Gear Train is a basic element of living and daily business. Use our Arrows PowerPoint Templates because; Use this template to explain the value of its wellness to human life. Use these PowerPoint slides for presentations relating to Advertising, arrow, background, banner, bookmark, choice, concept, creative, design, direction, flow, illustration, instruction, label, layout, manual, marketing, modern, next, offer, options, order, pointer, process, product, promotion, sequence, simple, special, symbol, template, tutorial, two, vector, version, website. The prominent colors used in the PowerPoint template are Blue, Gray, and White Intensify growth with our 3d Arrow Oriented Illustrating 7 Stages Free Flowchart PowerPoint Slides. Download without worries with our money back guaranteee.

Circular Interpretation Of 5 Steps Involved Procedure System Flow Charts PowerPoint Slides
We present our circular interpretation of 5 steps involved procedure system flow charts PowerPoint Slides.Use our Advertising PowerPoint Templates because,It depicts Rolling along while gathering profits along the way is the aim. Use our Circle Charts PowerPoint Templates because, This Diagram pinpoints the critical paths and areas in your process and set the timelines for their completion Use our Arrows PowerPoint Templates because,You can present your opinions in this field using our impressive templates. Use our Business PowerPoint Templates because,The fruits of your labour are beginning to show.Enlighten them on the great plans you have for their enjoyment Use our Shapes PowerPoint Templates because,Using this Ideas will roll along in your mind like billiard balls.Use these PowerPoint slides for presentations relating to Advertising, arrow, background, banner, bookmark, card, choice, concept, creative, design, direction, flow, idea, illustration, infographic, instruction, label, layout, manual, marketing, modern, next, number, offer, options, order, paper, process, product, promotion, sequence, simple, step, symbol, template, triangle, tutorial, vector, version, web. The prominent colors used in the PowerPoint template are Blue, Black, Gray Continue growing with our Circular Interpretation Of 5 Steps Involved Procedure System Flow Charts PowerPoint Slides. Download without worries with our money back guaranteee.
Regular Demonstration Using Horizontal Arrows 12 Stages Flow Chart System PowerPoint Slides
We present our regular demonstration using horizontal arrows 12 stages flow chart system PowerPoint Slides.Use our Arrows PowerPoint Templates because,One pushes the other till it all comes back full circle. Use our Business PowerPoint Templates because,Watch the excitement levels rise as they realise their worth. Use our Leadership PowerPoint Templates because, Our Template designs are State of the Art. Use our Shapes PowerPoint Templates because,You have the ability to think out of the box. It helps you maintain your unique identity. Use our Process and Flows PowerPoint Templates because, You can enlighten your skills with the help of our topical templates.Use these PowerPoint slides for presentations relating to 3d, abstract, around, arrows, blue, border, business, center, circle, circular, concept, connections, copy, curve, cycle, directions, distribution, illustration, management, middle, objects, pieces, plan, pointing, process, recycle, rounded, shadows, space, system. The prominent colors used in the PowerPoint template are Blue, Gray, Black Conceive plans with our Regular Demonstration Using Horizontal Arrows 12 Stages Flow Chart System PowerPoint Slides. Download without worries with our money back guaranteee.
Business Planning Strategy To Many Process Diagram International Marketing Concepts
We present our business planning strategy to many process diagram international marketing concepts.Use our Process and Flows PowerPoint Templates because They will Put the wind in your sails. Skim smoothly over the choppy waters of the market. Download our Flow Charts PowerPoint Templates because Our PowerPoint Templates and Slides will Embellish your thoughts. They will help you illustrate the brilliance of your ideas. Present our Business PowerPoint Templates because Our PowerPoint Templates and Slides offer you the widest possible range of options. Use our Marketing PowerPoint Templates because It will Raise the bar of your Thoughts. They are programmed to take you to the next level. Download our Success PowerPoint Templates because It will Strengthen your hand with your thoughts. They have all the aces you need to win the day.Use these PowerPoint slides for presentations relating to Business, chart, circle, color, colorfull, concept, connect,connection, control, cycle, data, diagram, direction, explanation,flow, flowchart, graph, graphic, idea, illustration, information, link, management,mapping, marketing, model, organization, plan, present, presentation, process, process chart, relate, report,step, team, tool, topic, vector, work. The prominent colors used in the PowerPoint template are Green, Gray, Black. Publicize your views with our Business Planning Strategy To Many Process Diagram International Marketing Concepts. Download without worries with our money back guaranteee.
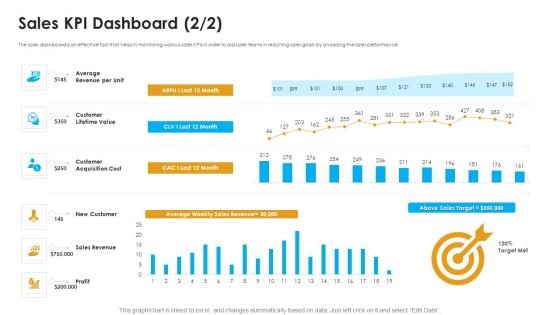
Sales Assistance Boost Overall Efficiency Sales KPI Dashboard New Topics PDF
The sales dashboard is an effective tool that helps in monitoring various sales KPIs in order to aid sales teams in reaching sales goals by analyzing the sales performance. Deliver and pitch your topic in the best possible manner with this sales assistance boost overall efficiency sales kpi dashboard new topics pdf. Use them to share invaluable insights on customer acquisition cost, customer lifetime value, average revenue and impress your audience. This template can be altered and modified as per your expectations. So, grab it now.
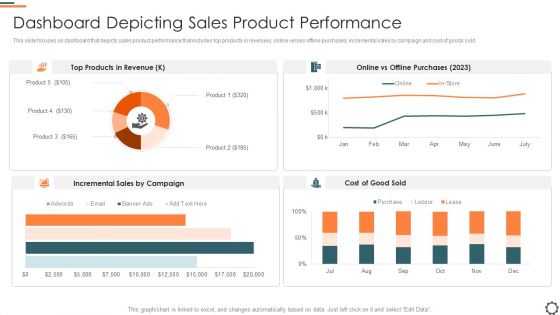
Agile Group For Product Development Dashboard Depicting Sales Product Performance Pictures PDF
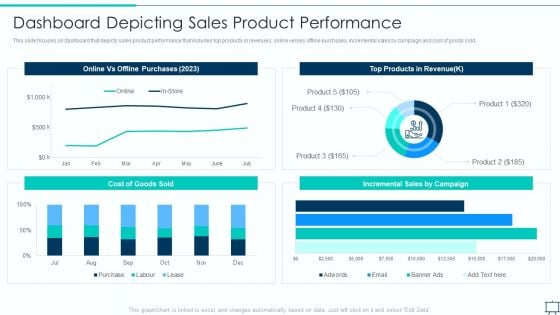
This slide focuses on dashboard that depicts sales product performance that includes top products in revenues, online verses offline purchases, incremental sales by campaign and cost of goods sold. Deliver and pitch your topic in the best possible manner with this agile group for product development dashboard depicting sales product performance pictures pdf. Use them to share invaluable insights on dashboard depicting sales product performance and impress your audience. This template can be altered and modified as per your expectations. So, grab it now.
Formulating Competitive Plan Of Action For Effective Product Leadership Dashboard Depicting Sales Topics PDF
This slide focuses on dashboard that depicts sales product performance that includes top products in revenues, online verses offline purchases, incremental sales by campaign and cost of goods sold. Deliver and pitch your topic in the best possible manner with this formulating competitive plan of action for effective product leadership dashboard depicting sales topics pdf. Use them to share invaluable insights on dashboard depicting sales product performance and impress your audience. This template can be altered and modified as per your expectations. So, grab it now.
Logistics Firm Fleet Dashboard With Pick Up Status Introduction PDF
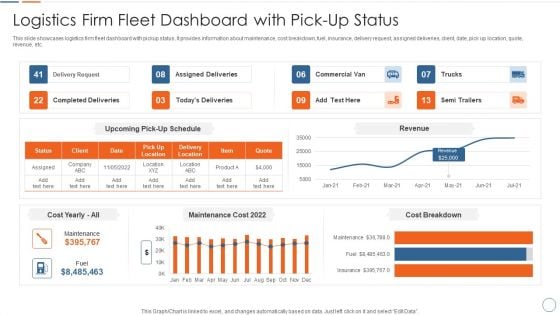
This slide showcases logistics firm fleet dashboard with pickup status. It provides information about maintenance, cost breakdown, fuel, insurance, delivery request, assigned deliveries, client, date, pick up location, quote, revenue, etc. Pitch your topic with ease and precision using this Logistics Firm Fleet Dashboard With Pick Up Status Introduction PDF. This layout presents information on Logistics Firm Fleet Dashboard With Pick Up Status. It is also available for immediate download and adjustment. So, changes can be made in the color, design, graphics or any other component to create a unique layout.
Yearly Outcomes Summary Of Profit And Loss Trends Icons PDF
This slide shows the graphical representation of result summary of profit and loss trends for five consecutive years that shows revenues, cost of goods sold, selling, general and administrative expenses, net income, etc.Pitch your topic with ease and precision using this Yearly Outcomes Summary Of Profit And Loss Trends Icons PDF This layout presents information on Earned Maximum, Selling General, Administrative Expenses It is also available for immediate download and adjustment. So, changes can be made in the color, design, graphics or any other component to create a unique layout.
Client Helpline Dashboard With Retention Rate Ppt Gallery Ideas PDF
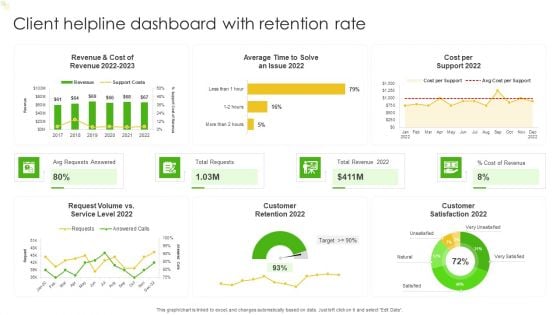
This graph or chart is linked to excel, and changes automatically based on data. Just left click on it and select Edit Data. Pitch your topic with ease and precision using this Client Helpline Dashboard With Retention Rate Ppt Gallery Ideas PDF. This layout presents information on Cost per Support 2022, Total Requests, Total Revenue 2022, Avg Requests Answered. It is also available for immediate download and adjustment. So, changes can be made in the color, design, graphics or any other component to create a unique layout.

Business Performance Review Dashboard To Measure Overall Business Performance Formats PDF
The following slide highlights a comprehensive quarterly business review QBR dashboard which can be used by the organization to evaluate business performance. The metrics used for review are total revenue, new customers, gross profit, overall costs, sales comparison, sales by different products and top performing channels. Showcasing this set of slides titled Business Performance Review Dashboard To Measure Overall Business Performance Formats PDF. The topics addressed in these templates are Sales Comparison, Sales Product, High Performing. All the content presented in this PPT design is completely editable. Download it and make adjustments in color, background, font etc. as per your unique business setting.
Online Marketing Activities KPI Dashboard To Improve Sales Ideas PDF
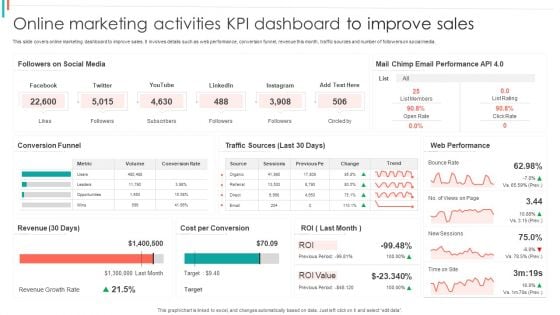
This slide covers online marketing dashboard to improve sales. It involves details such as web performance, conversion funnel, revenue this month, traffic sources and number of followers on social media.Pitch your topic with ease and precision using this Online Marketing Activities KPI Dashboard To Improve Sales Ideas PDF. This layout presents information on Email Performance, Web Performance, Cost Conversion. It is also available for immediate download and adjustment. So, changes can be made in the color, design, graphics or any other component to create a unique layout.


 Continue with Email

 Home
Home


