Financial Kpis
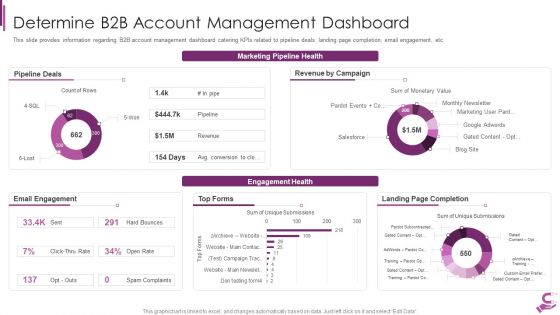
B2B Demand Generation Best Practices Determine B2B Account Management Dashboard Themes PDF
This slide provides information regarding B2B account management dashboard catering KPIs related to pipeline deals, landing page completion, email engagement, etc. Deliver and pitch your topic in the best possible manner with this b2b demand generation best practices determine b2b account management dashboard themes pdf. Use them to share invaluable insights on pipeline deals, revenue by campaign, email engagement, landing page completion, top forms and impress your audience. This template can be altered and modified as per your expectations. So, grab it now.

Digital Enterprise Management Content Ppt PowerPoint Presentation Layouts Graphics Design PDF
Presenting digital enterprise management content ppt powerpoint presentation layouts graphics design pdf to provide visual cues and insights. Share and navigate important information on seven stages that need your due attention. This template can be used to pitch topics like introduction, strategy and applications, business models, revenue model, payment methodologies, implementation, kpis and dashboard. In addition, this PPT design contains high-resolution images, graphics, etc, that are easily editable and available for immediate download.
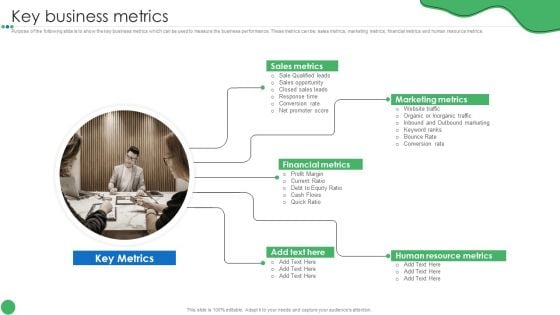
Key Business Metrics Guide To Enhance Organic Growth By Advancing Business Procedures Professional PDF
Purpose of the following slide is to show the key business metrics which can be used to measure the business performance. These metrics can be sales metrics, marketing metrics, financial metrics and human resource metrics.This is a Key Business Metrics Guide To Enhance Organic Growth By Advancing Business Procedures Professional PDF template with various stages. Focus and dispense information on five stages using this creative set, that comes with editable features. It contains large content boxes to add your information on topics like Marketing Metrics, Financial Metrics, Human Resource. You can also showcase facts, figures, and other relevant content using this PPT layout. Grab it now.

Key Performance Indicator Analytics Dashboard Ppt PowerPoint Presentation Model Example Topics
This is a key performance indicator analytics dashboard ppt powerpoint presentation model example topics. This is a five stage process. The stages in this process are kpi proposal, kpi plan, kpi scheme.
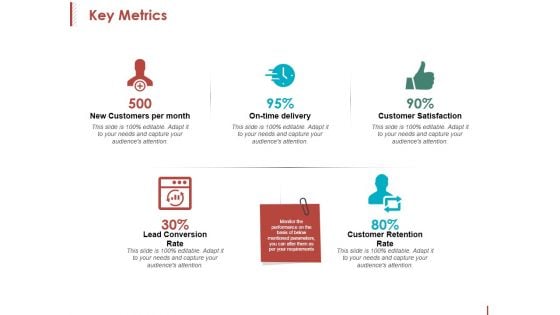
Key Metrics Ppt PowerPoint Presentation Inspiration Format
This is a key metrics ppt powerpoint presentation inspiration format. This is a five stage process. The stages in this process are new customers per month, on time delivery, customer satisfaction, customer retention rate.
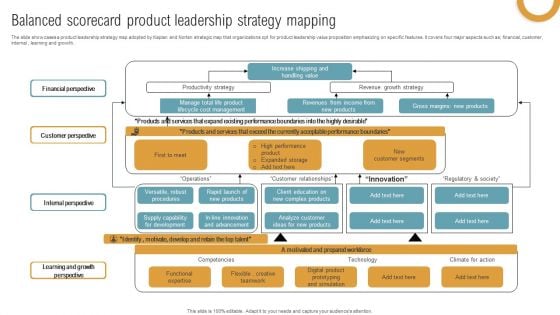
Balanced Scorecard Product Leadership Strategy Mapping Inspiration PDF
The slide showcases a product leadership strategy map adopted by Kaplan and Norten strategic map that organizations opt for product leadership value proposition emphasizing on specific features. It covers four major aspects such as financial, customer, internal , learning and growth. Pitch your topic with ease and precision using this Balanced Scorecard Product Leadership Strategy Mapping Inspiration PDF. This layout presents information on Customer Perspective, Financial Perspective, Internal Perspective. It is also available for immediate download and adjustment. So, changes can be made in the color, design, graphics or any other component to create a unique layout.
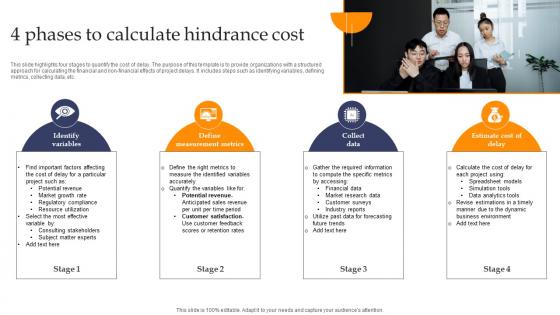
4 Phases To Calculate Hindrance Cost Structure pdf
This slide highlights four stages to quantify the cost of delay. The purpose of this template is to provide organizations with a structured approach for calculating the financial and non-financial effects of project delays. It includes steps such as identifying variables, defining metrics, collecting data, etc. Pitch your topic with ease and precision using this 4 Phases To Calculate Hindrance Cost Structure pdf. This layout presents information on Identify Variables, Define Measurement Metrics, Collect Data . It is also available for immediate download and adjustment. So, changes can be made in the color, design, graphics or any other component to create a unique layout. This slide highlights four stages to quantify the cost of delay. The purpose of this template is to provide organizations with a structured approach for calculating the financial and non-financial effects of project delays. It includes steps such as identifying variables, defining metrics, collecting data, etc.
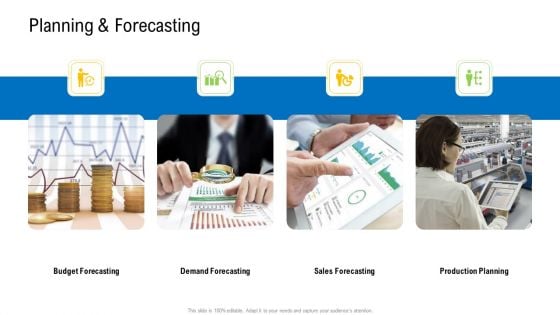
Viable Logistics Network Management Planning And Forecasting Summary PDF
Presenting viable logistics network management non financial measures introduction pdf to provide visual cues and insights. Share and navigate important information on four stages that need your due attention. This template can be used to pitch topics like performance measures. In addtion, this PPT design contains high resolution images, graphics, etc, that are easily editable and available for immediate download.
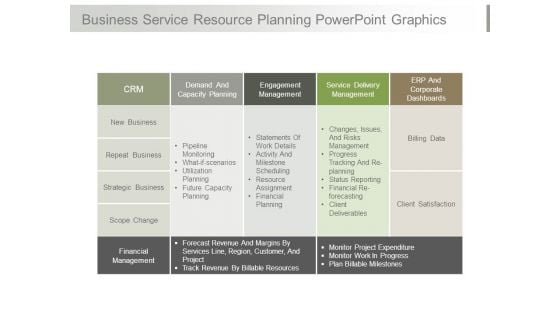
Business Service Resource Planning Powerpoint Graphics
This is a business service resource planning powerpoint graphics. This is a four stage process. The stages in this process are crm, demand and capacity planning, engagement management, service delivery management, erp and corporate dashboards, new business, repeat business, strategic business, scope change, pipeline monitoring, what if scenarios, utilization planning, future capacity planning, statements of work details, activity and milestone scheduling, resource assignment, financial planning, changes, issues, and risks management, progress tracking and re planning, status reporting, financial re forecasting, client deliverables, billing data, client satisfaction, financial management, forecast revenue and margins by services line region customer and project, track revenue by billable resources, monitor project expenditure, monitor work in progress, plan billable milestones.
KPI Metrics Vector Icon Ppt PowerPoint Presentation Layouts Slide
This is a kpi metrics vector icon ppt powerpoint presentation layouts slide. This is a three stage process. The stages in this process are kpi proposal, kpi plan, kpi scheme.
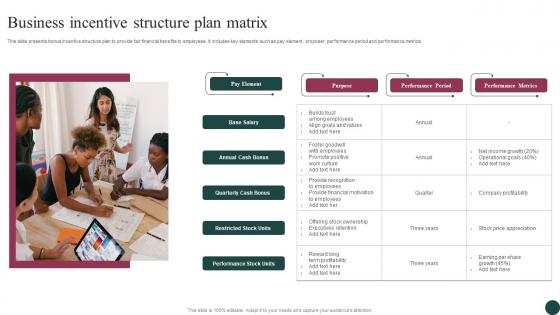
Business Incentive Structure Plan Matrix Slides Pdf
This slide presents bonus incentive structure plan to provide fair financial benefits to employees. It includes key elements such as pay element, proposer, performance period and performance metrics. Showcasing this set of slides titled Business Incentive Structure Plan Matrix Slides Pdf. The topics addressed in these templates are Annual Cash Bonus, Quarterly Cash Bonus, Restricted Stock Units. All the content presented in this PPT design is completely editable. Download it and make adjustments in color, background, font etc. as per your unique business setting. This slide presents bonus incentive structure plan to provide fair financial benefits to employees. It includes key elements such as pay element, proposer, performance period and performance metrics.
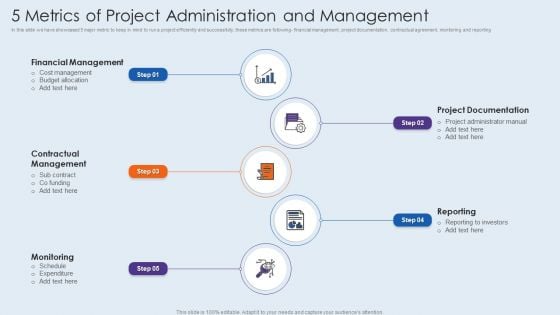
5 Metrics Of Project Administration And Management Structure PDF
In this slide we have showcased 5 major metric to keep in mind to run a project efficiently and successfully, these metrics are following financial management, project documentation, contractual agreement, monitoring and reporting. Persuade your audience using this 5 metrics of project administration and management structure pdf. This PPT design covers five stages, thus making it a great tool to use. It also caters to a variety of topics including financial management, contractual management, monitoring. Download this PPT design now to present a convincing pitch that not only emphasizes the topic but also showcases your presentation skills.
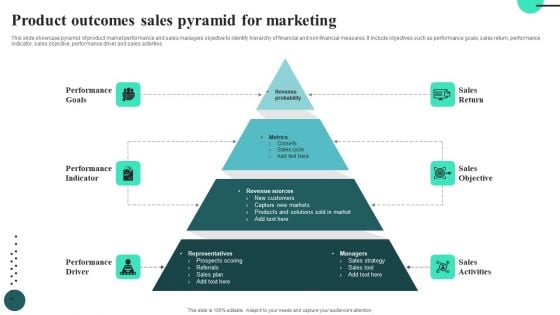
Product Outcomes Sales Pyramid For Marketing Information PDF
This slide showcase pyramid of product market performance and sales managers objective to identify hierarchy of financial and non financial measures. It include objectives such as performance goals, sales return, performance indicator, sales objective, performance driver and sales activities.Presenting Product Outcomes Sales Pyramid For Marketing Information PDF to dispense important information. This template comprises four stages. It also presents valuable insights into the topics including Sales Return, Sales Objective. This is a completely customizable PowerPoint theme that can be put to use immediately. So, download it and address the topic impactfully.
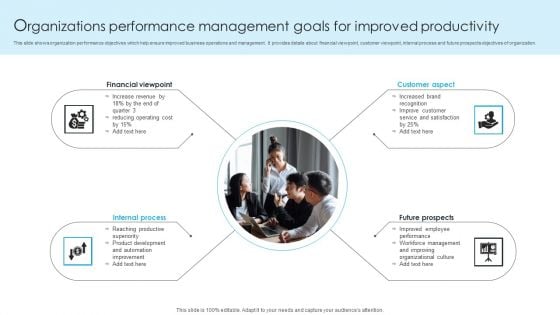
Organizations Performance Management Goals For Improved Productivity Ppt PowerPoint Presentation Summary Display PDF
This slide shows organization performance objectives which help ensure improved business operations and management. It provides details about financial viewpoint, customer viewpoint, internal process and future prospects objectives of organization. Presenting Organizations Performance Management Goals For Improved Productivity Ppt PowerPoint Presentation Summary Display PDF to dispense important information. This template comprises four stages. It also presents valuable insights into the topics including Financial Viewpoint, Customer Aspect, Internal Process. This is a completely customizable PowerPoint theme that can be put to use immediately. So, download it and address the topic impactfully.
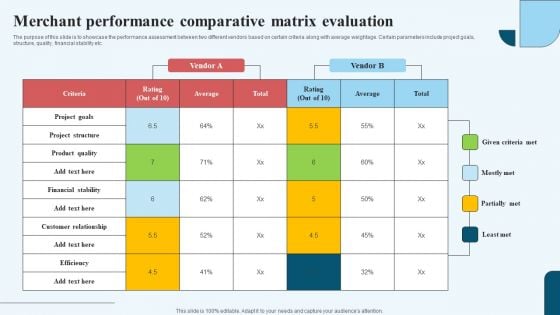
Merchant Performance Comparative Matrix Evaluation Sample PDF
The purpose of this slide is to showcase the performance assessment between two different vendors based on certain criteria along with average weightage. Certain parameters include project goals, structure, quality, financial stability etc. Pitch your topic with ease and precision using this Merchant Performance Comparative Matrix Evaluation Sample PDF. This layout presents information on Product Quality, Project Goals, Financial Stability. It is also available for immediate download and adjustment. So, changes can be made in the color, design, graphics or any other component to create a unique layout.
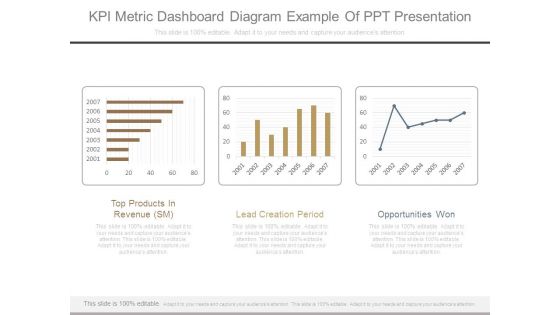
Kpi Metric Dashboard Diagram Example Of Ppt Presentation
This is a kpi metric dashboard diagram example of ppt presentation. This is a three stage process. The stages in this process are top products in revenue sm, lead creation period, opportunities won.
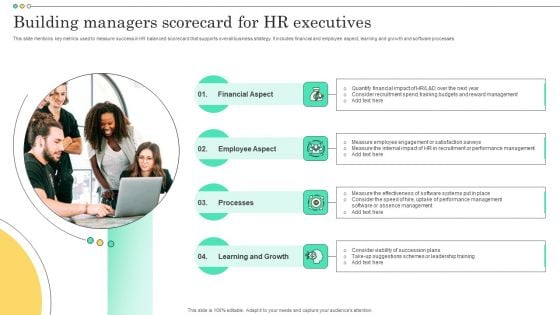
Building Managers Scorecard For HR Executives Ideas PDF

Market Entry Strategy Clubs Industry Analytics Dashboard For Gym Health And Fitness Clubs Summary PDF
This slide covers the Key performance indicators for analysing social media platforms, email campaigns and website performance. Presenting market entry strategy clubs industry analytics dashboard for gym health and fitness clubs summary pdf to provide visual cues and insights. Share and navigate important information on seven stages that need your due attention. This template can be used to pitch topics like Analytics Dashboard for Gym Health and Fitness Clubs. In addtion, this PPT design contains high-resolution images, graphics, etc, that are easily editable and available for immediate download.
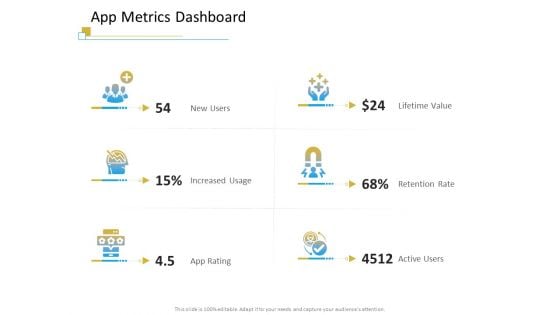
Successful Mobile Strategies For Business App Metrics Dashboard Microsoft PDF
Presenting successful mobile strategies for business app metrics dashboard microsoft pdf to provide visual cues and insights. Share and navigate important information on six stages that need your due attention. This template can be used to pitch topics like app metrics dashboard. In addtion, this PPT design contains high resolution images, graphics, etc, that are easily editable and available for immediate download.
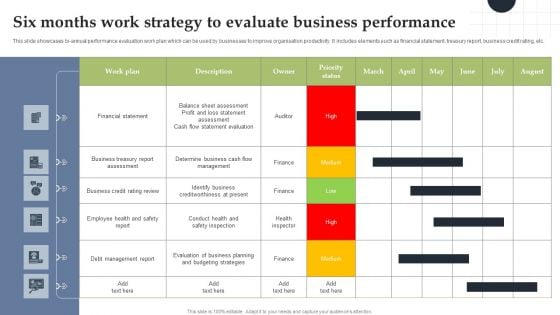
Six Months Work Strategy To Evaluate Business Performance Themes PDF
This slide showcases bi-annual performance evaluation work plan which can be used by businesses to improve organisation productivity. It includes elements such as financial statement, treasury report, business credit rating, etc. Pitch your topic with ease and precision using this Six Months Work Strategy To Evaluate Business Performance Themes PDF. This layout presents information on Financial Statement, Treasury Report, Business Credit Rating. It is also available for immediate download and adjustment. So, changes can be made in the color, design, graphics or any other component to create a unique layout.
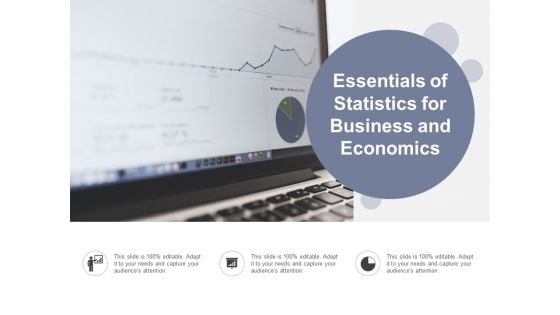
Essentials Of Statistics For Business And Economics Ppt Powerpoint Presentation Pictures Styles
This is a essentials of statistics for business and economics ppt powerpoint presentation pictures styles. This is a three stage process. The stages in this process are business metrics, business kpi, business dashboard.
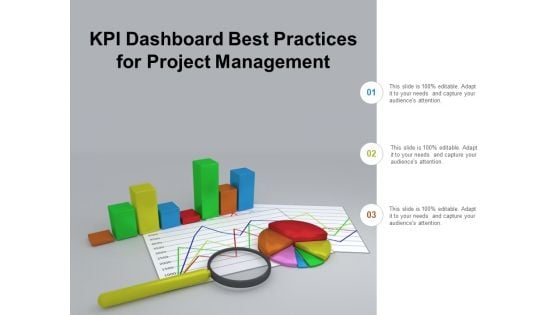
Kpi Dashboard Best Practices For Project Management Ppt Powerpoint Presentation Outline Samples
This is a kpi dashboard best practices for project management ppt powerpoint presentation outline samples. This is a three stage process. The stages in this process are business metrics, business kpi, business dashboard.

HR Scoreboard Call Center Template PDF
The purpose of this slide is to outline the balanced HR scorecard in order to monitor day-to-day key operations. It includes several key performance indicators such as financial, customer, organizational structure, and capacity. Showcasing this set of slides titled HR Scoreboard Call Center Template PDF. The topics addressed in these templates are Financial Sustainability, Customer Experience, Internal Structures. All the content presented in this PPT design is completely editable. Download it and make adjustments in color, background, font etc. as per your unique business setting.
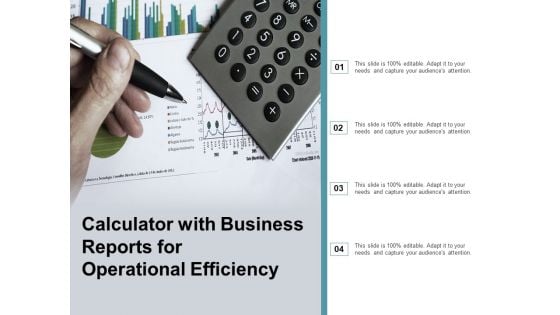
Calculator With Business Reports For Operational Efficiency Ppt Powerpoint Presentation Ideas Infographic Template
This is a calculator with business reports for operational efficiency ppt powerpoint presentation ideas infographic template. This is a four stage process. The stages in this process are business metrics, business kpi, business dashboard.
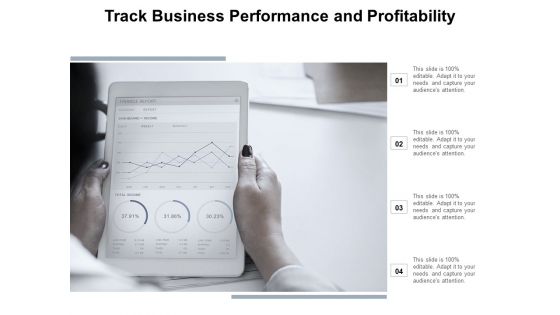
Track Business Performance And Profitability Ppt Powerpoint Presentation File Master Slide
This is a track business performance and profitability ppt powerpoint presentation file master slide. This is a four stage process. The stages in this process are business metrics, business kpi, business dashboard.
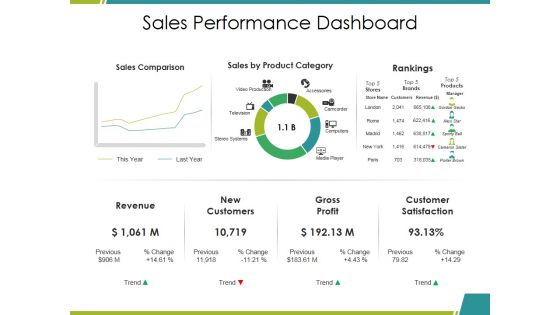
Sales Performance Dashboard Ppt PowerPoint Presentation Infographics Mockup
This is a sales performance dashboard ppt powerpoint presentation infographics mockup. This is a three stage process. The stages in this process are sales comparison, sales by product category, rankings, revenue, gross profit.
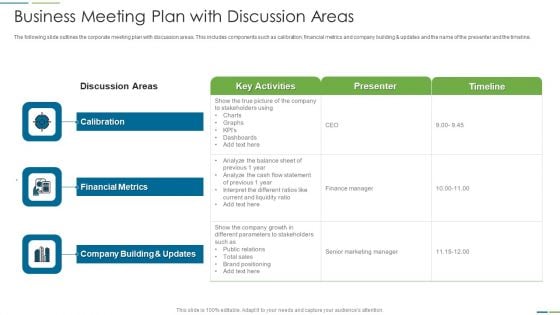
Business Meeting Plan With Discussion Areas Diagrams PDF
The following slide outlines the corporate meeting plan with discussion areas. This includes components such as calibration, financial metrics and company building and updates and the name of the presenter and the timeline.Showcasing this set of slides titled business meeting plan with discussion areas diagrams pdf The topics addressed in these templates are financial metrics, company building and updates, calibration All the content presented in this PPT design is completely editable. Download it and make adjustments in color, background, font etc. as per your unique business setting.
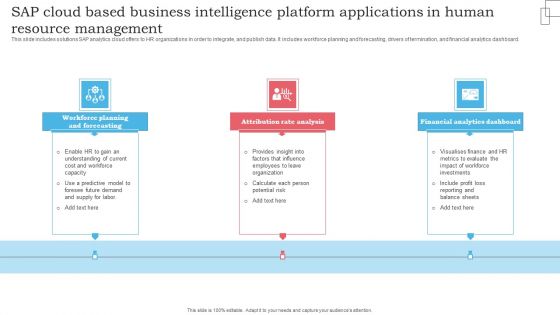
SAP Cloud Based Business Intelligence Platform Applications In Human Resource Management Microsoft PDF
This slide includes solutions SAP analytics cloud offers to HR organizations in order to integrate, and publish data. It includes workforce planning and forecasting, drivers of termination, and financial analytics dashboard. Presenting SAP Cloud Based Business Intelligence Platform Applications In Human Resource Management Microsoft PDF to dispense important information. This template comprises three stages. It also presents valuable insights into the topics including Workforce Planning Forecasting, Attribution Rate Analysis, Financial Analytics Dashboard. This is a completely customizable PowerPoint theme that can be put to use immediately. So, download it and address the topic impactfully.
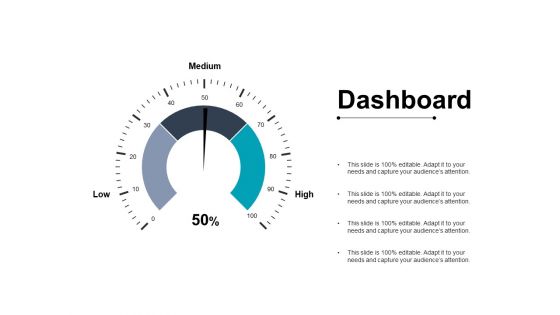
Dashboard Marketing Planning Ppt PowerPoint Presentation Slides Slideshow
This is a dashboard marketing planning ppt powerpoint presentation slides slideshow. This is a three stage process. The stages in this process are dashboard, finance, analysis, business, investment.
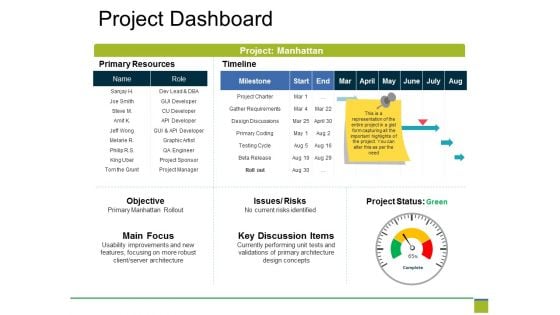
Project Dashboard Ppt PowerPoint Presentation Professional Show
This is a project dashboard ppt powerpoint presentation professional show. This is a six stage process. The stages in this process are primary resources, timeline, objective, main focus, key discussion items.
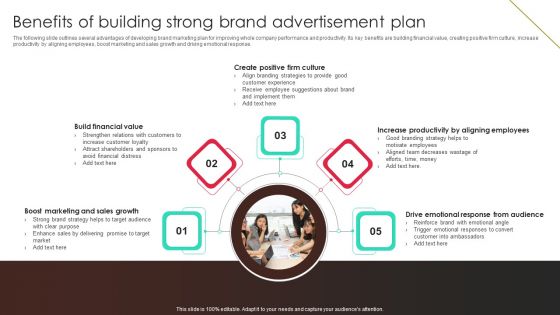
Benefits Of Building Strong Brand Advertisement Plan Designs PDF
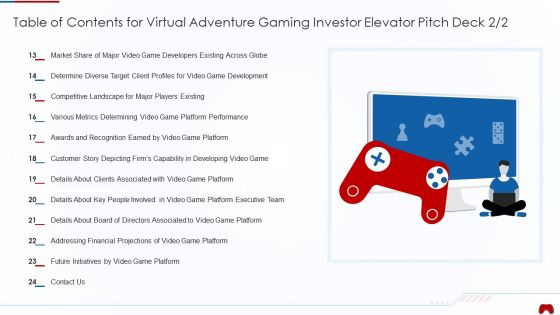
Table Of Contents For Virtual Adventure Gaming Investor Elevator Pitch Deck Capability Professional PDF
This slide caters details about financial projections of video game platform progress for next years with gross profit, EBITDA, Y or Y growth, net income. Deliver and pitch your topic in the best possible manner with this table of contents for virtual adventure gaming investor elevator pitch deck capability professional pdf. Use them to share invaluable insights on financial projections, capability, developing, metrics, competitive landscape, target and impress your audience. This template can be altered and modified as per your expectations. So, grab it now.
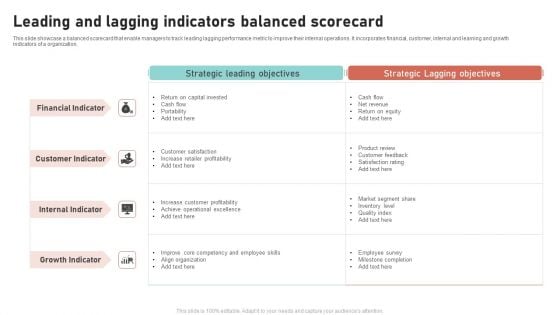
Leading And Lagging Indicators Balanced Scorecard Pictures PDF
This slide showcase a balanced scorecard that enable managers to track leading lagging performance metric to improve their internal operations. It incorporates financial, customer, internal and learning and growth indicators of a organization. Pitch your topic with ease and precision using this Leading And Lagging Indicators Balanced Scorecard Pictures PDF. This layout presents information on Financial Indicator, Customer Indicator, Internal Indicator, Growth Indicator. It is also available for immediate download and adjustment. So, changes can be made in the color, design, graphics or any other component to create a unique layout.
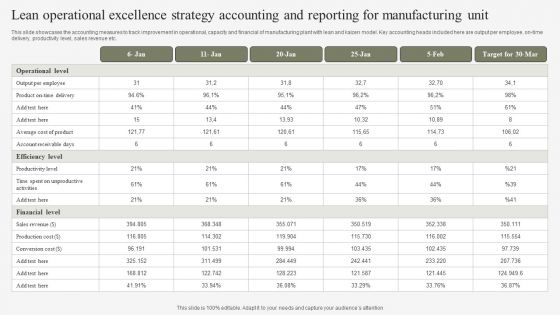
Lean Operational Excellence Strategy Accounting And Reporting For Manufacturing Unit Demonstration PDF
This slide showcases the accounting measures to track improvement in operational, capacity and financial of manufacturing plant with lean and kaizen model. Key accounting heads included here are output per employee, on-time delivery, productivity level, sales revenue etc. Pitch your topic with ease and precision using this Lean Operational Excellence Strategy Accounting And Reporting For Manufacturing Unit Demonstration PDF. This layout presents information on Operational Level, Efficiency Level, Financial Level. It is also available for immediate download and adjustment. So, changes can be made in the color, design, graphics or any other component to create a unique layout.
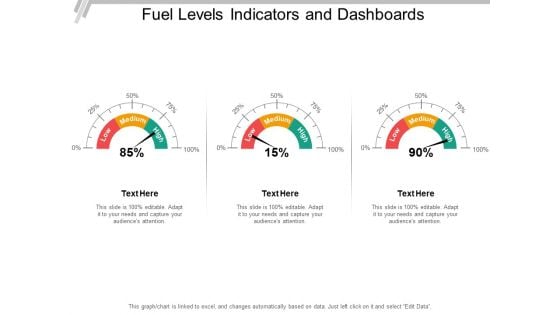
Fuel Levels Indicators And Dashboards Ppt PowerPoint Presentation Outline Skills
This is a fuel levels indicators and dashboards ppt powerpoint presentation outline skills. This is a three stage process. The stages in this process are fuel gauge, gas gauge, fuel containers.
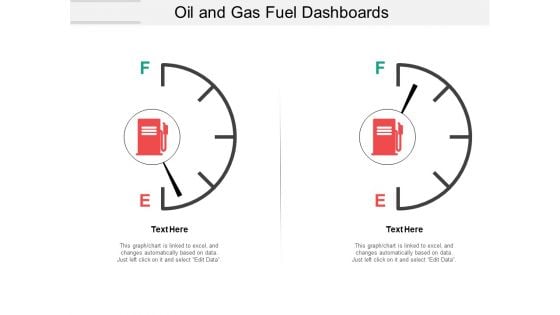
Oil And Gas Fuel Dashboards Ppt PowerPoint Presentation File Introduction
This is a oil and gas fuel dashboards ppt powerpoint presentation file introduction. This is a two stage process. The stages in this process are fuel gauge, gas gauge, fuel containers.

Car Dashboard And Speedometer Graphics Ppt PowerPoint Presentation File Graphics Template
This is a car dashboard and speedometer graphics ppt powerpoint presentation file graphics template. This is a four stage process. The stages in this process are fuel gauge, gas gauge, fuel containers.
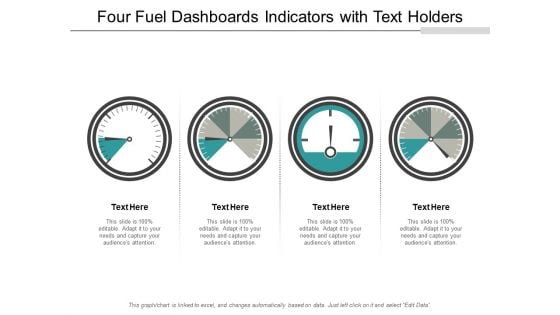
Four Fuel Dashboards Indicators With Text Holders Ppt PowerPoint Presentation File Graphics Design
This is a four fuel dashboards indicators with text holders ppt powerpoint presentation file graphics design. This is a four stage process. The stages in this process are fuel gauge, gas gauge, fuel containers.
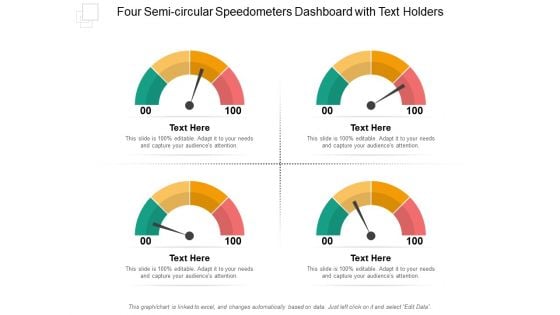
Four Semi Circular Speedometers Dashboard With Text Holders Ppt PowerPoint Presentation File Layouts
This is a four semi circular speedometers dashboard with text holders ppt powerpoint presentation file layouts. This is a four stage process. The stages in this process are fuel gauge, gas gauge, fuel containers.
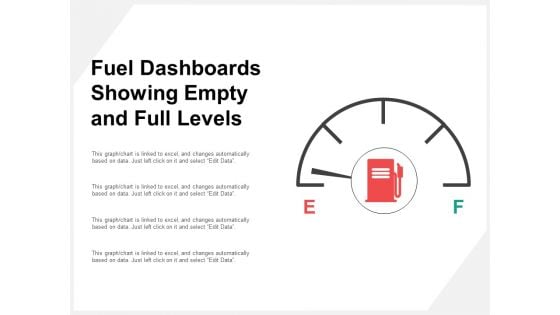
Fuel Dashboards Showing Empty And Full Levels Ppt PowerPoint Presentation Professional Slide Portrait
This is a fuel dashboards showing empty and full levels ppt powerpoint presentation professional slide portrait. This is a four stage process. The stages in this process are fuel gauge, gas gauge, fuel containers.
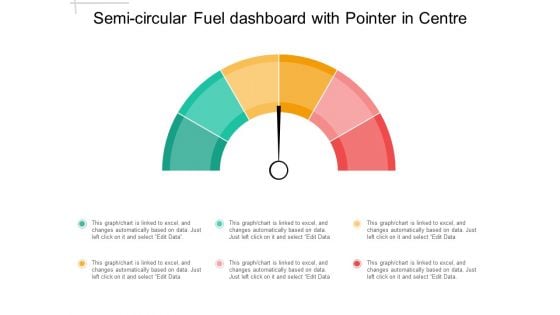
Semi Circular Fuel Dashboard With Pointer In Centre Ppt PowerPoint Presentation Outline Visuals
This is a semi circular fuel dashboard with pointer in centre ppt powerpoint presentation outline visuals. This is a three stage process. The stages in this process are fuel gauge, gas gauge, fuel containers.

Three Dashboard Speed Indicators With Text Holders Ppt PowerPoint Presentation Summary Layout
This is a three dashboard speed indicators with text holders ppt powerpoint presentation summary layout. This is a three stage process. The stages in this process are fuel gauge, gas gauge, fuel containers.
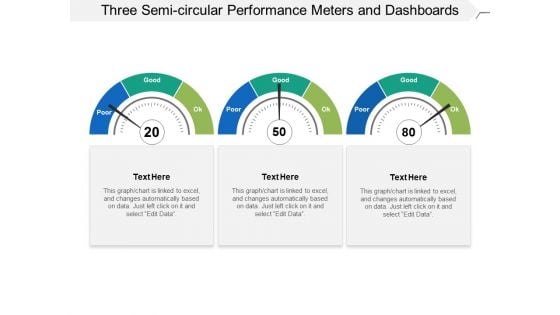
Three Semi Circular Performance Meters And Dashboards Ppt PowerPoint Presentation Slides Influencers
This is a three semi circular performance meters and dashboards ppt powerpoint presentation slides influencers. This is a three stage process. The stages in this process are fuel gauge, gas gauge, fuel containers.
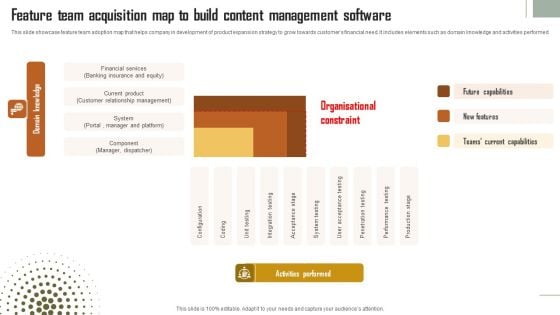
Feature Team Acquisition Map To Build Content Management Software Brochure PDF
This slide showcase feature team adoption map that helps company in development of product expansion strategy to grow towards customers financial need. It includes elements such as domain knowledge and activities performed. Showcasing this set of slides titled Feature Team Acquisition Map To Build Content Management Software Brochure PDF. The topics addressed in these templates are Financial Services, Banking Insurance And Equity, Customer Relationship Management. All the content presented in this PPT design is completely editable. Download it and make adjustments in color, background, font etc. as per your unique business setting.
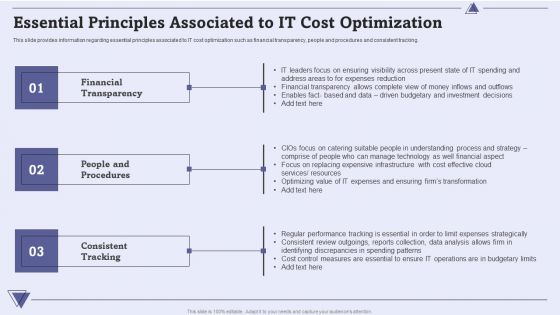
CIO For IT Cost Optimization Techniques Essential Principles Associated To IT Cost Optimization Demonstration PDF
This slide provides information regarding essential principles associated to IT cost optimization such as financial transparency, people and procedures and consistent tracking. Presenting CIO For IT Cost Optimization Techniques Essential Principles Associated To IT Cost Optimization Demonstration PDF to provide visual cues and insights. Share and navigate important information on three stages that need your due attention. This template can be used to pitch topics like Financial Transparency, Cost Control Measures, Resources. In addtion, this PPT design contains high resolution images, graphics, etc, that are easily editable and available for immediate download.

Ceo Performance Assessment And Evaluation Of Startup Companies Microsoft PDF
This slide includes performance review of a CEO of a startup. It comprises of various areas in which CEOs performance is measured, viz, Vision and Strategy, Team Leadership and Communications, Financial Oversight and General Performance Reviews. Persuade your audience using this Ceo Performance Assessment And Evaluation Of Startup Companies Microsoft PDF. This PPT design covers four stages, thus making it a great tool to use. It also caters to a variety of topics including Team Leadership And Communications, Financial Oversight, General Performance Reviews. Download this PPT design now to present a convincing pitch that not only emphasizes the topic but also showcases your presentation skills.
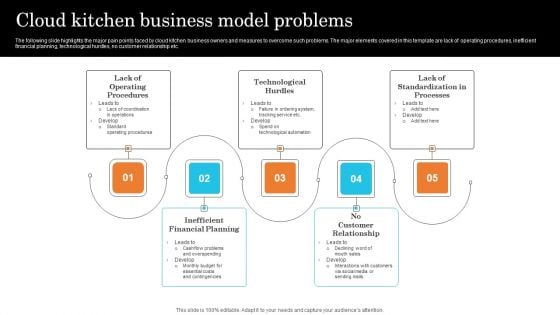
Cloud Kitchen Business Model Problems Graphics PDF
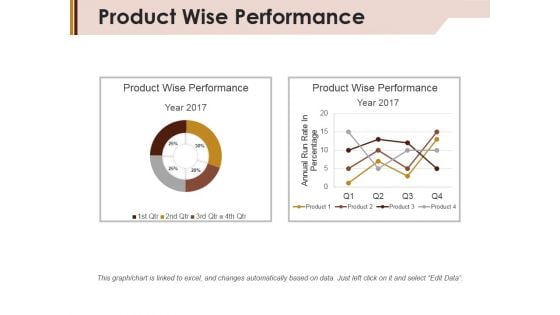
Product Wise Performance Ppt PowerPoint Presentation Show Themes
This is a product wise performance ppt powerpoint presentation show themes. This is a two stage process. The stages in this process are year, percentage, finance, business, marketing.
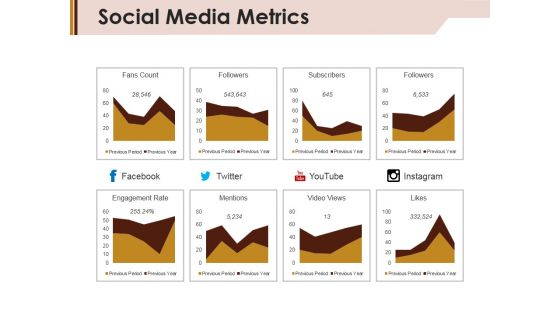
Social Media Metrics Ppt PowerPoint Presentation Ideas Graphics Example
This is a social media metrics ppt powerpoint presentation ideas graphics example. This is a eight stage process. The stages in this process are fans count, followers, subscribers, engagement rate.
Digital Customer Journey Touchpoints Effectiveness Measurement Icon Demonstration PDF
Presenting Digital And Physical Customer Touchpoints For Purchase Journey Rules PDF to dispense important information. This template comprises three stages. It also presents valuable insights into the topics including Effectiveness Measurement Icon, Digital Customer. This is a completely customizable PowerPoint theme that can be put to use immediately. So, download it and address the topic impactfully.
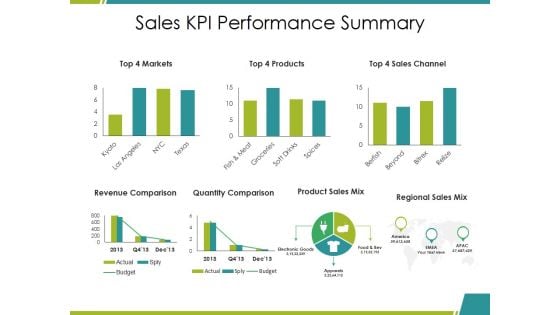
Sales Kpi Performance Summary Ppt PowerPoint Presentation Infographic Template Elements
This is a sales kpi performance summary ppt powerpoint presentation infographic template elements. This is a seven stage process. The stages in this process are revenue comparison, quantity comparison, product sales mix, regional sales mix, budget.
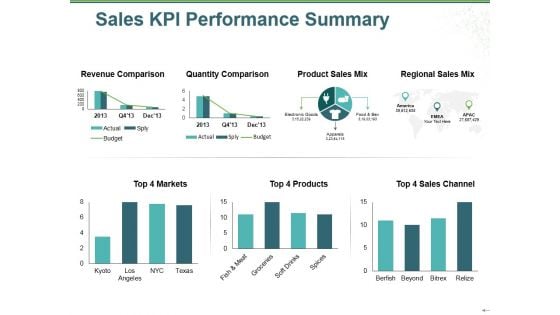
Sales Kpi Performance Summary Ppt PowerPoint Presentation Show Inspiration
This is a sales kpi performance summary ppt powerpoint presentation show inspiration. This is a two stage process. The stages in this process are revenue comparison, quantity comparison, product sales mix, regional sales mix, budget.
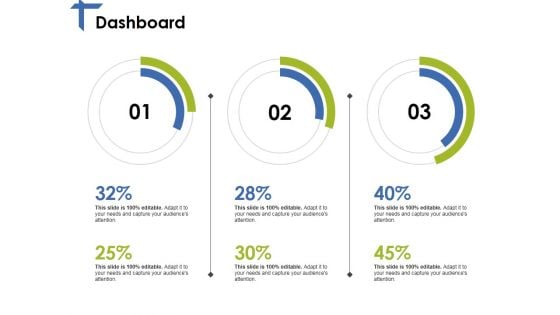
Dashboard Ppt PowerPoint Presentation Ideas Pictures
This is a dashboard ppt powerpoint presentation ideas pictures. This is a three stage process. The stages in this process are dashboard, finance, percentage, business, management.
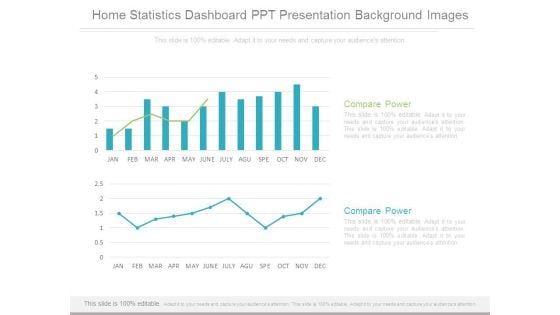
Home Statistics Dashboard Ppt Presentation Background Images
This is a home statistics dashboard ppt presentation background images. This is a two stage process. The stages in this process are compare power, finance, growth.

Interactive Dashboard Examples Ppt Samples Download
This is a interactive dashboard examples ppt samples download. This is a two stage process. The stages in this process are call quality, network utilization.
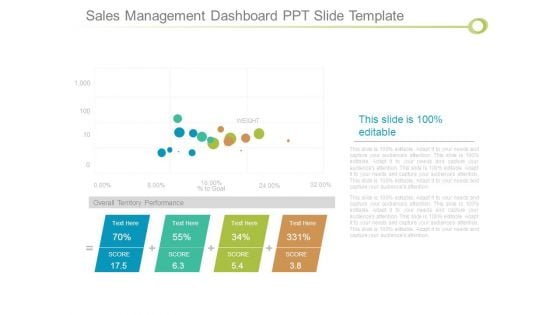
Sales Management Dashboard Ppt Slide Template
This is a sales management dashboard ppt slide template. This is a four stage process. The stages in this process are weight, goal, overall territory performance, score.
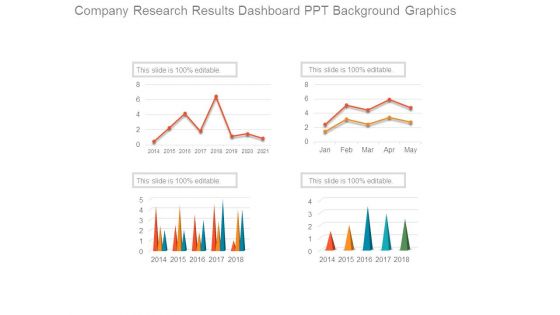
Company Research Results Dashboard Ppt Background Graphics
This is a company research results dashboard ppt background graphics. This is a four stage process. The stages in this process are growth, business, marketing, year.
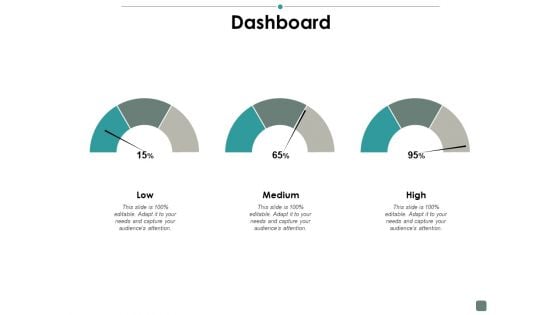
Dashboard Contribution Ppt PowerPoint Presentation Summary Ideas
This is a dashboard contribution ppt powerpoint presentation summary ideas. This is a three stage process. The stages in this process are finance, business, management, strategy, analysis.
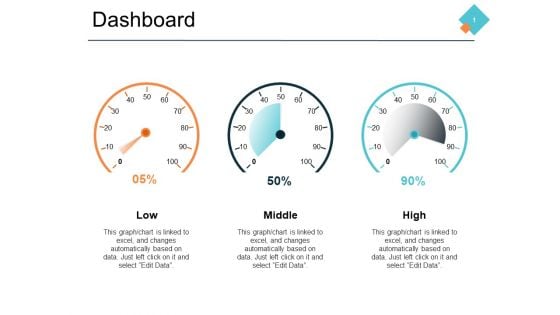
Dashboard Marketing Ppt PowerPoint Presentation Ideas Inspiration
This is a dashboard marketing ppt powerpoint presentation ideas inspiration. This is a three stage process. The stages in this process are finance, management, strategy, analysis, marketing.
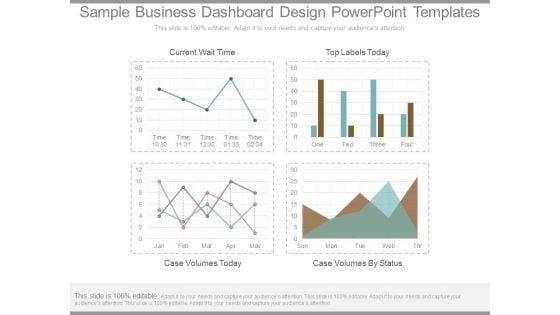
Sample Business Dashboard Design Powerpoint Templates
This is a sample business dashboard design powerpoint templates. This is a four stage process. The stages in this process are current wait time, top labels today, case volumes today, case volumes by status.


 Continue with Email

 Home
Home


