Financial Kpis
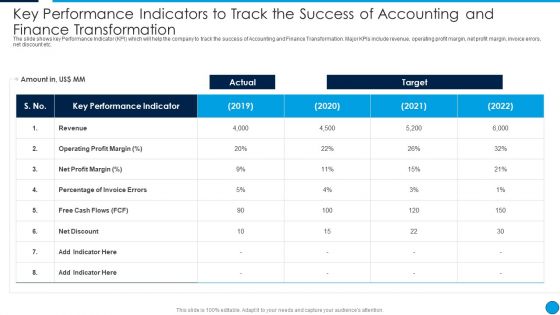
Key Performance Indicators To Track The Success Of Accounting And Finance Guidelines PDF
The slide shows key Performance Indicator KPI which will help the company to track the success of Accounting and Finance Transformation. Major KPIs include revenue, operating profit margin, net profit margin, invoice errors, net discount etc. Deliver an awe inspiring pitch with this creative Key Performance Indicators To Track The Success Of Accounting And Finance Guidelines PDF bundle. Topics like Key Performance Indicator, Target, Revenue, Net Discount can be discussed with this completely editable template. It is available for immediate download depending on the needs and requirements of the user.
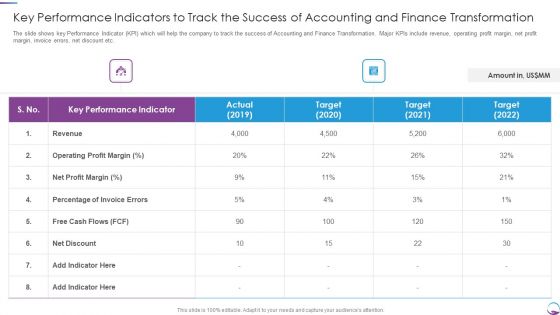
Key Performance Indicators To Track The Success Of Accounting And Finance Transformation Ideas PDF
The slide shows key Performance Indicator KPI which will help the company to track the success of Accounting and Finance Transformation. Major KPIs include revenue, operating profit margin, net profit margin, invoice errors, net discount etc. Deliver and pitch your topic in the best possible manner with this Key Performance Indicators To Track The Success Of Accounting And Finance Transformation Ideas PDF. Use them to share invaluable insights on Revenue, Net Profit Margin, Target and impress your audience. This template can be altered and modified as per your expectations. So, grab it now.

Finance And Accounting Online Conversion Plan Key Performance Indicators To Track Microsoft PDF
The slide shows key Performance Indicator KPI which will help the company to track the success of Accounting and Finance Transformation. Major KPIs include revenue, operating profit margin, net profit margin, invoice errors, net discount etc. Deliver an awe inspiring pitch with this creative Finance And Accounting Online Conversion Plan Key Performance Indicators To Track Microsoft PDF bundle. Topics like Operating Profit, Percentage Invoice, Revenue can be discussed with this completely editable template. It is available for immediate download depending on the needs and requirements of the user.

Metrics And Objectives To Measure Employees Performance Clipart PDF
The purpose of this slide is to showcase different KPIs and objectives used to measure employee efficiency. The KPI could be Revenue per employee profit per employee average task completion rate and utilization rate. Showcasing this set of slides titled Metrics And Objectives To Measure Employees Performance Clipart PDF. The topics addressed in these templates are Utilization Rate, Profit Per Employee, Revenue Per Employee. All the content presented in this PPT design is completely editable. Download it and make adjustments in color, background, font etc. as per your unique business setting.
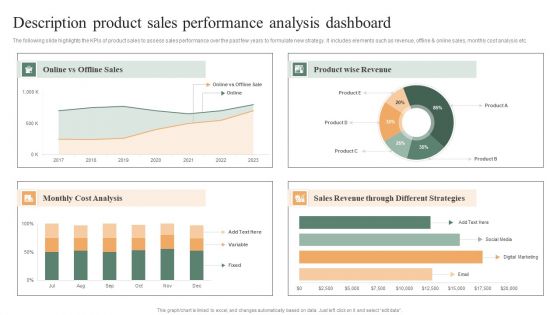
Description Product Sales Performance Analysis Dashboard Ppt PowerPoint Presentation File Samples PDF
The following slide highlights the KPIs of product sales to assess sales performance over the past few years to formulate new strategy. It includes elements such as revenue, offline and online sales, monthly cost analysis etc. Pitch your topic with ease and precision using this Description Product Sales Performance Analysis Dashboard Ppt PowerPoint Presentation File Samples PDF. This layout presents information on Product Wise Revenue, Monthly Cost Analysis, Sales Revenue, Different Strategies. It is also available for immediate download and adjustment. So, changes can be made in the color, design, graphics or any other component to create a unique layout.
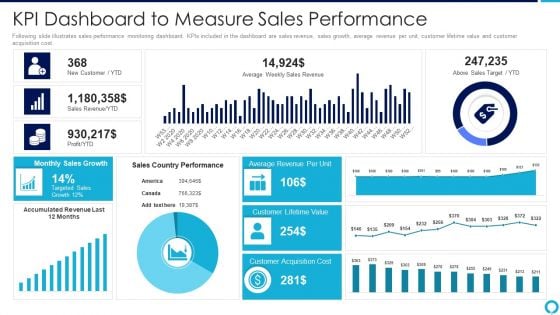
Partnership Management Strategies Kpi Dashboard To Measure Sales Performance Introduction PDF
Following slide illustrates sales performance monitoring dashboard. KPIs included in the dashboard are sales revenue, sales growth, average revenue per unit, customer lifetime value and customer acquisition cost.Deliver and pitch your topic in the best possible manner with this partnership management strategies kpi dashboard to measure sales performance introduction pdf Use them to share invaluable insights on average revenue, monthly sales growth, customer acquisition cost and impress your audience. This template can be altered and modified as per your expectations. So, grab it now.
Tracking Performance Of Internet Marketing Using Key Performance Indicators Sample PDF
The following slide highlights key performance indicators for tracking digital advertising performance to improve website traffic and revenue. It includes KPIs such as click through rate, conversion rate, return on ad spend, clicks etc. Showcasing this set of slides titled Tracking Performance Of Internet Marketing Using Key Performance Indicators Sample PDF. The topics addressed in these templates are Key Performance Indicators, Video Completion Rate, Conversion Rate. All the content presented in this PPT design is completely editable. Download it and make adjustments in color, background, font etc. as per your unique business setting.
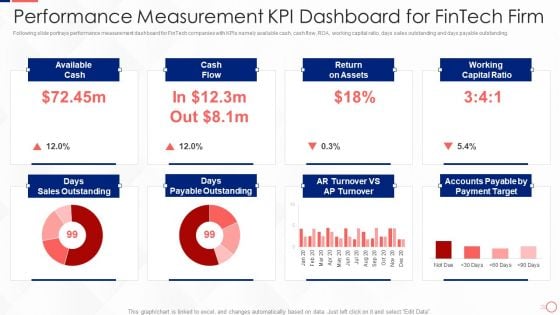
Investing In Tech Innovation Performance Measurement Kpi Dashboard For Fintech Firm Mockup PDF
Following slide portrays performance measurement dashboard for FinTech companies with KPIs namely available cash, cash flow, ROA, working capital ratio, days sales outstanding and days payable outstanding. Deliver and pitch your topic in the best possible manner with this Investing In Tech Innovation Performance Measurement Kpi Dashboard For Fintech Firm Mockup PDF. Use them to share invaluable insights on Available Cash, Cash Flow, Return on Assets, Working Capital Ratio and impress your audience. This template can be altered and modified as per your expectations. So, grab it now.
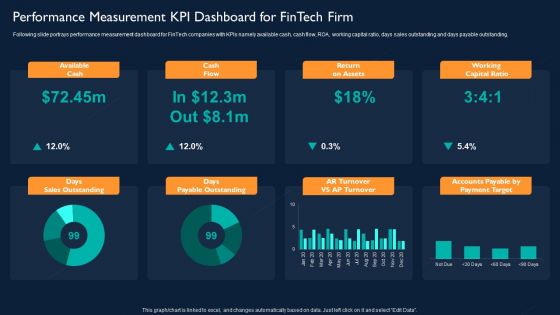
Technology Investment To Enhance Business Growth Performance Measurement KPI Dashboard For Fintech Firm Slides PDF
Following slide portrays performance measurement dashboard for FinTech companies with KPIs namely available cash, cash flow, ROA, working capital ratio, days sales outstanding and days payable outstanding. Deliver an awe inspiring pitch with this creative Technology Investment To Enhance Business Growth Performance Measurement KPI Dashboard For Fintech Firm Slides PDF bundle. Topics like Available Cash, Cash Flow, Return On Assets, Working Capital Ratio can be discussed with this completely editable template. It is available for immediate download depending on the needs and requirements of the user.
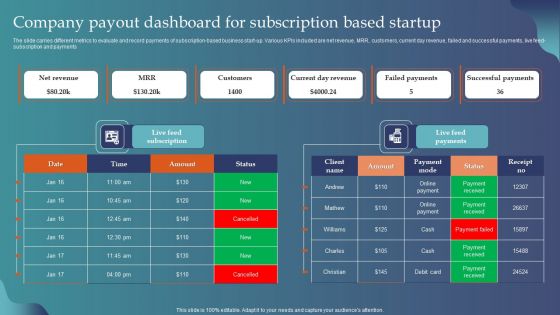
Company Payout Dashboard For Subscription Based Startup Designs PDF
The slide carries different metrics to evaluate and record payments of subscription-based business start-up. Various KPIs included are net revenue, MRR, customers, current day revenue, failed and successful payments, live feed- subscription and payments. Pitch your topic with ease and precision using this Company Payout Dashboard For Subscription Based Startup Designs PDF. This layout presents information on Net Revenue, MRR, Customers, Current Day Revenue. It is also available for immediate download and adjustment. So, changes can be made in the color, design, graphics or any other component to create a unique layout.
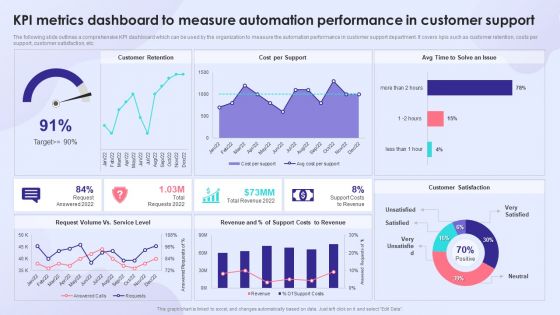
KPI Metrics Dashboard To Measure Automation Performance In Customer Support Professional PDF
The following slide outlines a comprehensive KPI dashboard which can be used by the organization to measure the automation performance in customer support department. It covers kpis such as customer retention, costs per support, customer satisfaction, etc. Deliver and pitch your topic in the best possible manner with this KPI Metrics Dashboard To Measure Automation Performance In Customer Support Professional PDF. Use them to share invaluable insights on Customer Retention, Cost Per Support, Support Costs To Revenue and impress your audience. This template can be altered and modified as per your expectations. So, grab it now.
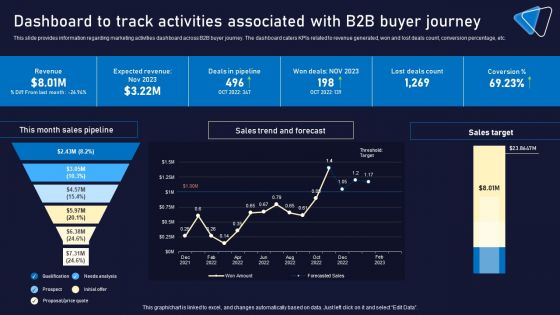
Dashboard To Track Activities Associated With B2B Buyer Journey Portrait PDF
This slide provides information regarding marketing activities dashboard across B2B buyer journey. The dashboard caters KPIs related to revenue generated, won and lost deals count, conversion percentage, etc. Make sure to capture your audiences attention in your business displays with our gratis customizable Dashboard To Track Activities Associated With B2B Buyer Journey Portrait PDF. These are great for business strategies, office conferences, capital raising or task suggestions. If you desire to acquire more customers for your tech business and ensure they stay satisfied, create your own sales presentation with these plain slides.
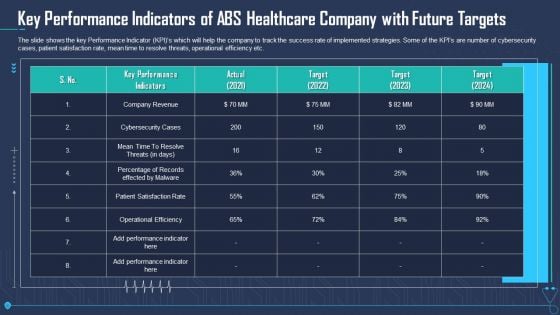
Key Performance Indicators Of ABS Healthcare Company With Future Targets Template PDF
The slide shows the key Performance Indicator KPI s which will help the company to track the success rate of implemented strategies. Some of the KPIs are number of cybersecurity cases, patient satisfaction rate, mean time to resolve threats, operational efficiency etc. Deliver an awe inspiring pitch with this creative key performance indicators of abs healthcare company with future targets template pdf bundle. Topics like company revenue, cybersecurity cases, operational efficiency can be discussed with this completely editable template. It is available for immediate download depending on the needs and requirements of the user.
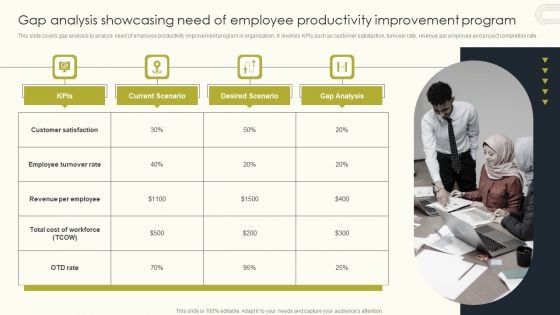
Employee Performance Management To Enhance Organizational Growth Gap Analysis Showcasing Need Of Employee Professional PDF
This slide covers gap analysis to analyze need of employee productivity improvement program in organization . It involves KPIs such as customer satisfaction, turnover rate, revenue per employee and project completion rate. Make sure to capture your audiences attention in your business displays with our gratis customizable Employee Performance Management To Enhance Organizational Growth Gap Analysis Showcasing Need Of Employee Professional PDF. These are great for business strategies, office conferences, capital raising or task suggestions. If you desire to acquire more customers for your tech business and ensure they stay satisfied, create your own sales presentation with these plain slides.
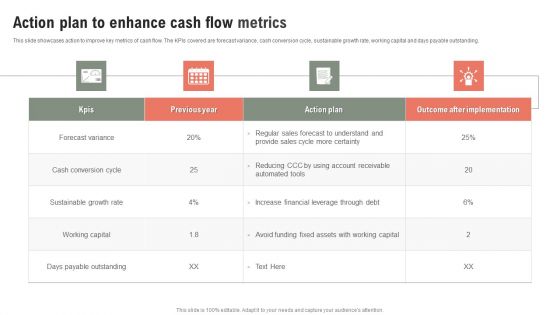
Action Plan To Enhance Cash Flow Metrics Ppt Show Maker PDF
This slide showcases action to improve key metrics of cash flow. The KPIs covered are forecast variance, cash conversion cycle, sustainable growth rate, working capital and days payable outstanding. Showcasing this set of slides titled Action Plan To Enhance Cash Flow Metrics Ppt Show Maker PDF. The topics addressed in these templates are Forecast Variance, Cash Conversion Cycle, Sustainable Growth Rate. All the content presented in this PPT design is completely editable. Download it and make adjustments in color, background, font etc. as per your unique business setting.
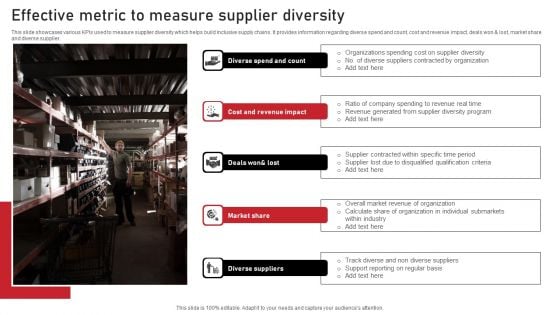
Effective Metric To Measure Supplier Diversity Themes PDF
This slide showcases various KPIs used to measure supplier diversity which helps build inclusive supply chains. It provides information regarding diverse spend and count, cost and revenue impact, deals won and lost, market share and diverse supplier. Persuade your audience using this Effective Metric To Measure Supplier Diversity Themes PDF. This PPT design covers five stages, thus making it a great tool to use. It also caters to a variety of topics including Market Share, Diverse Suppliers, Impact. Download this PPT design now to present a convincing pitch that not only emphasizes the topic but also showcases your presentation skills.
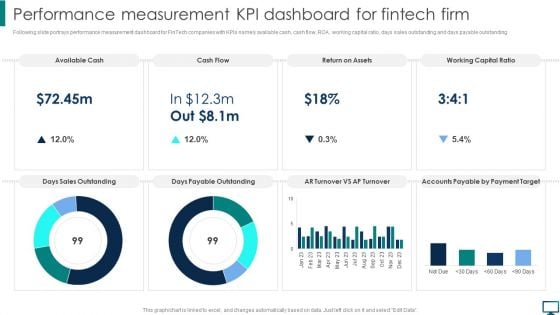
Performance Measurement KPI Dashboard For Fintech Firm Topics PDF
Following slide portrays performance measurement dashboard for FinTech companies with KPIs namely available cash, cash flow, ROA, working capital ratio, days sales outstanding and days payable outstanding. Create an editable Performance Measurement KPI Dashboard For Fintech Firm Topics PDF that communicates your idea and engages your audience. Whether you are presenting a business or an educational presentation, pre designed presentation templates help save time. Performance Measurement KPI Dashboard For Fintech Firm Topics PDF is highly customizable and very easy to edit, covering many different styles from creative to business presentations. Slidegeeks has creative team members who have crafted amazing templates. So, go and get them without any delay.
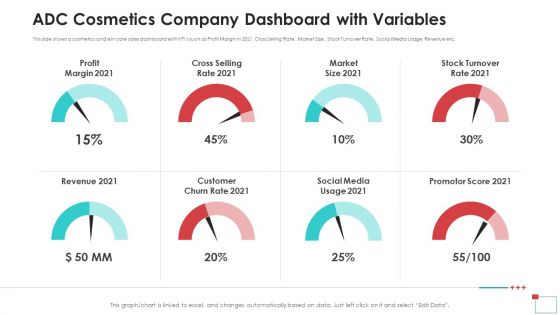
ADC Cosmetics Company Dashboard With Variables Introduction PDF
This slide shows a cosmetics and skin care sales dashboard with KPIs such as Profit Margin in 2021, Cross Selling Rate, Market Size, Stock Turnover Rate, Social Media Usage, Revenue etc. Presenting adc cosmetics company dashboard with variables introduction pdf to provide visual cues and insights. Share and navigate important information on eight stages that need your due attention. This template can be used to pitch topics like profit margin, revenue, market size, social media, promotor score. In addition, this PPT design contains high-resolution images, graphics, etc, that are easily editable and available for immediate download.
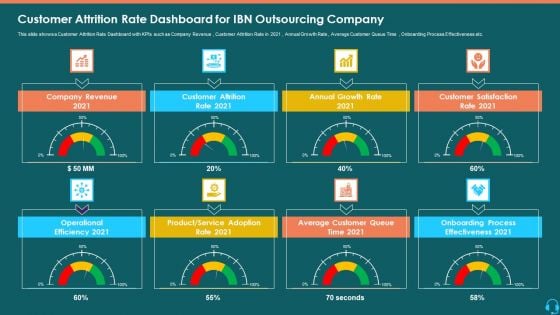
Customer Attrition Rate Dashboard For IBN Outsourcing Company Infographics PDF
This slide shows a Customer Attrition Rate Dashboard with KPIs such as Company Revenue , Customer Attrition Rate in 2021 , Annual Growth Rate , Average Customer Queue Time , Onboarding Process Effectiveness etc. This is a customer attrition rate dashboard for ibn outsourcing company infographics pdf template with various stages. Focus and dispense information on eight stages using this creative set, that comes with editable features. It contains large content boxes to add your information on topics like company revenue, annual growth, customer satisfaction, onboarding process, service adoption. You can also showcase facts, figures, and other relevant content using this PPT layout. Grab it now.
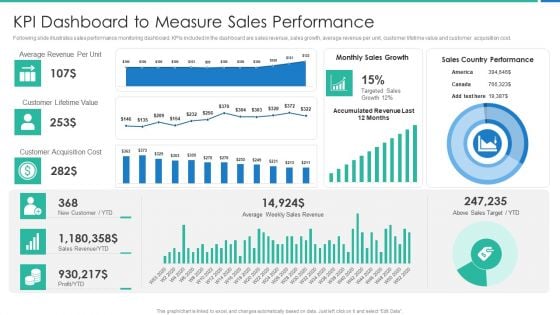
Strong Business Partnership To Ensure Company Success KPI Dashboard To Measure Sales Performance Slides PDF
Following slide illustrates sales performance monitoring dashboard. KPIs included in the dashboard are sales revenue, sales growth, average revenue per unit, customer lifetime value and customer acquisition cost.Deliver and pitch your topic in the best possible manner with this strong business partnership to ensure company success kpi dashboard to measure sales performance slides pdf Use them to share invaluable insights on kpi dashboard to measure sales performance and impress your audience. This template can be altered and modified as per your expectations. So, grab it now.
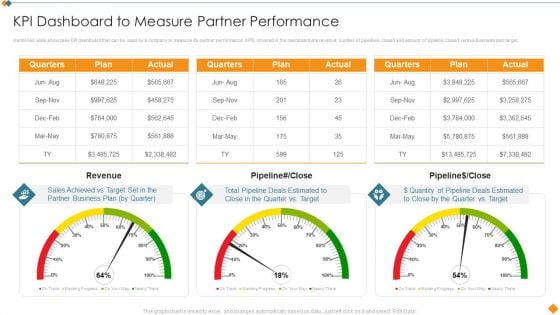
Maintaining Partner Relationships KPI Dashboard To Measure Partner Performance Structure PDF
Mentioned slide showcase KPI dashboard that can be used by a company to measure its partner performance. KPIS covered in the dashboard are revenue, number of pipelines closed and amount of pipeline closed versus business plan target. Deliver an awe inspiring pitch with this creative Maintaining Partner Relationships KPI Dashboard To Measure Partner Performance Structure PDF bundle. Topics like Quarters, Plan, Actual, Revenue, Pipeline can be discussed with this completely editable template. It is available for immediate download depending on the needs and requirements of the user.
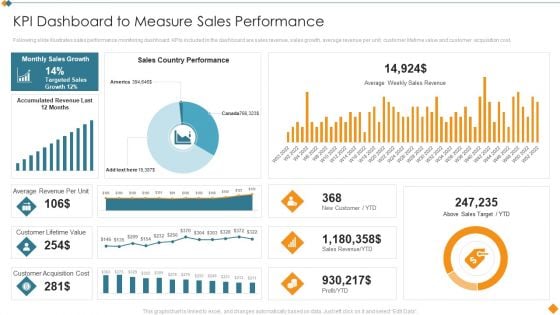
Maintaining Partner Relationships KPI Dashboard To Measure Sales Performance Rules PDF
Following slide illustrates sales performance monitoring dashboard. KPIs included in the dashboard are sales revenue, sales growth, average revenue per unit, customer lifetime value and customer acquisition cost. Deliver and pitch your topic in the best possible manner with this Maintaining Partner Relationships KPI Dashboard To Measure Sales Performance Rules PDF. Use them to share invaluable insights on Sales Country Performance, Above Sales Target, YTD, Customer Lifetime Value, Customer Acquisition Cost and impress your audience. This template can be altered and modified as per your expectations. So, grab it now.
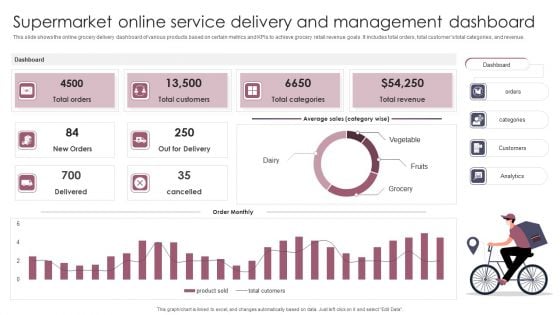
Supermarket Online Service Delivery And Management Dashboard Formats PDF
This slide shows the online grocery delivery dashboard of various products based on certain metrics and KPIs to achieve grocery retail revenue goals. It includes total orders, total customers total categories, and revenue. Showcasing this set of slides titled Supermarket Online Service Delivery And Management Dashboard Formats PDF. The topics addressed in these templates are Total Revenue, Total Customers, Dashboard. All the content presented in this PPT design is completely editable. Download it and make adjustments in color, background, font etc. as per your unique business setting.
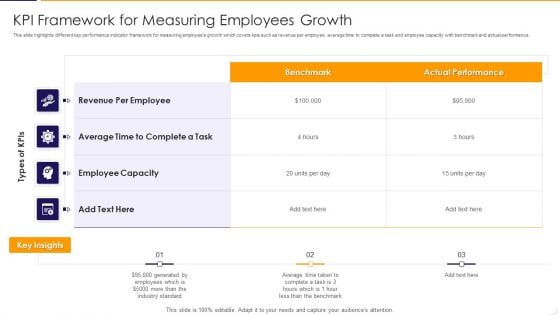
KPI Framework For Measuring Employees Growth Ppt PowerPoint Presentation File Files PDF
This slide highlights different key performance indicator framework for measuring employees growth which covers kpis such as revenue per employee, average time to complete a task and employee capacity with benchmark and actual performance. Showcasing this set of slides titled kpi framework for measuring employees growth ppt powerpoint presentation file files pdf The topics addressed in these templates are average, revenue, industry. All the content presented in this PPT design is completely editable. Download it and make adjustments in color, background, font etc. as per your unique business setting.

Performance Analysis Of Market Development Strategies Information PDF
The following slide outlines key success metrics through which companies can measure the performance of market development strategies. The major key performance indicators KPIs are revenue, market share, new customers acquired, brand reach, and impressions. Find a pre-designed and impeccable Performance Analysis Of Market Development Strategies Information PDF. The templates can ace your presentation without additional effort. You can download these easy-to-edit presentation templates to make your presentation stand out from others. So, what are you waiting for Download the template from Slidegeeks today and give a unique touch to your presentation.
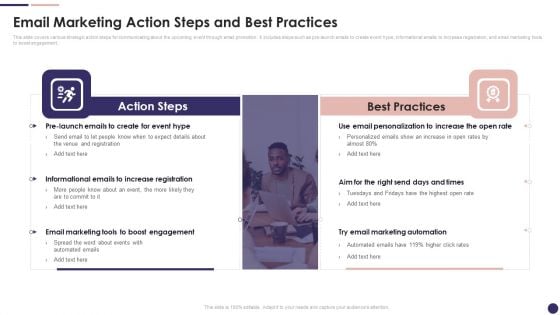
Effective Company Event Communication Plan Email Marketing Action Steps And Best Practices Information PDF
This slide covers metrics for analyzing the event revenue and registrations. It includes KPIs such as gross revenue, gross revenue from promos, total refund, total registration, visits to purchase conversion, check-in- status, etc. Deliver and pitch your topic in the best possible manner with this Effective Company Event Communication Plan Email Marketing Action Steps And Best Practices Information PDF Use them to share invaluable insights on Registration Analysis, Revenue Analysis, Gross Revenue and impress your audience. This template can be altered and modified as per your expectations. So, grab it now.
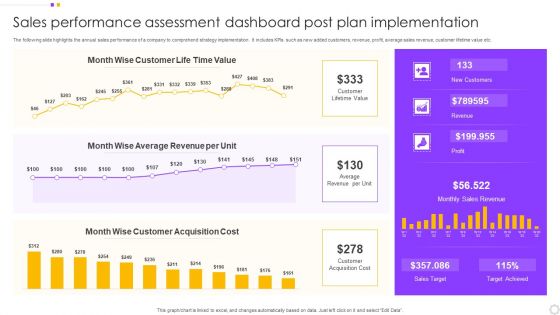
Sales Performance Assessment Dashboard Post Plan Implementation Introduction PDF
The following slide highlights the annual sales performance of a company to comprehend strategy implementation. It includes KPIs such as new added customers, revenue, profit, average sales revenue, customer lifetime value etc. Pitch your topic with ease and precision using this Sales Performance Assessment Dashboard Post Plan Implementation Introduction PDF. This layout presents information on Customer, Value, Average Revenue. It is also available for immediate download and adjustment. So, changes can be made in the color, design, graphics or any other component to create a unique layout.
Automating Supply Chain Dashboard For Tracking Impact Of Transport Automation Themes PDF
This slide covers the dashboard for tracking vehicle efficiency after transport automation. It include KPIs such as truck turnaround time, average revenue per hour, truckload capacity, transit time, on-time pickup, and average revenue per mile. Deliver an awe inspiring pitch with this creative Automating Supply Chain Dashboard For Tracking Impact Of Transport Automation Themes PDF bundle. Topics like Average Revenue, Per Mile, Truck Turnaround can be discussed with this completely editable template. It is available for immediate download depending on the needs and requirements of the user.
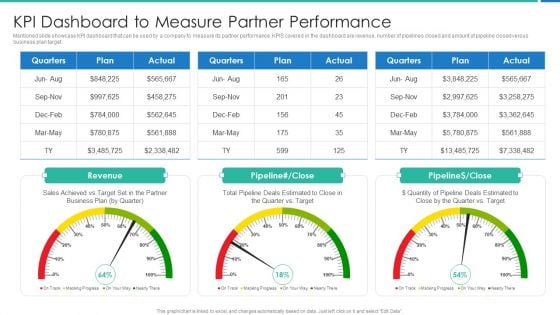
Strong Business Partnership To Ensure Company Success KPI Dashboard To Measure Partner Performance Sample PDF
Mentioned slide showcase KPI dashboard that can be used by a company to measure its partner performance. KPIS covered in the dashboard are revenue, number of pipelines closed and amount of pipeline closed versus business plan target.Deliver an awe inspiring pitch with this creative strong business partnership to ensure company success kpi dashboard to measure partner performance sample pdf bundle. Topics like kpi dashboard to measure partner performance can be discussed with this completely editable template. It is available for immediate download depending on the needs and requirements of the user.
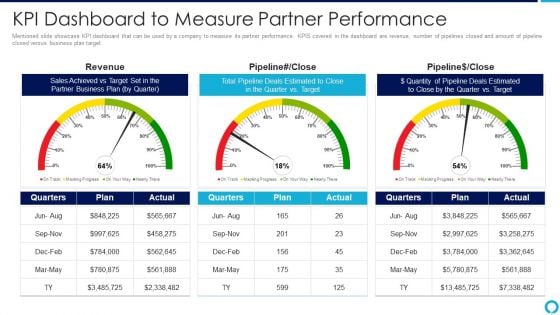
Partnership Management Strategies Kpi Dashboard To Measure Partner Performance Elements PDF
Mentioned slide showcase KPI dashboard that can be used by a company to measure its partner performance. KPIS covered in the dashboard are revenue, number of pipelines closed and amount of pipeline closed versus business plan target.Deliver an awe inspiring pitch with this creative partnership management strategies kpi dashboard to measure partner performance elements pdf bundle. Topics like sales achieved, partner business plan, total pipeline deals estimated can be discussed with this completely editable template. It is available for immediate download depending on the needs and requirements of the user.
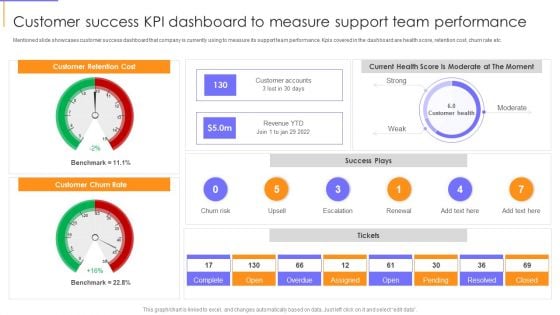
Guide To Client Success Customer Success KPI Dashboard To Measure Support Team Performance Topics PDF
Mentioned slide showcases customer success dashboard that company is currently using to measure its support team performance. Kpis covered in the dashboard are health score, retention cost, churn rate etc. Deliver an awe inspiring pitch with this creative Guide To Client Success Customer Success KPI Dashboard To Measure Support Team Performance Topics PDF bundle. Topics like Customer Churn Rate, Customer Retention Cost, Revenue can be discussed with this completely editable template. It is available for immediate download depending on the needs and requirements of the user.
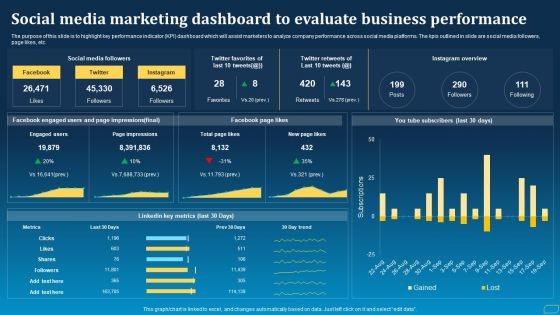
Direct Marketing Techniques To Enhance Business Presence Social Media Marketing Dashboard To Evaluate Rules PDF
The purpose of this slide is to highlight key performance indicator KPI dashboard which will assist marketers to analyze company performance across social media platforms. The kpis outlined in slide are social media followers, page likes, etc. Make sure to capture your audiences attention in your business displays with our gratis customizable Direct Marketing Techniques To Enhance Business Presence Social Media Marketing Dashboard To Evaluate Rules PDF. These are great for business strategies, office conferences, capital raising or task suggestions. If you desire to acquire more customers for your tech business and ensure they stay satisfied, create your own sales presentation with these plain slides.
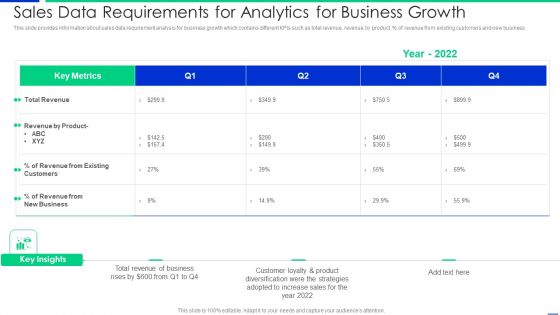
Sales Data Requirements For Analytics For Business Growth Information PDF
This slide provides information about sales data requirement analysis for business growth which contains different KPIs such as total revenue, revenue by product, percentage of revenue from existing customers and new business. Pitch your topic with ease and precision using this sales data requirements for analytics for business growth information pdf. This layout presents information on customers, revenue, business. It is also available for immediate download and adjustment. So, changes can be made in the color, design, graphics or any other component to create a unique layout.
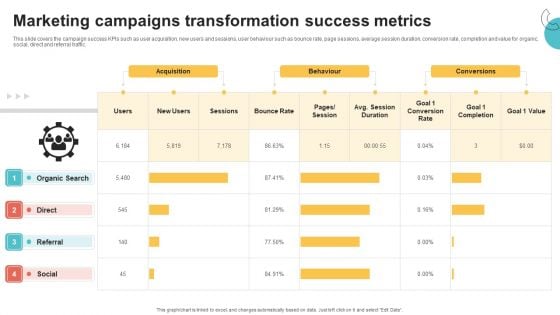
Digital Marketing Toolkit Marketing Campaigns Transformation Success Metrics Rules PDF
This slide covers the campaign success KPIs such as user acquisition, new users and sessions, user behaviour such as bounce rate, page sessions, average session duration, conversion rate, completion and value for organic, social, direct and referral traffic. Make sure to capture your audiences attention in your business displays with our gratis customizable Digital Marketing Toolkit Marketing Campaigns Transformation Success Metrics Rules PDF. These are great for business strategies, office conferences, capital raising or task suggestions. If you desire to acquire more customers for your tech business and ensure they stay satisfied, create your own sales presentation with these plain slides.
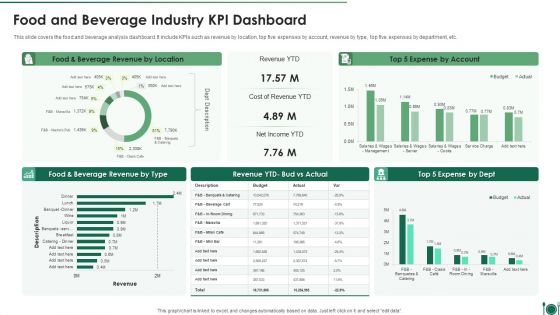
Food And Beverage Industry Kpi Dashboard Professional PDF
This slide covers the food and beverage analysis dashboard. It include KPIs such as revenue by location, top five expenses by account, revenue by type, top five expenses by department, etc.Showcasing this set of slides titled Food And Beverage Industry Kpi Dashboard Professional PDF. The topics addressed in these templates are Food And Beverage Industry KPI Dashboard. All the content presented in this PPT design is completely editable. Download it and make adjustments in color, background, font etc. as per your unique business setting
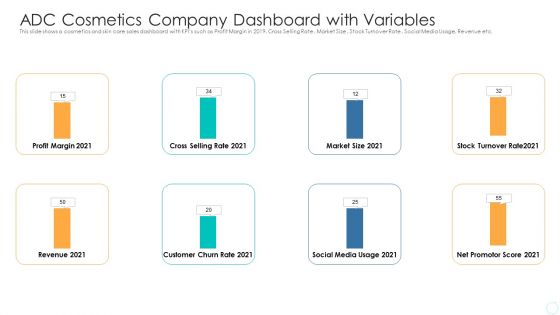
ADC Cosmetics Company Dashboard With Variables Formats PDF
This slide shows a cosmetics and skin care sales dashboard with KPIs such as Profit Margin in 2021, Cross Selling Rate , Market Size, Stock Turnover Rate , Social Media Usage, Revenue etc. Deliver an awe-inspiring pitch with this creative adc cosmetics company dashboard with variables formats pdf bundle. Topics like profit margin, cross selling rate, market size, revenue, social media can be discussed with this completely editable template. It is available for immediate download depending on the needs and requirements of the user.
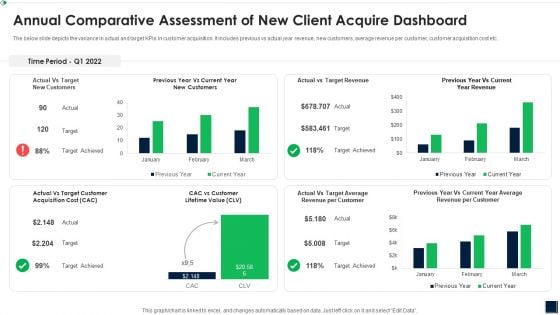
Annual Comparative Assessment Of New Client Acquire Dashboard Topics PDF
The below slide depicts the variance in actual and target KPIs in customer acquisition. It includes previous vs actual year revenue, new customers, average revenue per customer, customer acquisition cost etc. Showcasing this set of slides titled Annual Comparative Assessment Of New Client Acquire Dashboard Topics PDF The topics addressed in these templates are Annual Comparative Assessment OF New Client Acquire Dashboard All the content presented in this PPT design is completely editable. Download it and make adjustments in color, background, font etc. as per your unique business setting.
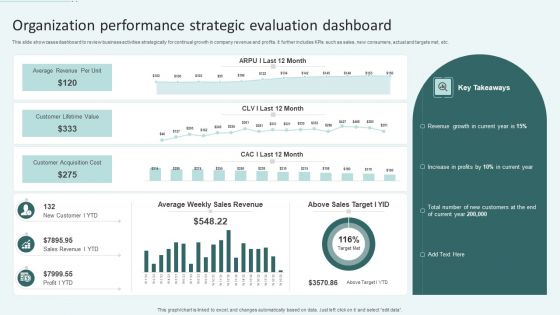
Organization Performance Strategic Evaluation Dashboard Ppt Slides Visual Aids PDF
This slide showcases dashboard to review business activities strategically for continual growth in company revenue and profits. It further includes KPIs such as sales, new consumers, actual and targets met, etc. Showcasing this set of slides titled Organization Performance Strategic Evaluation Dashboard Ppt Slides Visual Aids PDF. The topics addressed in these templates are Average Revenue Per Unit, Customer Lifetime Value, Customer Acquisition Cost. All the content presented in this PPT design is completely editable. Download it and make adjustments in color, background, font etc. as per your unique business setting.
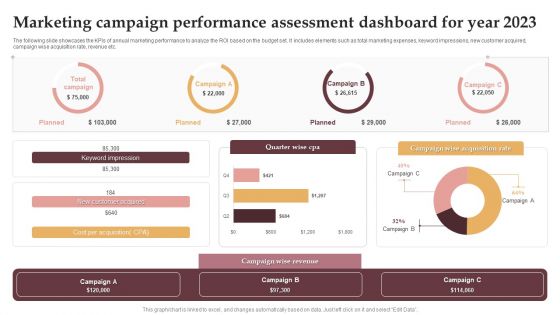
Marketing Campaign Performance Assessment Dashboard For Year 2023 Download PDF
The following slide showcases the KPIs of annual marketing performance to analyze the ROI based on the budget set. It includes elements such as total marketing expenses, keyword impressions, new customer acquired, campaign wise acquisition rate, revenue etc. Showcasing this set of slides titled Marketing Campaign Performance Assessment Dashboard For Year 2023 Download PDF. The topics addressed in these templates are Keyword Impression, New Customer Acquired, Campaign Wise Revenue. All the content presented in this PPT design is completely editable. Download it and make adjustments in color, background, font etc. as per your unique business setting.
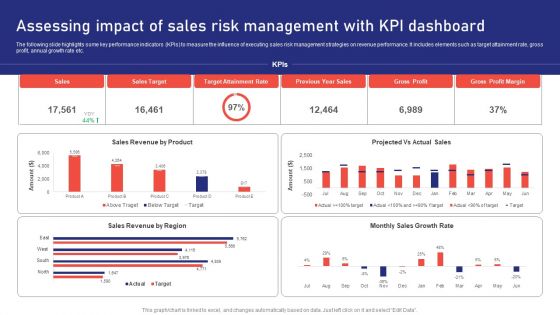
Sales Risk Assessment For Profit Maximization Assessing Impact Of Sales Risk Management With Kpi Dashboard Inspiration PDF
The following slide highlights some key performance indicators KPIs to measure the influence of executing sales risk management strategies on revenue performance. It includes elements such as target attainment rate, gross profit, annual growth rate etc. Find a pre designed and impeccable Sales Risk Assessment For Profit Maximization Assessing Impact Of Sales Risk Management With Kpi Dashboard Inspiration PDF. The templates can ace your presentation without additional effort. You can download these easy to edit presentation templates to make your presentation stand out from others. So, what are you waiting for Download the template from Slidegeeks today and give a unique touch to your presentation.
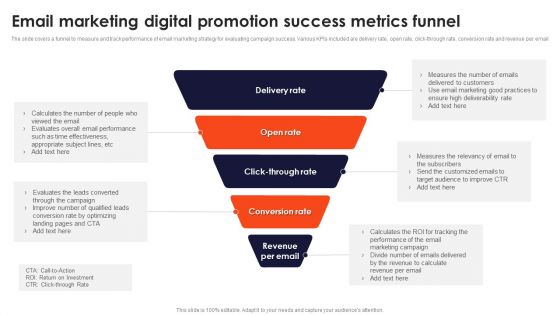
Email Marketing Digital Promotion Success Metrics Funnel Infographics PDF
The slide covers a funnel to measure and track performance of email marketing strategy for evaluating campaign success. Various KPIs included are delivery rate, open rate, click-through rate, conversion rate and revenue per email. Presenting Email Marketing Digital Promotion Success Metrics Funnel Infographics PDF to dispense important information. This template comprises Four stages. It also presents valuable insights into the topics including Delivery Rate, Open Rate, Conversion Rate. This is a completely customizable PowerPoint theme that can be put to use immediately. So, download it and address the topic impactfully.
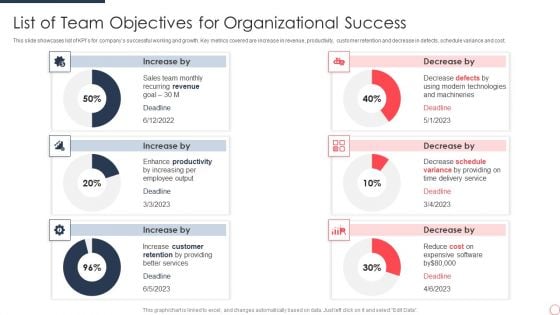
List Of Team Objectives For Organizational Success Ideas PDF
This slide showcases list of KPIs for companys successful working and growth. Key metrics covered are increase in revenue, productivity, customer retention and decrease in defects, schedule variance and cost. Showcasing this set of slides titled List Of Team Objectives For Organizational Success Ideas PDF. The topics addressed in these templates are Sales Team, Recurring Revenue, Goal. All the content presented in this PPT design is completely editable. Download it and make adjustments in color, background, font etc. as per your unique business setting.
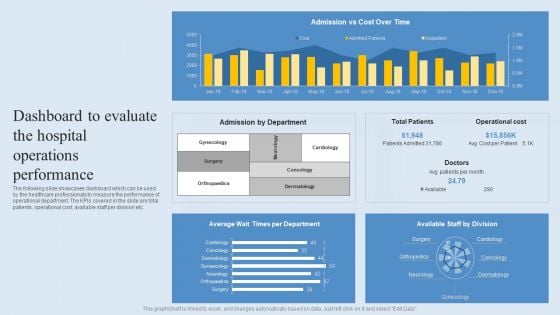
Dashboard To Evaluate The Hospital Operations Performance Diagrams PDF
The following slide showcases dashboard which can be used by the healthcare professionals to measure the performance of operational department. The KPIs covered in the slide are total patients, operational cost, available staff per division etc. Make sure to capture your audiences attention in your business displays with our gratis customizable Dashboard To Evaluate The Hospital Operations Performance Diagrams PDF. These are great for business strategies, office conferences, capital raising or task suggestions. If you desire to acquire more customers for your tech business and ensure they stay satisfied, create your own sales presentation with these plain slides.

Sales Optimization Best Practices To Close More Deals Sales KPI Dashboard Accumulated Topics PDF
The sales dashboard is an effective tool that helps in monitoring various sales KPIs in order to aid sales teams in reaching sales goals by analyzing the sales performance. Deliver and pitch your topic in the best possible manner with this sales optimization best practices to close more deals sales kpi dashboard accumulated topics pdf. Use them to share invaluable insights on incremental sales, sales revenue, cost breakdown, accumulated revenue and impress your audience. This template can be altered and modified as per your expectations. So, grab it now.
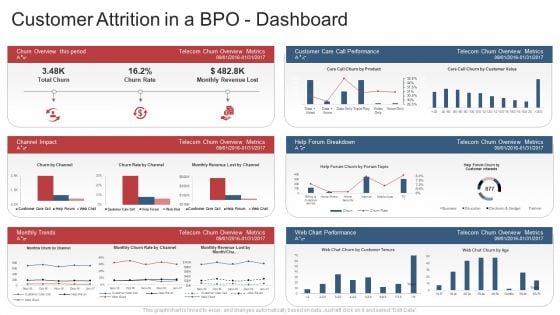
Customer Attrition In A Bpo Dashboard Rate Ppt Slides Designs Download PDF
This slide shows a Customer Attrition Rate Dashboard with KPIs such as Company Revenue , Customer Attrition Rate in 2021 , Annual Growth Rate , Average Customer Queue Time , Onboarding Process Effectiveness etc. Deliver an awe-inspiring pitch with this creative customer attrition in a bpo dashboard rate ppt slides designs download pdf. bundle. Topics like company revenue, customer attrition rate, annual growth rate, customer satisfaction, rate, operational efficiency can be discussed with this completely editable template. It is available for immediate download depending on the needs and requirements of the user.
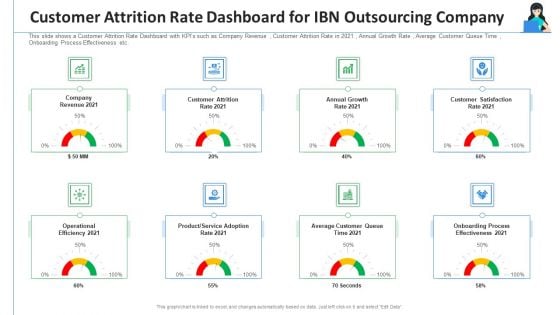
Customer Attrition Rate Dashboard For IBN Outsourcing Company Ppt Ideas Samples PDF
This slide shows a Customer Attrition Rate Dashboard with KPIs such as Company Revenue , Customer Attrition Rate in 2021 , Annual Growth Rate , Average Customer Queue Time , Onboarding Process Effectiveness etc. Deliver and pitch your topic in the best possible manner with this customer attrition rate dashboard for IBN outsourcing company ppt ideas samples pdf. Use them to share invaluable insights on revenue, operational efficiency, product service, onboarding process effectiveness, annual growth and impress your audience. This template can be altered and modified as per your expectations. So, grab it now.
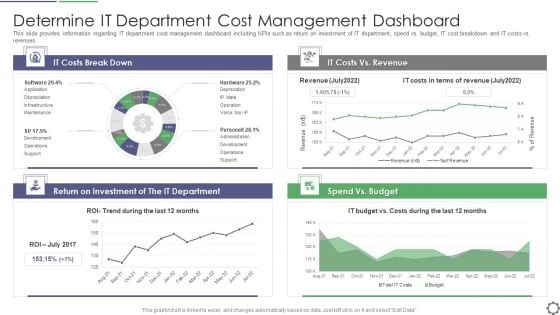
Determine IT Department Cost Management Dashboard Ppt PowerPoint Presentation Gallery Outline PDF
This slide provides information regarding IT department cost management dashboard including KPIs such as return on investment of IT department, spend vs. budget, IT cost breakdown and IT costs vs. revenues. Deliver an awe inspiring pitch with this creative determine it department cost management dashboard ppt powerpoint presentation gallery outline pdf bundle. Topics like it costs break down, it costs vs revenue, spend vs budget, return on investment can be discussed with this completely editable template. It is available for immediate download depending on the needs and requirements of the user.
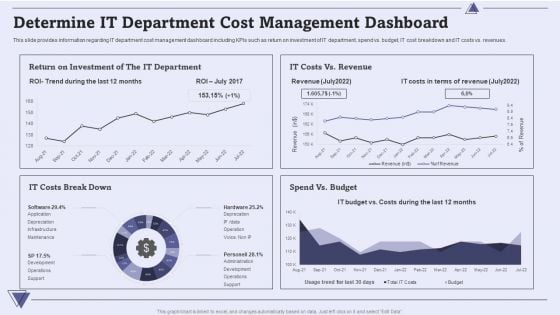
CIO For IT Cost Optimization Techniques Determine IT Department Cost Management Dashboard Introduction PDF
This slide provides information regarding IT department cost management dashboard including KPIs such as return on investment of IT department, spend vs. budget, IT cost breakdown and IT costs vs. revenues. Deliver and pitch your topic in the best possible manner with this CIO For IT Cost Optimization Techniques Determine IT Department Cost Management Dashboard Introduction PDF. Use them to share invaluable insights on Costs, Budget, Revenue and impress your audience. This template can be altered and modified as per your expectations. So, grab it now.
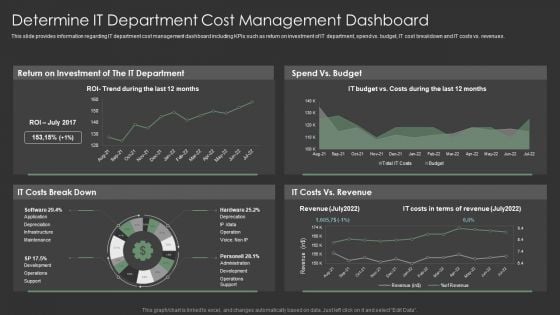
IT Spend Management Priorities By Cios Determine IT Department Cost Management Dashboard Pictures PDF
This slide provides information regarding IT department cost management dashboard including KPIs such as return on investment of IT department, spend vs. budget, IT cost breakdown and IT costs vs. revenues. Deliver and pitch your topic in the best possible manner with this IT Spend Management Priorities By Cios Determine IT Department Cost Management Dashboard Pictures PDF. Use them to share invaluable insights on Revenue, Costs, Budget and impress your audience. This template can be altered and modified as per your expectations. So, grab it now.
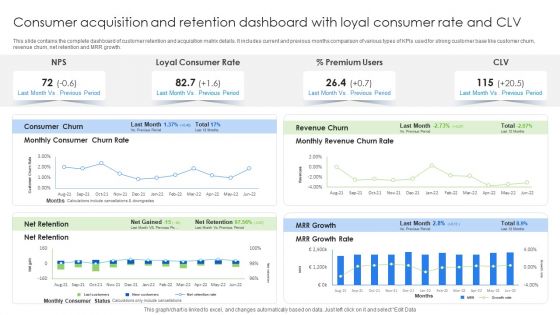
Consumer Acquisition And Retention Dashboard With Loyal Consumer Rate And CLV Brochure PDF
This slide contains the complete dashboard of customer retention and acquisition matrix details. It includes current and previous months comparison of various types of KPIs used for strong customer base like customer churn, revenue churn, net retention and MRR growth. Showcasing this set of slides titled Consumer Acquisition And Retention Dashboard With Loyal Consumer Rate And CLV Brochure PDF. The topics addressed in these templates are Consumer Churn, Revenue Churn, Premium Users. All the content presented in this PPT design is completely editable. Download it and make adjustments in color, background, font etc. as per your unique business setting.
Investment Project Prioritization KPI Dashboard Icons PDF
This slide covers project management dashboard for ranking and filtering capital projects. It also include KPIs such as top projects by NPV, top projects by IRR, investor amount, return amount, etc. Showcasing this set of slides titled Investment Project Prioritization KPI Dashboard Icons PDF. The topics addressed in these templates are Project Performance, Top Project NPV, Top Project IRR. All the content presented in this PPT design is completely editable. Download it and make adjustments in color, background, font etc. as per your unique business setting.
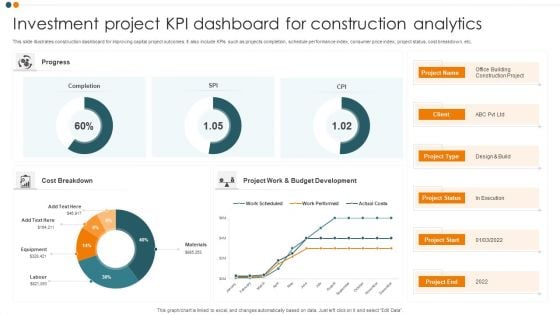
Investment Project KPI Dashboard For Construction Analytics Background PDF
This slide illustrates construction dashboard for improving capital project outcomes. It also include KPIs such as projects completion, schedule performance index, consumer price index, project status, cost breakdown, etc. Pitch your topic with ease and precision using this Investment Project KPI Dashboard For Construction Analytics Background PDF. This layout presents information on Cost Breakdown, Completion, Progress. It is also available for immediate download and adjustment. So, changes can be made in the color, design, graphics or any other component to create a unique layout.
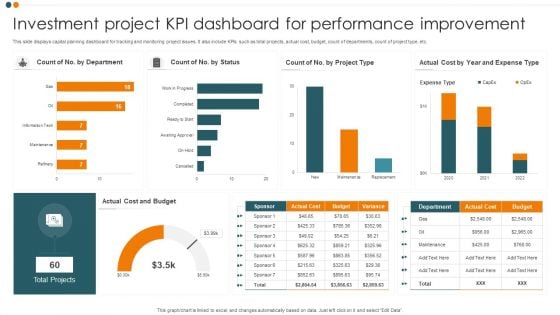
Investment Project KPI Dashboard For Performance Improvement Guidelines PDF
This slide displays capital planning dashboard for tracking and monitoring project issues. It also include KPIs such as total projects, actual cost, budget, count of departments, count of project type, etc. Pitch your topic with ease and precision using this Investment Project KPI Dashboard For Performance Improvement Guidelines PDF. This layout presents information on Cost And Budget, Total Projects, Expense Type. It is also available for immediate download and adjustment. So, changes can be made in the color, design, graphics or any other component to create a unique layout.
Analyzing And Deploying Effective CMS Impact Of Ecommerce Management System Post Implementation Icons PDF
This slide represents the key performance indicators to measure the impact of ecommerce management system on ecommerce business operations. It includes KPIs to such as average order value, gross profit, conversion rate, shopping cart abandonment rate, shopping cart conversion rate etc. Make sure to capture your audiences attention in your business displays with our gratis customizable Analyzing And Deploying Effective CMS Impact Of Ecommerce Management System Post Implementation Icons PDF. These are great for business strategies, office conferences, capital raising or task suggestions. If you desire to acquire more customers for your tech business and ensure they stay satisfied, create your own sales presentation with these plain slides.
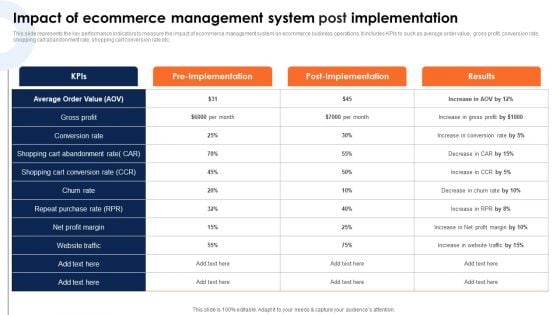
Impact Of Ecommerce Management System Post Implementation Guidelines PDF
This slide represents the key performance indicators to measure the impact of ecommerce management system on ecommerce business operations. It includes KPIs to such as average order value, gross profit, conversion rate, shopping cart abandonment rate, shopping cart conversion rate etc.Make sure to capture your audiences attention in your business displays with our gratis customizable Impact Of Ecommerce Management System Post Implementation Guidelines PDF. These are great for business strategies, office conferences, capital raising or task suggestions. If you desire to acquire more customers for your tech business and ensure they stay satisfied, create your own sales presentation with these plain slides.
BANT Sales Lead Qualification Model Analyzing And Understanding The Performance Icons PDF
Purpose of the following slide is to show the key performance indicators of the current sales process, the provided displays KPIs such as customer acquired, CAC, volume per customer etc. Deliver and pitch your topic in the best possible manner with this BANT Sales Lead Qualification Model Analyzing And Understanding The Performance Icons PDF. Use them to share invaluable insights on New Customer, Weekly Sales, Revenues Sales and impress your audience. This template can be altered and modified as per your expectations. So, grab it now.
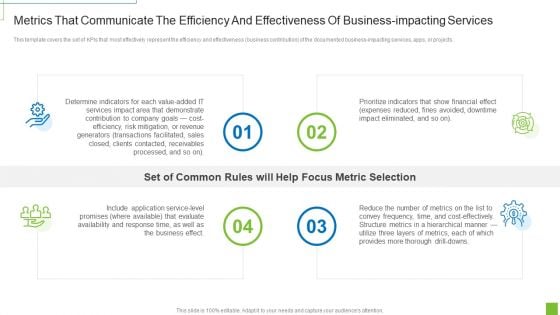
Metrics That Communicate The Efficiency And Effectiveness Of Business Impacting Services Ppt Ideas Grid PDF
This template covers the set of KPIs that most effectively represent the efficiency and effectiveness business contribution of the documented business impacting services, apps, or projects. Presenting metrics that communicate the efficiency and effectiveness of business impacting services ppt ideas grid pdf to provide visual cues and insights. Share and navigate important information on four stages that need your due attention. This template can be used to pitch topics like service level, application, revenue, cost efficiency, risk. In addtion, this PPT design contains high resolution images, graphics, etc, that are easily editable and available for immediate download.
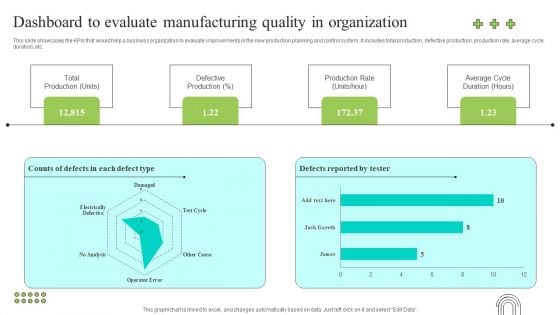
Effective Production Planning And Monitoring Techniques Dashboard To Evaluate Manufacturing Quality Brochure PDF
This slide showcases the KPIs that would help a business organization to evaluate improvements in the new production planning and control system. It includes total production, defective production, production rate, average cycle duration, etc. Make sure to capture your audiences attention in your business displays with our gratis customizable Effective Production Planning And Monitoring Techniques Dashboard To Evaluate Manufacturing Quality Brochure PDF. These are great for business strategies, office conferences, capital raising or task suggestions. If you desire to acquire more customers for your tech business and ensure they stay satisfied, create your own sales presentation with these plain slides.
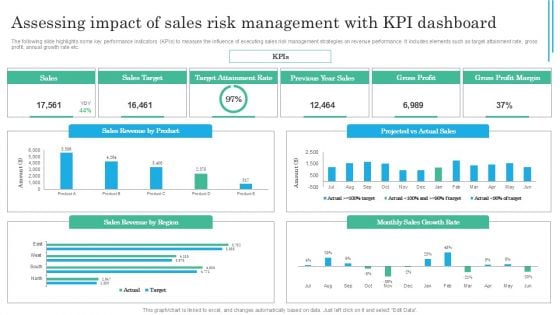
Implementing Sales Volatility Management Techniques Assessing Impact Of Sales Risk Management Topics PDF
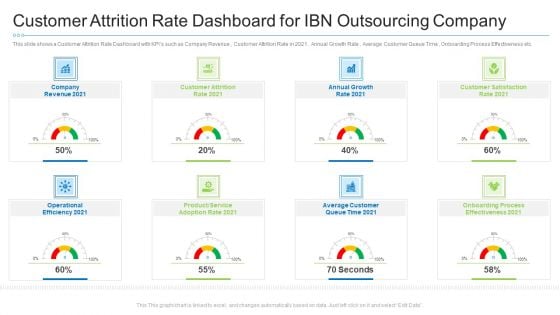
Customer Attrition Rate Dashboard For Ibn Outsourcing Company Information PDF
This slide shows a Customer Attrition Rate Dashboard with KPIs such as Company Revenue , Customer Attrition Rate in 2021 , Annual Growth Rate , Average Customer Queue Time , Onboarding Process Effectiveness etc. Deliver and pitch your topic in the best possible manner with this customer attrition rate dashboard for ibn outsourcing company information pdf. Use them to share invaluable insights on customer attrition rate dashboard for ibn outsourcing company and impress your audience. This template can be altered and modified as per your expectations. So, grab it now.


 Continue with Email

 Home
Home


