Financial Kpis
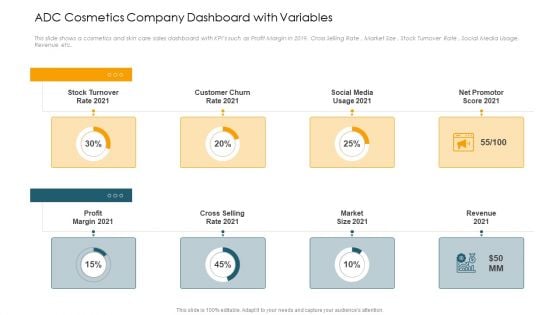
ADC Cosmetics Company Dashboard With Variables Ppt Backgrounds PDF
This slide shows a cosmetics and skin care sales dashboard with KPIs such as Profit Margin in 2019, Cross Selling Rate , Market Size , Stock Turnover Rate , Social Media Usage, Revenue etc.Presenting adc cosmetics company dashboard with variables ppt backgrounds pdf. to provide visual cues and insights. Share and navigate important information on eight stages that need your due attention. This template can be used to pitch topics like stock turnover rate 2021, social media usage 2021, net promotor score 2021. In addtion, this PPT design contains high resolution images, graphics, etc, that are easily editable and available for immediate download.
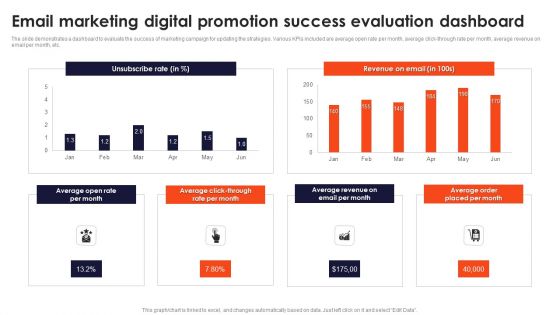
Email Marketing Digital Promotion Success Evaluation Dashboard Sample PDF
The slide demonstrates a dashboard to evaluate the success of marketing campaign for updating the strategies. Various KPIs included are average open rate per month, average click-through rate per month, average revenue on email per month, etc. Pitch your topic with ease and precision using this Email Marketing Digital Promotion Success Evaluation Dashboard Sample PDF. This layout presents information on Open Rate Per Month, Order Placed Per Month. It is also available for immediate download and adjustment. So, changes can be made in the color, design, graphics or any other component to create a unique layout.
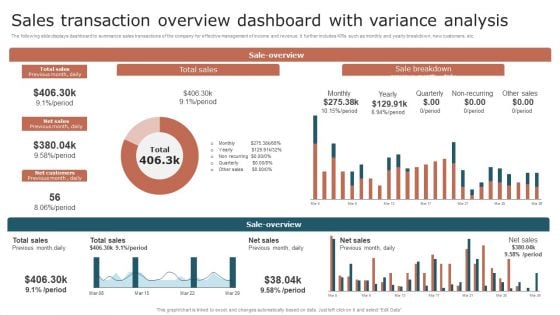
Sales Transaction Overview Dashboard With Variance Analysis Summary PDF
The following slide displays dashboard to summarize sales transactions of the company for effective management of income and revenue. It further includes KPIs such as monthly and yearly breakdown, new customers, etc. Showcasing this set of slides titled Sales Transaction Overview Dashboard With Variance Analysis Summary PDF. The topics addressed in these templates are Sales, Customers, Variance Analysis. All the content presented in this PPT design is completely editable. Download it and make adjustments in color, background, font etc. as per your unique business setting.
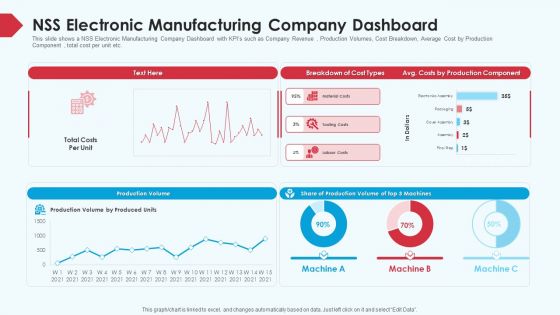
Skill Shortage In A Production Firm Case Study Solution NSS Electronic Manufacturing Company Dashboard Summary PDF
This slide shows a NSS Electronic Manufacturing Company Dashboard with KPIs such as Company Revenue , Production Volumes, Cost Breakdown, Average Cost by Production Component , total cost per unit etc. Deliver and pitch your topic in the best possible manner with this skill shortage in a production firm case study solution NSS electronic manufacturing company dashboard summary pdf. Use them to share invaluable insights on costs by production component, production volume, NSS electronic manufacturing company dashboard and impress your audience. This template can be altered and modified as per your expectations. So, grab it now.
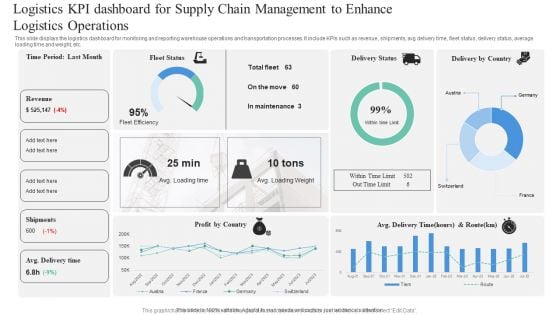
Logistics KPI Dashboard For Supply Chain Management To Enhance Logistics Operations Professional PDF
This slide displays the logistics dashboard for monitoring and reporting warehouse operations and transportation processes. It include KPIs such as revenue, shipments, avg delivery time, fleet status, delivery status, average loading time and weight, etc. Pitch your topic with ease and precision using this Logistics KPI Dashboard For Supply Chain Management To Enhance Logistics Operations Professional PDF. This layout presents information on Logistics KPI, Dashboard For Supply Chain, Management To Enhance, Logistics Operations. It is also available for immediate download and adjustment. So, changes can be made in the color, design, graphics or any other component to create a unique layout.
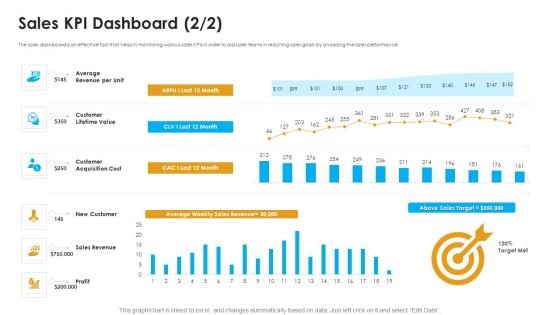
Sales Assistance Boost Overall Efficiency Sales KPI Dashboard New Topics PDF
The sales dashboard is an effective tool that helps in monitoring various sales KPIs in order to aid sales teams in reaching sales goals by analyzing the sales performance. Deliver and pitch your topic in the best possible manner with this sales assistance boost overall efficiency sales kpi dashboard new topics pdf. Use them to share invaluable insights on customer acquisition cost, customer lifetime value, average revenue and impress your audience. This template can be altered and modified as per your expectations. So, grab it now.
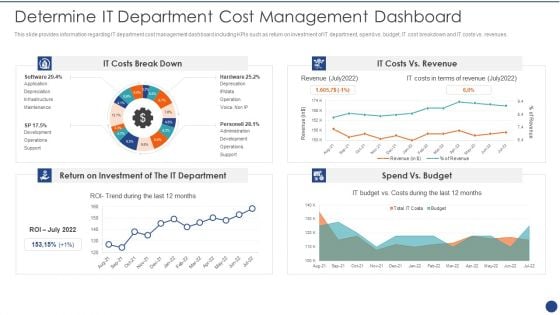
Cios Value Optimization Determine IT Department Cost Management Dashboard Microsoft PDF
This slide provides information regarding IT department cost management dashboard including KPIs such as return on investment of IT department, spend vs. budget, IT cost breakdown and IT costs vs. revenues. Deliver and pitch your topic in the best possible manner with this Cios Value Optimization Determine IT Department Cost Management Dashboard Microsoft PDF. Use them to share invaluable insights on IT Costs, Return Investment, IT Department and impress your audience. This template can be altered and modified as per your expectations. So, grab it now.
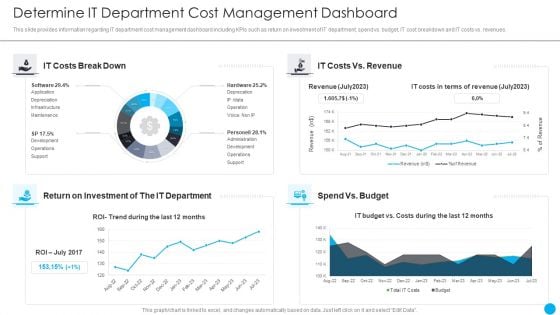
Cios Methodologies To Improve IT Spending Determine It Department Cost Management Dashboard Diagrams PDF
This slide provides information regarding IT department cost management dashboard including KPIs such as return on investment of IT department, spend vs. budget, IT cost breakdown and IT costs vs. revenues. Deliver and pitch your topic in the best possible manner with this Cios Methodologies To Improve IT Spending Determine It Department Cost Management Dashboard Diagrams PDF Use them to share invaluable insights on Extent Organizational, Reprioritization Cancellation, Investment Required and impress your audience. This template can be altered and modified as per your expectations. So, grab it now.
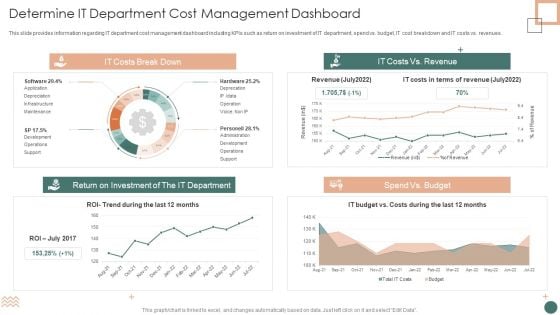
Improved Digital Expenditure Determine IT Department Cost Management Dashboard Introduction PDF
This slide provides information regarding IT department cost management dashboard including KPIs such as return on investment of IT department, spend vs. budget, IT cost breakdown and IT costs vs. revenues. Deliver and pitch your topic in the best possible manner with this Improved Digital Expenditure Determine IT Department Cost Management Dashboard Introduction PDF. Use them to share invaluable insights on Return Investment, Depreciation, Costs Break and impress your audience. This template can be altered and modified as per your expectations. So, grab it now.
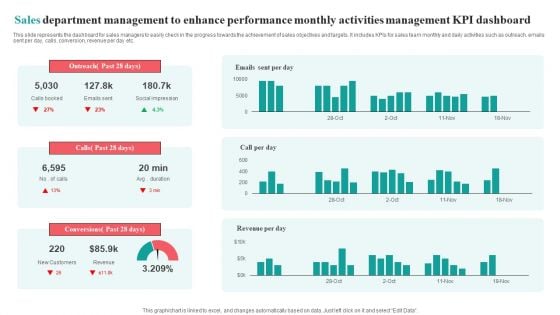
Sales Department Management To Enhance Performance Monthly Activities Management KPI Dashboard Brochure PDF
This slide represents the dashboard for sales managers to easily check in the progress towards the achievement of sales objectives and targets. It includes KPIs for sales team monthly and daily activities such as outreach, emails sent per day, calls, conversion, revenue per day etc.Pitch your topic with ease and precision using this Sales Department Management To Enhance Performance Monthly Activities Management KPI Dashboard Brochure PDF. This layout presents information on Social Impression, Conversions Past, Outreach Past. It is also available for immediate download and adjustment. So, changes can be made in the color, design, graphics or any other component to create a unique layout.
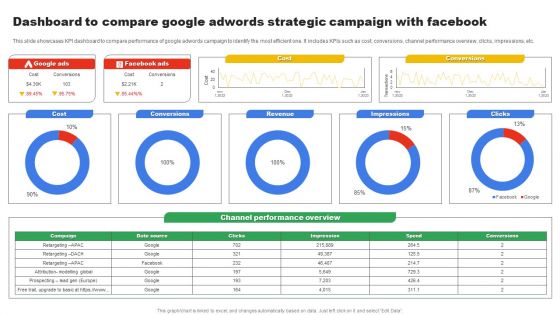
Dashboard To Compare Google Adwords Strategic Campaign With Facebook Microsoft PDF
This slide showcases KPI dashboard to compare performance of google adwords campaign to identify the most efficient one. It includes KPIs such as cost, conversions, channel performance overview, clicks, impressions, etc. Showcasing this set of slides titled Dashboard To Compare Google Adwords Strategic Campaign With Facebook Microsoft PDF. The topics addressed in these templates are Cost, Conversions, Revenue. All the content presented in this PPT design is completely editable. Download it and make adjustments in color, background, font etc. as per your unique business setting.

KPI Dashboard Of Managing Innovative Business Project Ppt Pictures Show PDF
This slide shows the KPI dashboard of innovation project management. It covers the following KPIs such as innovation success rate, value in project, total revenue, active projects, etc. Pitch your topic with ease and precision using this KPI Dashboard Of Managing Innovative Business Project Ppt Pictures Show PDF. This layout presents information on Innovation Success Rate, Total Active Projects, Amount Mission. It is also available for immediate download and adjustment. So, changes can be made in the color, design, graphics or any other component to create a unique layout.
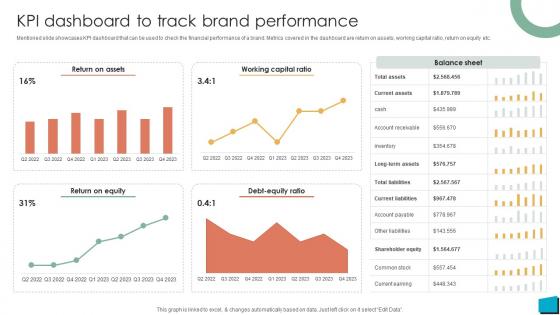
Brand Authority KPI Dashboard To Track Brand Performance Strategy SS V
Mentioned slide showcases KPI dashboard that can be used to check the financial performance of a brand. Metrics covered in the dashboard are return on assets, working capital ratio, return on equity etc. This Brand Authority KPI Dashboard To Track Brand Performance Strategy SS V is perfect for any presentation, be it in front of clients or colleagues. It is a versatile and stylish solution for organizing your meetings. The Brand Authority KPI Dashboard To Track Brand Performance Strategy SS V features a modern design for your presentation meetings. The adjustable and customizable slides provide unlimited possibilities for acing up your presentation. Slidegeeks has done all the homework before launching the product for you. So, do not wait, grab the presentation templates today Mentioned slide showcases KPI dashboard that can be used to check the financial performance of a brand. Metrics covered in the dashboard are return on assets, working capital ratio, return on equity etc.
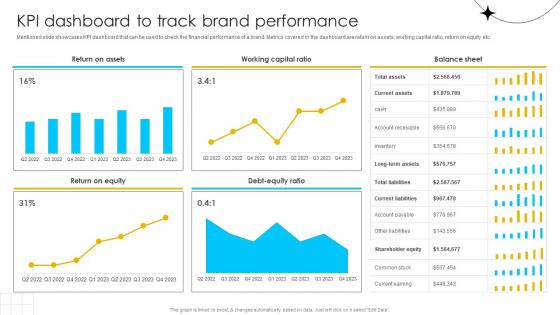
Brand Influence KPI Dashboard To Track Brand Performance Strategy SS V
Mentioned slide showcases KPI dashboard that can be used to check the financial performance of a brand. Metrics covered in the dashboard are return on assets, working capital ratio, return on equity etc. This Brand Influence KPI Dashboard To Track Brand Performance Strategy SS V is perfect for any presentation, be it in front of clients or colleagues. It is a versatile and stylish solution for organizing your meetings. The Brand Influence KPI Dashboard To Track Brand Performance Strategy SS V features a modern design for your presentation meetings. The adjustable and customizable slides provide unlimited possibilities for acing up your presentation. Slidegeeks has done all the homework before launching the product for you. So, do not wait, grab the presentation templates today Mentioned slide showcases KPI dashboard that can be used to check the financial performance of a brand. Metrics covered in the dashboard are return on assets, working capital ratio, return on equity etc.
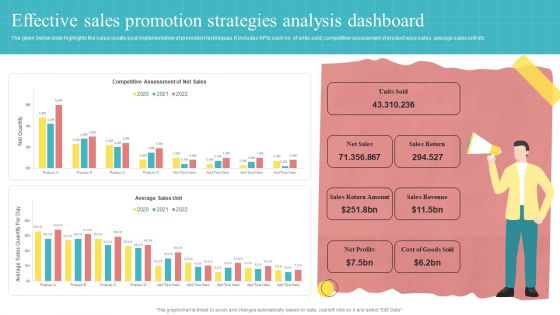
Effective Sales Promotion Strategies Analysis Dashboard Ppt PowerPoint Presentation Slides Background Designs PDF
The given below slide highlights the sales results post implementation of promotion techniques. It includes KPIs such no. of units sold, competitive assessment of product wise sales, average sales unit etc.Showcasing this set of slides titled Effective Sales Promotion Strategies Analysis Dashboard Ppt PowerPoint Presentation Slides Background Designs PDF. The topics addressed in these templates are Return Amount, Sales Return, Sales Revenue. All the content presented in this PPT design is completely editable. Download it and make adjustments in color, background, font etc. as per your unique business setting.
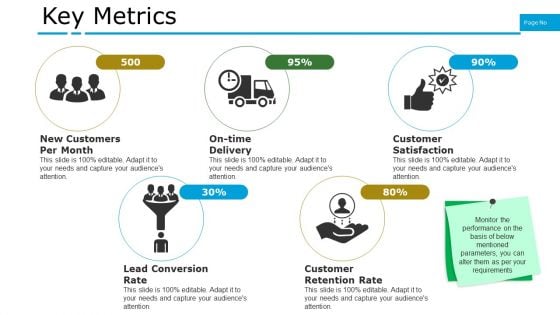
Key Metrics Ppt PowerPoint Presentation Infographics Example Topics
This is a key metrics ppt powerpoint presentation infographics example topics. This is a five stage process. The stages in this process are new customers per month, on time delivery, customer satisfaction, lead conversion rate, customer retention rate.
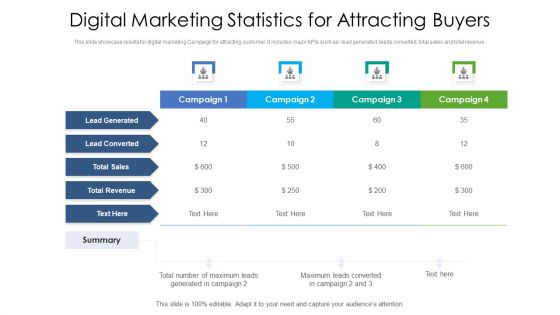
Digital Marketing Statistics For Attracting Buyers Ppt PowerPoint Presentation Gallery Graphics Tutorials PDF
This slide showcase results for digital marketing Campaign for attracting customer. It includes major KPIs such as- lead generated, leads converted, total sales and total revenue. Pitch your topic with ease and precision using this digital marketing statistics for attracting buyers ppt powerpoint presentation gallery graphics tutorials pdf. This layout presents information on revenue, sales, campaign. It is also available for immediate download and adjustment. So, changes can be made in the color, design, graphics or any other component to create a unique layout.

Three Year Expansion Business Plan For Retail Businesses Introduction PDF
The slide shows a year wise growth strategy which will help retail businesses expand and increase their revenues. It covers paid advertisements, market expansion, social media optimization, KPIs and optimal pricing model. Persuade your audience using this Three Year Expansion Business Plan For Retail Businesses Introduction PDF. This PPT design covers three stages, thus making it a great tool to use. It also caters to a variety of topics including Increases Revenue, Increases Engagement Rate, Establish Social Presence. Download this PPT design now to present a convincing pitch that not only emphasizes the topic but also showcases your presentation skills.
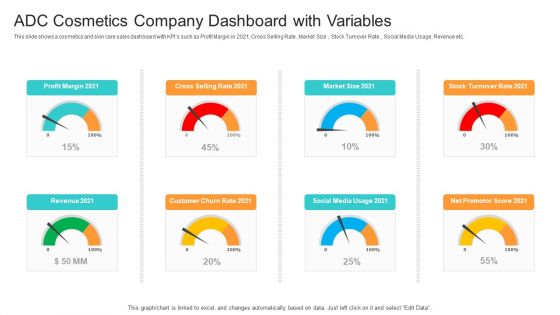
Utilization Of Current Techniques To Improve Efficiency Case Competition ADC Cosmetics Company Dashboard With Variables Diagrams PDF
This slide shows a cosmetics and skin care sales dashboard with KPIs such as Profit Margin in 2021, Cross Selling Rate , Market Size , Stock Turnover Rate , Social Media Usage, Revenue etc.Deliver and pitch your topic in the best possible manner with this utilization of current techniques to improve efficiency case competition adc cosmetics company dashboard with variables diagrams pdf. Use them to share invaluable insights on profit margin 2021, cross selling rate 2021, social media usage 2021 and impress your audience. This template can be altered and modified as per your expectations. So, grab it now.
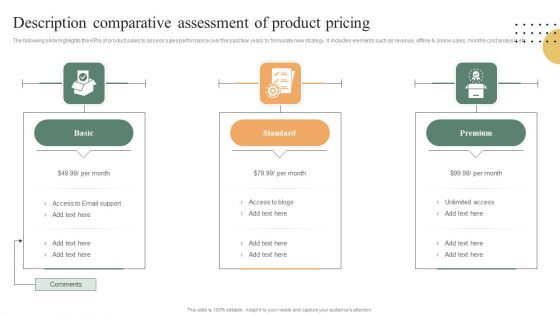
Description Comparative Assessment Of Product Pricing Ppt PowerPoint Presentation File Format Ideas PDF
The following slide highlights the KPIs of product sales to assess sales performance over the past few years to formulate new strategy. It includes elements such as revenue, offline and online sales, monthly cost analysis etc. Persuade your audience using this Description Comparative Assessment Of Product Pricing Ppt PowerPoint Presentation File Format Ideas PDF. This PPT design covers three stages, thus making it a great tool to use. It also caters to a variety of topics including Basic, Standard, Premium. Download this PPT design now to present a convincing pitch that not only emphasizes the topic but also showcases your presentation skills.
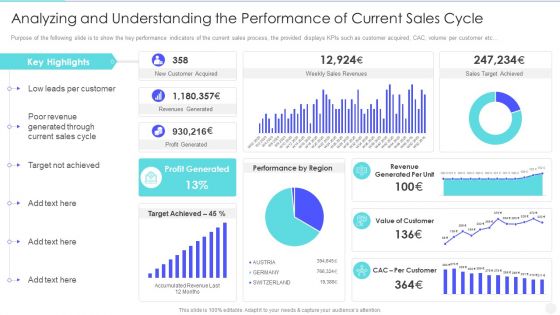
Increase Returns By Examining And Executing New Sales Qualification Procedure Analyzing And Understanding Clipart PDF
Purpose of the following slide is to show the key performance indicators of the current sales process, the provided displays KPIs such as customer acquired, CAC, volume per customer etc. Deliver an awe inspiring pitch with this creative increase returns by examining and executing new sales qualification procedure analyzing and understanding clipart pdf bundle. Topics like sales, target, revenue, profit generated, value can be discussed with this completely editable template. It is available for immediate download depending on the needs and requirements of the user.
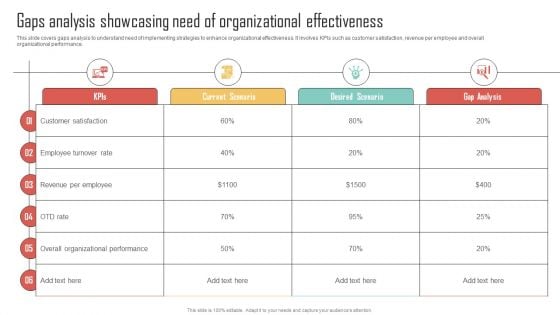
Gaps Analysis Showcasing Need Organizational Enhancing Organization Productivity By Implementing Designs PDF
This slide covers gaps analysis to understand need of implementing strategies to enhance organizational effectiveness. It involves KPIs such as customer satisfaction, revenue per employee and overall organizational performance. Find a pre-designed and impeccable Gaps Analysis Showcasing Need Organizational Enhancing Organization Productivity By Implementing Designs PDF. The templates can ace your presentation without additional effort. You can download these easy-to-edit presentation templates to make your presentation stand out from others. So, what are you waiting for Download the template from Slidegeeks today and give a unique touch to your presentation.
Facebook Advertising Campaign Performance Tracking Report Ppt PowerPoint Presentation Diagram Images PDF
This slide represents the dashboard to track and monitor the performance and effectiveness of Facebook advertising campaign. It includes details related to KPIs such as Facebook Ads amount spent, FB ads websites conversion etc. Make sure to capture your audiences attention in your business displays with our gratis customizable Facebook Advertising Campaign Performance Tracking Report Ppt PowerPoint Presentation Diagram Images PDF. These are great for business strategies, office conferences, capital raising or task suggestions. If you desire to acquire more customers for your tech business and ensure they stay satisfied, create your own sales presentation with these plain slides.
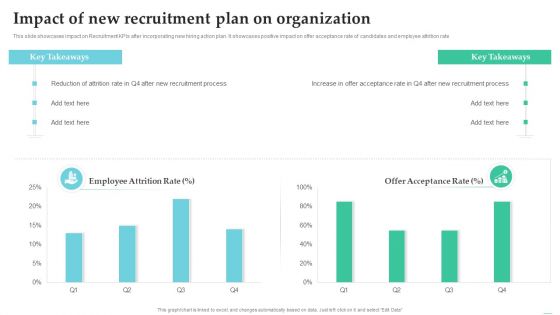
Employing Candidate Using Internal And External Mediums Of Recruitment Impact Of New Recruitment Plan On Organization Professional PDF
This slide showcases impact on Recruitment KPIs after incorporating new hiring action plan. It showcases positive impact on offer acceptance rate of candidates and employee attrition rate. Make sure to capture your audiences attention in your business displays with our gratis customizable Employing Candidate Using Internal And External Mediums Of Recruitment Impact Of New Recruitment Plan On Organization Professional PDF. These are great for business strategies, office conferences, capital raising or task suggestions. If you desire to acquire more customers for your tech business and ensure they stay satisfied, create your own sales presentation with these plain slides.
Comprehensive Guide To Acquire Customers Website Seo Marketing Content Icons PDF
This slide covers an SEO marketing activity tracking sheet for analyzing data on traffic, engagement, and links. It includes evaluation KPIs such as visits, bounce rate, conversions, FB shares, Twitter shares, Instagram shares, word length, uniqueness, timeliness, topic relevance., etc. Make sure to capture your audiences attention in your business displays with our gratis customizable Comprehensive Guide To Acquire Customers Website Seo Marketing Content Icons PDF. These are great for business strategies, office conferences, capital raising or task suggestions. If you desire to acquire more customers for your tech business and ensure they stay satisfied, create your own sales presentation with these plain slides.

Effective Manufacturing Planning And Control Administration System Understanding Scheduling Phase Microsoft PDF
This slide provides glimpse about production scheduling to plan schedules for production phases that helps the business to manage production effectively. It includes KPIs for production scheduling, key factors, etc. Make sure to capture your audiences attention in your business displays with our gratis customizable Effective Manufacturing Planning And Control Administration System Understanding Scheduling Phase Microsoft PDF. These are great for business strategies, office conferences, capital raising or task suggestions. If you desire to acquire more customers for your tech business and ensure they stay satisfied, create your own sales presentation with these plain slides.
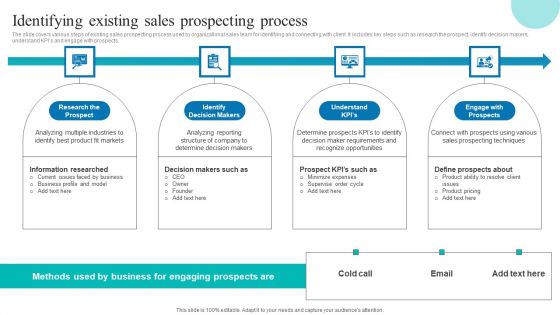
Determining Sales Enhancement Areas Identifying Existing Sales Prospecting Process Demonstration PDF
The slide covers various steps of existing sales prospecting process used by organizational sales team for identifying and connecting with client. It includes key steps such as research the prospect, identify decision makers, understand KPIs and engage with prospects. Make sure to capture your audiences attention in your business displays with our gratis customizable Determining Sales Enhancement Areas Identifying Existing Sales Prospecting Process Demonstration PDF. These are great for business strategies, office conferences, capital raising or task suggestions. If you desire to acquire more customers for your tech business and ensure they stay satisfied, create your own sales presentation with these plain slides.
Instagram Marketing To Increase Instagram Ad Campaign Performance Tracking Report Background PDF
This slide shows the report to track and monitor the performance of Instagram ad campaign conducted by the organization. It includes details related to KPIs such as budget spent, reach, CPP etc. Make sure to capture your audiences attention in your business displays with our gratis customizable Instagram Marketing To Increase Instagram Ad Campaign Performance Tracking Report Background PDF. These are great for business strategies, office conferences, capital raising or task suggestions. If you desire to acquire more customers for your tech business and ensure they stay satisfied, create your own sales presentation with these plain slides.
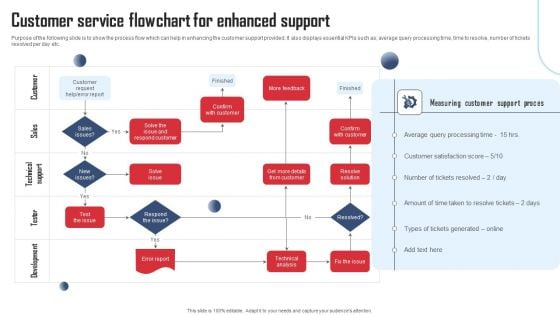
Service Distinctiveness Customer Service Flowchart For Enhanced Support Themes PDF
Purpose of the following slide is to show the process flow which can help in enhancing the customer support provided. It also displays essential KPIs such as, average query processing time, time to resolve, number of tickets resolved per day etc. Make sure to capture your audiences attention in your business displays with our gratis customizable Service Distinctiveness Customer Service Flowchart For Enhanced Support Themes PDF. These are great for business strategies, office conferences, capital raising or task suggestions. If you desire to acquire more customers for your tech business and ensure they stay satisfied, create your own sales presentation with these plain slides.
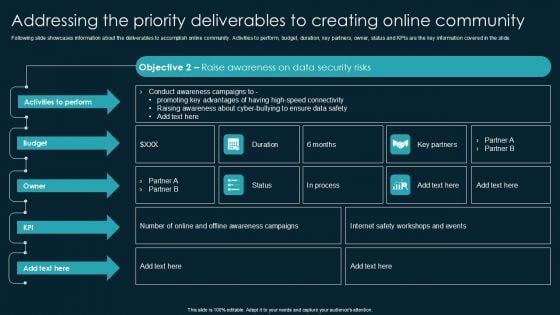
Addressing The Priority Deliverables To Creating Online Community Template PDF
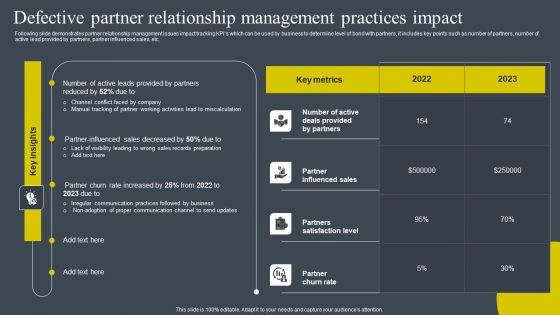
Defective Partner Relationship Management Practices Impact Demonstration PDF
Following slide demonstrates partner relationship management issues impact tracking KPIs which can be used by business to determine level of bond with partners, it includes key points such as number of partners, number of active lead provided by partners, partner influenced sales, etc. Make sure to capture your audiences attention in your business displays with our gratis customizable Defective Partner Relationship Management Practices Impact Demonstration PDF. These are great for business strategies, office conferences, capital raising or task suggestions. If you desire to acquire more customers for your tech business and ensure they stay satisfied, create your own sales presentation with these plain slides.
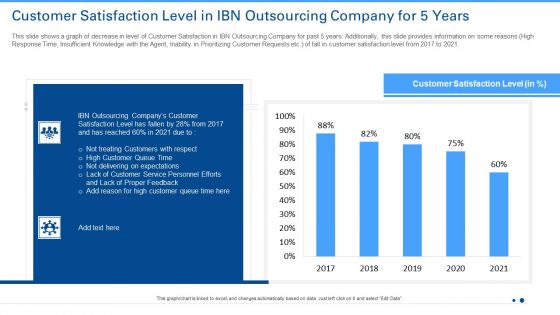
Customer Satisfaction Level In IBN Outsourcing Company For 5 Years Ppt Show Ideas PDF
This slide shows a Customer Attrition Rate Dashboard with KPIs such as Company Revenue , Customer Attrition Rate in 2021 , Annual Growth Rate , Average Customer Queue Time , Onboarding Process Effectiveness etc.Deliver and pitch your topic in the best possible manner with this customer satisfaction level in ibn outsourcing company for 5 years ppt show ideas pdf. Use them to share invaluable insights on customer satisfaction level, 2017 to 2021 and impress your audience. This template can be altered and modified as per your expectations. So, grab it now.
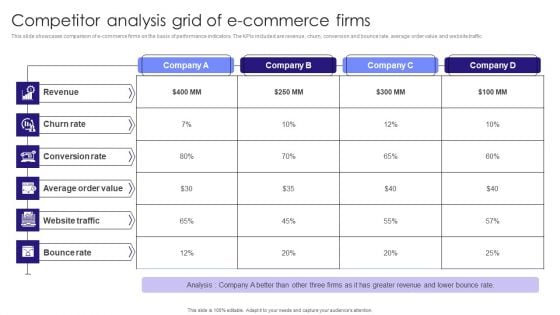
Competitor Analysis Grid Of E-Commerce Firms Professional PDF
This slide showcases comparison of e-commerce firms on the basis of performance indicators. The KPIs included are revenue, churn, conversion and bounce rate, average order value and website traffic.Pitch your topic with ease and precision using this Competitor Analysis Grid Of E-Commerce Firms Professional PDF. This layout presents information on Website Traffic, Conversion Rate, Website Traffic. It is also available for immediate download and adjustment. So, changes can be made in the color, design, graphics or any other component to create a unique layout.
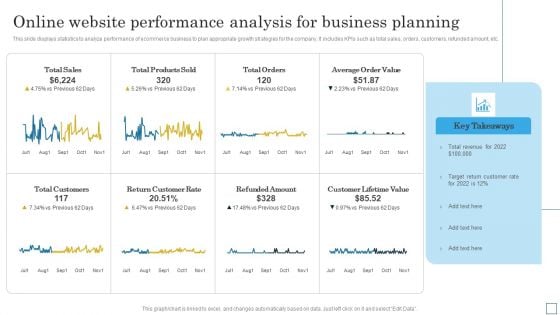
Online Website Performance Analysis For Business Planning Slides PDF
This slide displays statistics to analyze performance of ecommerce business to plan appropriate growth strategies for the company. It includes KPIs such as total sales, orders, customers, refunded amount, etc. Pitch your topic with ease and precision using this Online Website Performance Analysis For Business Planning Slides PDF. This layout presents information on Revenue, Customer Rate, Target. It is also available for immediate download and adjustment. So, changes can be made in the color, design, graphics or any other component to create a unique layout.
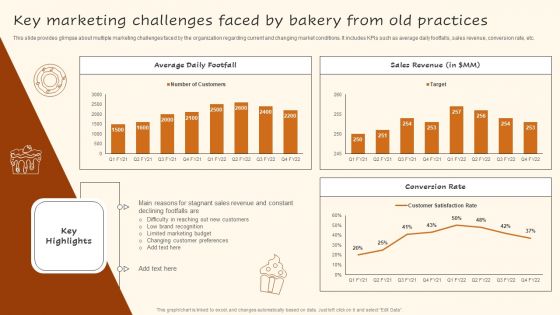
Digital Advertising Plan For Bakery Business Key Marketing Challenges Faced By Bakery Clipart PDF
This slide provides glimpse about multiple marketing challenges faced by the organization regarding current and changing market conditions. It includes KPIs such as average daily footfalls, sales revenue, conversion rate, etc. There are so many reasons you need a Digital Advertising Plan For Bakery Business Key Marketing Challenges Faced By Bakery Clipart PDF. The first reason is you can not spend time making everything from scratch, Thus, Slidegeeks has made presentation templates for you too. You can easily download these templates from our website easily.
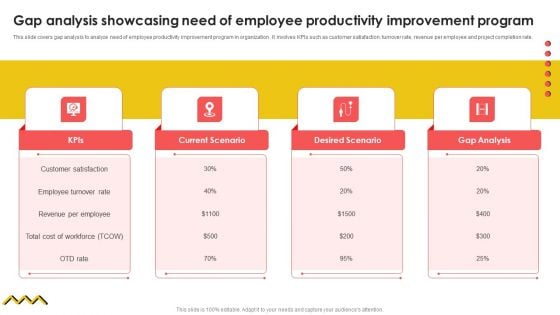
Gap Analysis Showcasing Need Of Employee Productivity Improvement Program Themes PDF
This slide covers gap analysis to analyze need of employee productivity improvement program in organization . It involves KPIs such as customer satisfaction, turnover rate, revenue per employee and project completion rate. Want to ace your presentation in front of a live audience Our Gap Analysis Showcasing Need Of Employee Productivity Improvement Program Themes PDF can help you do that by engaging all the users towards you. Slidegeeks experts have put their efforts and expertise into creating these impeccable powerpoint presentations so that you can communicate your ideas clearly. Moreover, all the templates are customizable, and easy to edit and downloadable. Use these for both personal and commercial use.
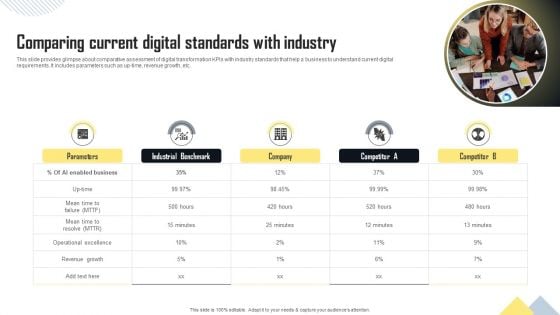
Comparing Current Digital Standards With Industry Structure PDF
This slide provides glimpse about comparative assessment of digital transformation KPIs with industry standards that help a business to understand current digital requirements. It includes parameters such as up-time, revenue growth, etc. Want to ace your presentation in front of a live audience Our Comparing Current Digital Standards With Industry Structure PDF can help you do that by engaging all the users towards you. Slidegeeks experts have put their efforts and expertise into creating these impeccable powerpoint presentations so that you can communicate your ideas clearly. Moreover, all the templates are customizable, and easy to edit and downloadable. Use these for both personal and commercial use.
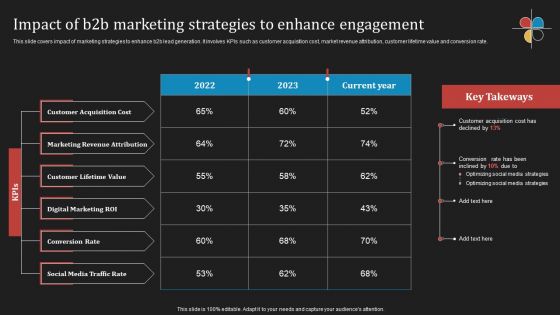
Deploying B2B Advertising Techniques For Lead Generation Impact Of B2b Marketing Strategies Ideas PDF
This slide covers impact of marketing strategies to enhance b2b lead generation. It involves KPIs such as customer acquisition cost, market revenue attribution, customer lifetime value and conversion rate. The best PPT templates are a great way to save time, energy, and resources. Slidegeeks have 100 percent editable powerpoint slides making them incredibly versatile. With these quality presentation templates, you can create a captivating and memorable presentation by combining visually appealing slides and effectively communicating your message. Download Deploying B2B Advertising Techniques For Lead Generation Impact Of B2b Marketing Strategies Ideas PDF from Slidegeeks and deliver a wonderful presentation.
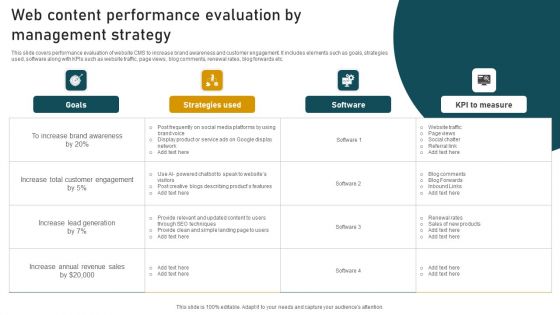
Web Content Performance Evaluation By Management Strategy Pictures PDF
This slide covers performance evaluation of website CMS to increase brand awareness and customer engagement. It includes elements such as goals, strategies used, software along with KPIs such as website traffic, page views, blog comments, renewal rates, blog forwards etc. Pitch your topic with ease and precision using this Web Content Performance Evaluation By Management Strategy Pictures PDF. This layout presents information on Customer Engagement, Lead Generation, Revenue Sales. It is also available for immediate download and adjustment. So, changes can be made in the color, design, graphics or any other component to create a unique layout.
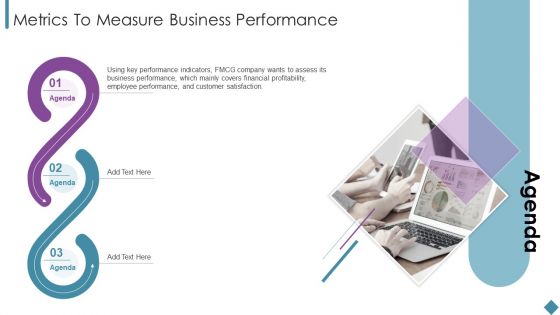
Metrics To Measure Business Performance Agenda Ppt Layouts Graphic Images PDF
This is a Metrics To Measure Business Performance Agenda Ppt Layouts Graphic Images PDF template with various stages. Focus and dispense information on three stages using this creative set, that comes with editable features. It contains large content boxes to add your information on topics like Key Performance Indicators, Financial Profitability, Customer Satisfaction. You can also showcase facts, figures, and other relevant content using this PPT layout. Grab it now.
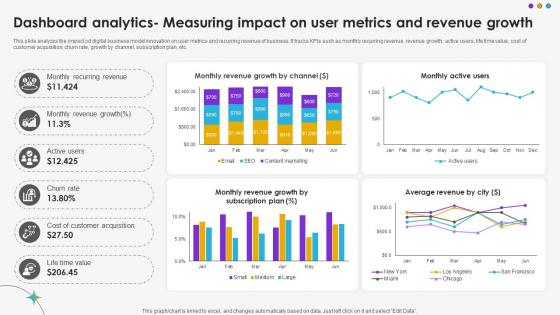
Dashboard Analytics Measuring Impact On User Metrics And Revenue Growth DT SS V
This slide analyzes the impact od digital business model innovation on user metrics and recurring revenue of business. It tracks KPIs such as monthly recurring revenue, revenue growth, active users, life time value, cost of customer acquisition, churn rate, growth by channel, subscription plan, etc.Are you searching for a Dashboard Analytics Measuring Impact On User Metrics And Revenue Growth DT SS V that is uncluttered, straightforward, and original Its easy to edit, and you can change the colors to suit your personal or business branding. For a presentation that expresses how much effort you have put in, this template is ideal With all of its features, including tables, diagrams, statistics, and lists, its perfect for a business plan presentation. Make your ideas more appealing with these professional slides. Download Dashboard Analytics Measuring Impact On User Metrics And Revenue Growth DT SS V from Slidegeeks today. This slide analyzes the impact od digital business model innovation on user metrics and recurring revenue of business. It tracks KPIs such as monthly recurring revenue, revenue growth, active users, life time value, cost of customer acquisition, churn rate, growth by channel, subscription plan, etc.
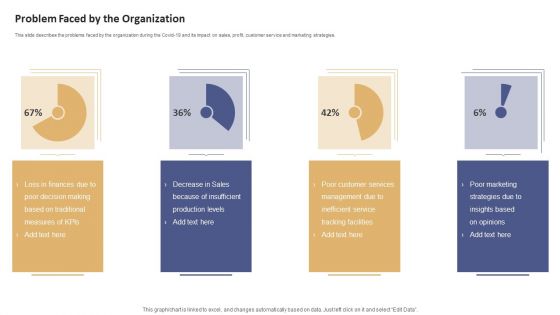
Data Processing Services Delivery Problem Faced By The Organization Sample PDF
This slide describes the problems faced by the organization during the Covid-19 and its impact on sales, profit, customer service and marketing strategies. This is a Data Processing Services Delivery Problem Faced By The Organization Sample PDF template with various stages. Focus and dispense information on four stages using this creative set, that comes with editable features. It contains large content boxes to add your information on topics like Loss Finances, Poor Decision Making, Measures KPIs, Production Levels. You can also showcase facts, figures, and other relevant content using this PPT layout. Grab it now.
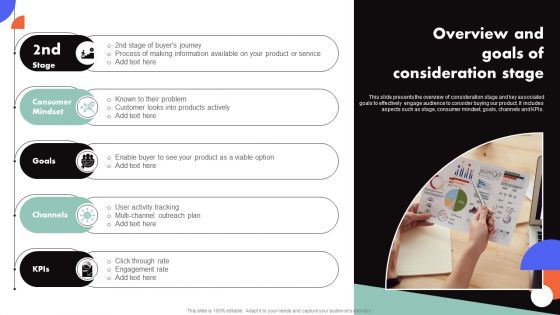
Improving Buyer Journey Through Strategic Customer Engagement Overview And Goals Of Consideration Stage Elements PDF
This slide presents the overview of consideration stage and key associated goals to effectively engage audience to consider buying our product. It includes aspects such as stage, consumer mindset, goals, channels and KPIs. Find a pre-designed and impeccable Improving Buyer Journey Through Strategic Customer Engagement Overview And Goals Of Consideration Stage Elements PDF. The templates can ace your presentation without additional effort. You can download these easy-to-edit presentation templates to make your presentation stand out from others. So, what are you waiting for Download the template from Slidegeeks today and give a unique touch to your presentation.
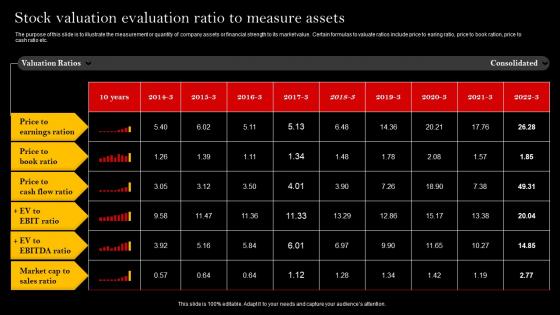
Stock Valuation Evaluation Ratio To Measure Assets Introduction Pdf
The purpose of this slide is to illustrate the measurement or quantity of company assets or financial strength to its market value. Certain formulas to valuate ratios include price to earing ratio, price to book ration, price to cash ratio etc. Pitch your topic with ease and precision using this Stock Valuation Evaluation Ratio To Measure Assets Introduction Pdf This layout presents information on Earnings Ration, Market Cap To Sales Ratio It is also available for immediate download and adjustment. So, changes can be made in the color, design, graphics or any other component to create a unique layout. The purpose of this slide is to illustrate the measurement or quantity of company assets or financial strength to its market value. Certain formulas to valuate ratios include price to earing ratio, price to book ration, price to cash ratio etc.
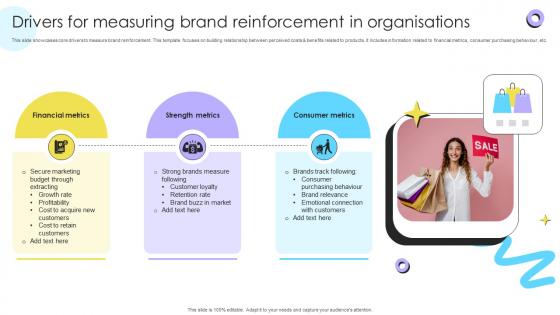
Drivers For Measuring Brand Reinforcement Encouraging Repetitive Customer Purchase Ppt Slide
This slide showcases core drivers to measure brand reinforcement. This template focuses on building relationship between perceived costs and benefits related to products. It includes information related to financial metrics, consumer purchasing behaviour, etc. Slidegeeks is here to make your presentations a breeze with Drivers For Measuring Brand Reinforcement Encouraging Repetitive Customer Purchase Ppt Slide With our easy-to-use and customizable templates, you can focus on delivering your ideas rather than worrying about formatting. With a variety of designs to choose from, you are sure to find one that suits your needs. And with animations and unique photos, illustrations, and fonts, you can make your presentation pop. So whether you are giving a sales pitch or presenting to the board, make sure to check out Slidegeeks first This slide showcases core drivers to measure brand reinforcement. This template focuses on building relationship between perceived costs and benefits related to products. It includes information related to financial metrics, consumer purchasing behaviour, etc.
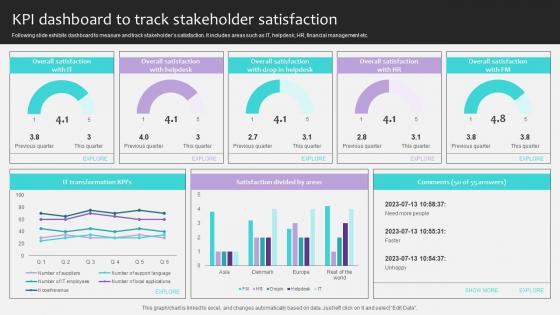
Project Stakeholders Management KPI Dashboard To Track Stakeholder Satisfaction Ppt Powerpoint
Following slide exhibits dashboard to measure and track stakeholders satisfaction. It includes areas such as IT, helpdesk, HR, financial management etc. Presenting this PowerPoint presentation, titled Project Stakeholders Management KPI Dashboard To Track Stakeholder Satisfaction Ppt Powerpoint, with topics curated by our researchers after extensive research. This editable presentation is available for immediate download and provides attractive features when used. Download now and captivate your audience. Presenting this Project Stakeholders Management KPI Dashboard To Track Stakeholder Satisfaction Ppt Powerpoint. Our researchers have carefully researched and created these slides with all aspects taken into consideration. This is a completely customizable Project Stakeholders Management KPI Dashboard To Track Stakeholder Satisfaction Ppt Powerpoint that is available for immediate downloading. Download now and make an impact on your audience. Highlight the attractive features available with our PPTs. Following slide exhibits dashboard to measure and track stakeholders satisfaction. It includes areas such as IT, helpdesk, HR, financial management etc.
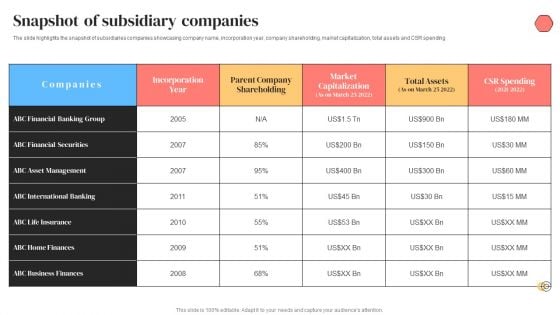
Banking Solutions Company Overview Snapshot Of Subsidiary Companies Portrait PDF
The slide highlights the snapshot of subsidiaries companies showcasing company name, incorporation year, company shareholding, market capitalization, total assets and CSR spending. Deliver and pitch your topic in the best possible manner with this Banking Solutions Company Overview Snapshot Of Subsidiary Companies Portrait PDF. Use them to share invaluable insights on Abc Financial Securities, Abc International Banking, Abc Life Insurance and impress your audience. This template can be altered and modified as per your expectations. So, grab it now.
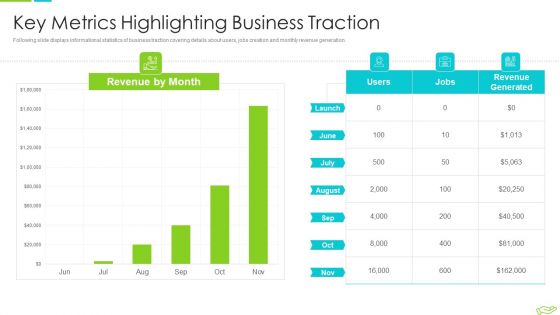
Elevator Pitch Deck To Raise Funds Key Metrics Highlighting Business Traction Clipart PDF
Following slide displays informational statistics of business traction covering details about users, jobs creation and monthly revenue generation. Deliver and pitch your topic in the best possible manner with this elevator pitch deck to raise funds key financial projections for upcoming years pictures pdf. Use them to share invaluable insights on key metrics highlighting business traction and impress your audience. This template can be altered and modified as per your expectations. So, grab it now.
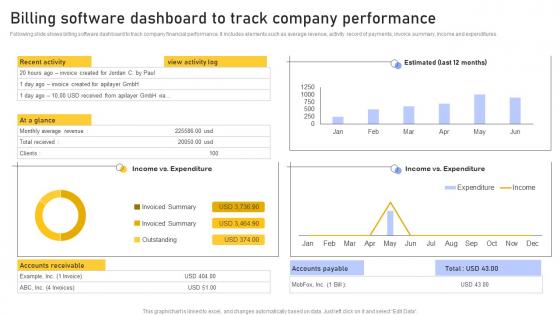
Billing Software Dashboard Enhancing Customer Service Operations Using CRM Technology Microsoft Pdf
Following slide shows billing software dashboard to track company financial performance. It includes elements such as average revenue, activity record of payments, invoice summary, income and expenditures. Create an editable Billing Software Dashboard Enhancing Customer Service Operations Using CRM Technology Microsoft Pdf that communicates your idea and engages your audience. Whether you are presenting a business or an educational presentation, pre designed presentation templates help save time. Billing Software Dashboard Enhancing Customer Service Operations Using CRM Technology Microsoft Pdf is highly customizable and very easy to edit, covering many different styles from creative to business presentations. Slidegeeks has creative team members who have crafted amazing templates. So, go and get them without any delay. Following slide shows billing software dashboard to track company financial performance. It includes elements such as average revenue, activity record of payments, invoice summary, income and expenditures.
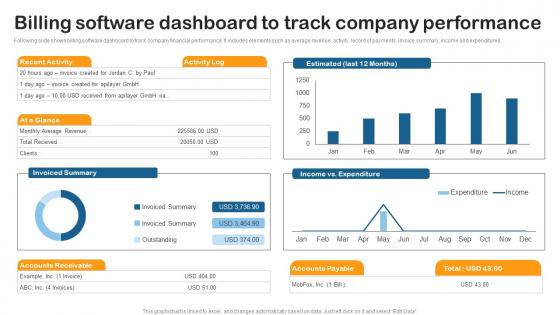
Billing Software Dashboard Track Building Utility Billing And Invoicing Management System Inspiration Pdf
Following slide shows billing software dashboard to track company financial performance. It includes elements such as average revenue, activity record of payments, invoice summary, income and expenditures. Create an editable Billing Software Dashboard Track Building Utility Billing And Invoicing Management System Inspiration Pdf that communicates your idea and engages your audience. Whether you are presenting a business or an educational presentation, pre designed presentation templates help save time. Billing Software Dashboard Track Building Utility Billing And Invoicing Management System Inspiration Pdf is highly customizable and very easy to edit, covering many different styles from creative to business presentations. Slidegeeks has creative team members who have crafted amazing templates. So, go and get them without any delay. Following slide shows billing software dashboard to track company financial performance. It includes elements such as average revenue, activity record of payments, invoice summary, income and expenditures.
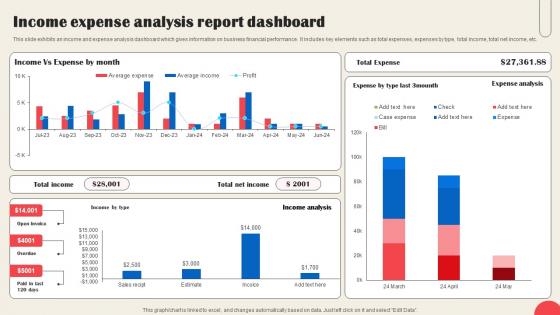
Income Expense Analysis Report Dashboard Sample Pdf
This slide exhibits an income and expense analysis dashboard which gives information on business financial performance. It includes key elements such as total expenses, expenses by type, total income, total net income, etc. Pitch your topic with ease and precision using this Income Expense Analysis Report Dashboard Sample Pdf This layout presents information on Income Expense, Analysis Report Dashboard It is also available for immediate download and adjustment. So, changes can be made in the color, design, graphics or any other component to create a unique layout. This slide exhibits an income and expense analysis dashboard which gives information on business financial performance. It includes key elements such as total expenses, expenses by type, total income, total net income, etc.
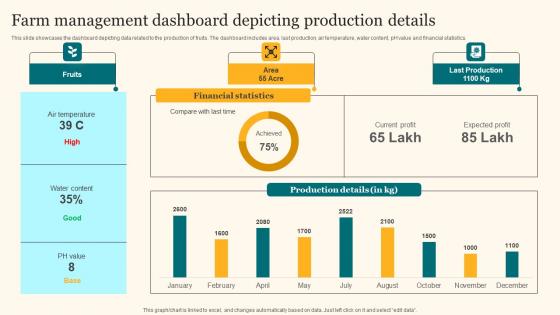
Farm Management Dashboard Depicting Agricultural Product Promotion Pictures Pdf
This slide showcases the dashboard depicting data related to the production of fruits. The dashboard includes area, last production, air temperature, water content, pH value and financial statistics. This modern and well-arranged Farm Management Dashboard Depicting Agricultural Product Promotion Pictures Pdf provides lots of creative possibilities. It is very simple to customize and edit with the Powerpoint Software. Just drag and drop your pictures into the shapes. All facets of this template can be edited with Powerpoint, no extra software is necessary. Add your own material, put your images in the places assigned for them, adjust the colors, and then you can show your slides to the world, with an animated slide included. This slide showcases the dashboard depicting data related to the production of fruits. The dashboard includes area, last production, air temperature, water content, pH value and financial statistics.
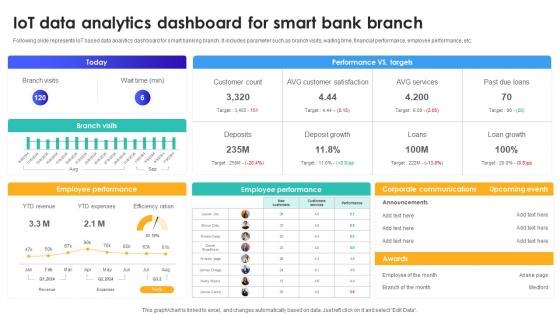
IoT Data Analytics Dashboard For Smart Bank Branch IoT In Banking For Digital Future IoT SS V
Following slide represents IoT based data analytics dashboard for smart banking branch. It includes parameter such as branch visits, waiting time, financial performance, employee performance, etc. Do you have an important presentation coming up Are you looking for something that will make your presentation stand out from the rest Look no further than IoT Data Analytics Dashboard For Smart Bank Branch IoT In Banking For Digital Future IoT SS V. With our professional designs, you can trust that your presentation will pop and make delivering it a smooth process. And with Slidegeeks, you can trust that your presentation will be unique and memorable. So why wait Grab IoT Data Analytics Dashboard For Smart Bank Branch IoT In Banking For Digital Future IoT SS V today and make your presentation stand out from the rest Following slide represents IoT based data analytics dashboard for smart banking branch. It includes parameter such as branch visits, waiting time, financial performance, employee performance, etc.
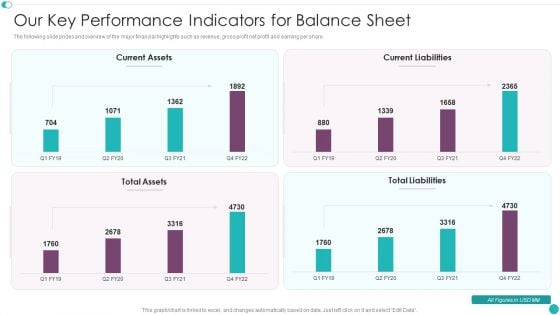
Credit Management And Recovery Policies Our Key Performance Indicators For Balance Sheet Rules PDF
The following slide prides and overview of the major financial highlights such as revenue, gross profit net profit and earning per share. Deliver an awe inspiring pitch with this creative Credit Management And Recovery Policies Our Key Performance Indicators For Balance Sheet Rules PDF bundle. Topics like Current Assets, Current Liabilities, Total Liabilities can be discussed with this completely editable template. It is available for immediate download depending on the needs and requirements of the user.
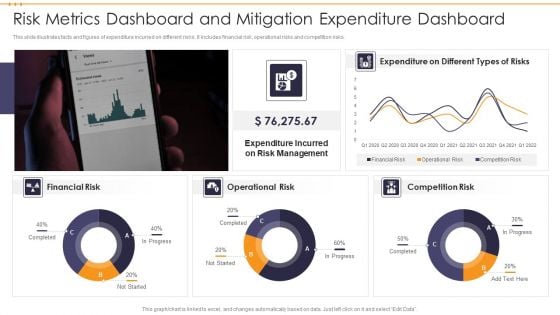
Risk Metrics Dashboard And Mitigation Expenditure Dashboard Ideas PDF
This slide illustrates facts and figures of expenditure incurred on different risks. It includes financial risk, operational risks and competition risks. Pitch your topic with ease and precision using this Risk Metrics Dashboard And Mitigation Expenditure Dashboard Ideas PDF. This layout presents information on Management, Expenditure, Risk. It is also available for immediate download and adjustment. So, changes can be made in the color, design, graphics or any other component to create a unique layout.
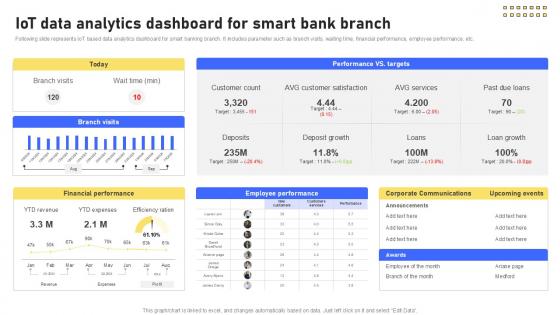
IoT Data Analytics Dashboard For Banking Future With IoT Ppt Powerpoint IoT SS V
Following slide represents IoT based data analytics dashboard for smart banking branch. It includes parameter such as branch visits, waiting time, financial performance, employee performance, etc. Slidegeeks is here to make your presentations a breeze with IoT Data Analytics Dashboard For Banking Future With IoT Ppt Powerpoint IoT SS V With our easy-to-use and customizable templates, you can focus on delivering your ideas rather than worrying about formatting. With a variety of designs to choose from, you are sure to find one that suits your needs. And with animations and unique photos, illustrations, and fonts, you can make your presentation pop. So whether you are giving a sales pitch or presenting to the board, make sure to check out Slidegeeks first Following slide represents IoT based data analytics dashboard for smart banking branch. It includes parameter such as branch visits, waiting time, financial performance, employee performance, etc.
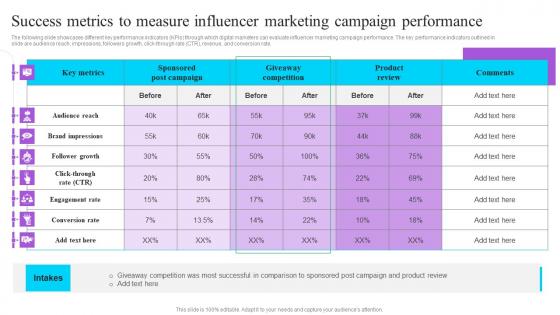
Success Metrics To Measure Influencer Marketing Campaign Performance Effective GTM Techniques Summary PDF
The following slide showcases different key performance indicators KPIs through which digital marketers can evaluate influencer marketing campaign performance. The key performance indicators outlined in slide are audience reach, impressions, followers growth, click-through rate CTR, revenue, and conversion rate. Present like a pro with Success Metrics To Measure Influencer Marketing Campaign Performance Effective GTM Techniques Summary PDF Create beautiful presentations together with your team, using our easy-to-use presentation slides. Share your ideas in real-time and make changes on the fly by downloading our templates. So whether you are in the office, on the go, or in a remote location, you can stay in sync with your team and present your ideas with confidence. With Slidegeeks presentation got a whole lot easier. Grab these presentations today. The following slide showcases different key performance indicators KPIs through which digital marketers can evaluate influencer marketing campaign performance. The key performance indicators outlined in slide are audience reach, impressions, followers growth, click-through rate CTR, revenue, and conversion rate.
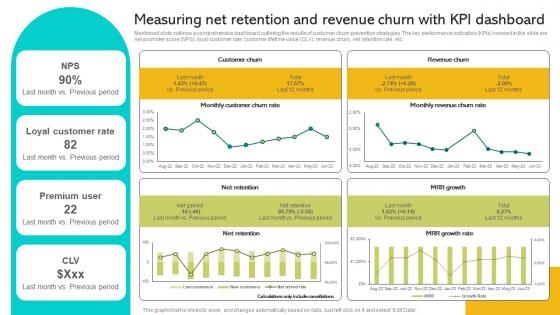
Implementing Strategies To Enhance Measuring Net Retention And Revenue Churn With Kpi Brochure PDF
Mentioned slide outlines a comprehensive dashboard outlining the results of customer churn prevention strategies. The key performance indicators KPIs covered in the slide are net promoter score NPS, loyal customer rate, customer lifetime value CLV, revenue churn, net retention rate, etc. Retrieve professionally designed ng Strategies To Enhance Measuring Net Retention And Revenue Churn With Kpi Brochure PDF to effectively convey your message and captivate your listeners. Save time by selecting pre-made slideshows that are appropriate for various topics, from business to educational purposes. These themes come in many different styles, from creative to corporate, and all of them are easily adjustable and can be edited quickly. Access them as PowerPoint templates or as Google Slides themes. You do not have to go on a hunt for the perfect presentation because Slidegeeks got you covered from everywhere. Mentioned slide outlines a comprehensive dashboard outlining the results of customer churn prevention strategies. The key performance indicators KPIs covered in the slide are net promoter score NPS, loyal customer rate, customer lifetime value CLV, revenue churn, net retention rate, etc.
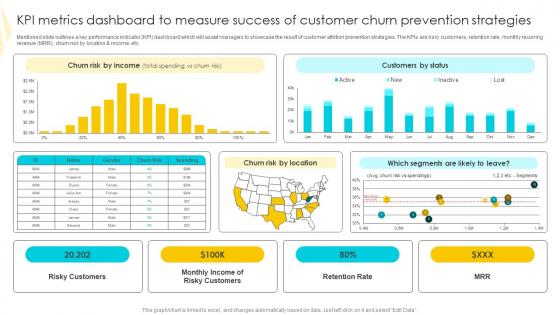
KPI Metrics Dashboard To Measure Strategies To Mitigate Customer Churn Formats Pdf
Mentioned slide outlines a key performance indicator KPI dashboard which will assist managers to showcase the result of customer attrition prevention strategies. The KPIs are risky customers, retention rate, monthly recurring revenue MRR, churn risk by location and income, etc. This KPI Metrics Dashboard To Measure Strategies To Mitigate Customer Churn Formats Pdf is perfect for any presentation, be it in front of clients or colleagues. It is a versatile and stylish solution for organizing your meetings. The KPI Metrics Dashboard To Measure Strategies To Mitigate Customer Churn Formats Pdf features a modern design for your presentation meetings. The adjustable and customizable slides provide unlimited possibilities for acing up your presentation. Slidegeeks has done all the homework before launching the product for you. So, do not wait, grab the presentation templates today Mentioned slide outlines a key performance indicator KPI dashboard which will assist managers to showcase the result of customer attrition prevention strategies. The KPIs are risky customers, retention rate, monthly recurring revenue MRR, churn risk by location and income, etc.
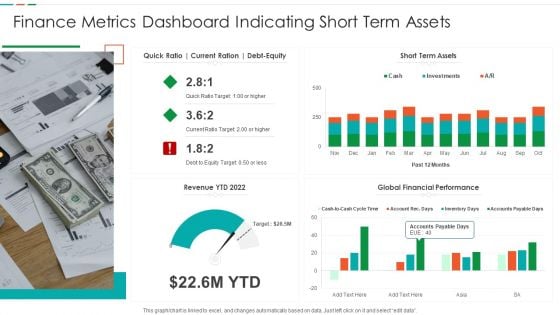
Finance Metrics Dashboard Indicating Short Term Assets Download PDF
This graph or chart is linked to excel, and changes automatically based on data. Just left click on it and select edit data. Pitch your topic with ease and precision using this Finance Metrics Dashboard Indicating Short Term Assets Download PDF. This layout presents information on Short Term Assets, Global Financial Performance, Revenue YTD 2022. It is also available for immediate download and adjustment. So, changes can be made in the color, design, graphics or any other component to create a unique layout.


 Continue with Email

 Home
Home


