Financial Planning Process
Discuss The Business Plans PowerPoint Templates Ppt Backgrounds For Slides 0513
Your thoughts will take to our Discuss The Business Plans PowerPoint Templates PPT Backgrounds For Slides Powerpoint Templates like a duck to water. They develop a binding affinity. Our People Powerpoint Templates help in a duel of wits. They get your ideas to come out on top. Put your money on our Business Powerpoint Templates. Your ideas will rake in the dollars. Recieve bountiful returns with our Discuss The Business Plans PowerPoint Templates Ppt Backgrounds For Slides 0513. Get abundant applause from the audience.
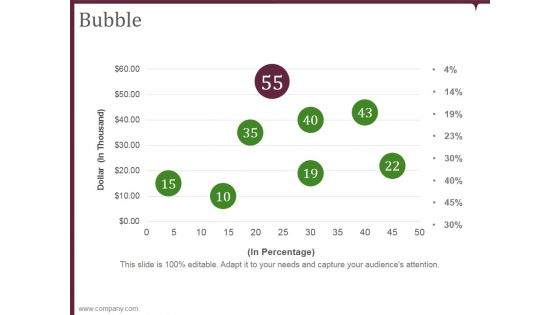
bubble ppt powerpoint presentation infographics
This is a bubble ppt powerpoint presentation infographics. This is a eight stage process. The stages in this process are business, marketing, finance, analysis, management.
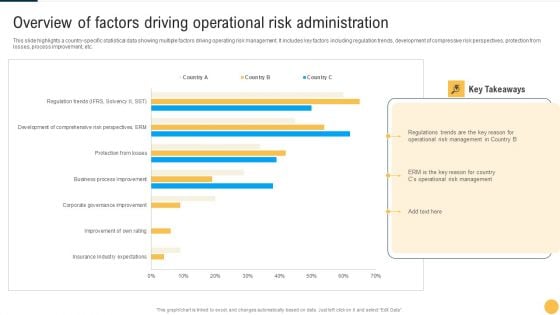
Overview Of Factors Driving Operational Risk Administration Summary PDF
This slide highlights a country specific statistical data showing multiple factors driving operating risk management. It includes key factors including regulation trends, development of compressive risk perspectives, protection from losses, process improvement, etc. Pitch your topic with ease and precision using this Overview Of Factors Driving Operational Risk Administration Summary PDF This layout presents information on Key Takeaways, Risk Management, Administration. It is also available for immediate download and adjustment. So, changes can be made in the color, design, graphics or any other component to create a unique layout.
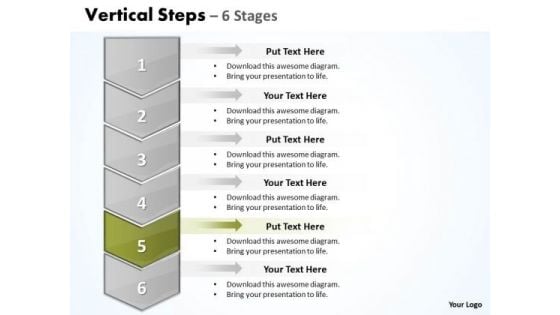
Usa PowerPoint Template Vertical Steps 6 1 Project Management Ppt Image
USA PowerPoint template vertical steps 6 1 project management ppt Image-Vertical diagrams are usually used to represent a process as a list of steps. Constant monitoring of the processes provides you with opportunities to concentrate on the core competencies in your business and improve the standards for more effective results. -USA PowerPoint template vertical steps 6 1 project management ppt Image-Arrow, Background, Business, Chart, Diagram, Financial, Graphic, Gray, Icon, Illustration, Management, Orange, Perspective, Planning, Process, Process, Stages, Steps, Text Our Usa PowerPoint Template Vertical Steps 6 1 Project Management Ppt Image will be an extension of you. You will accept them as your alter ego.
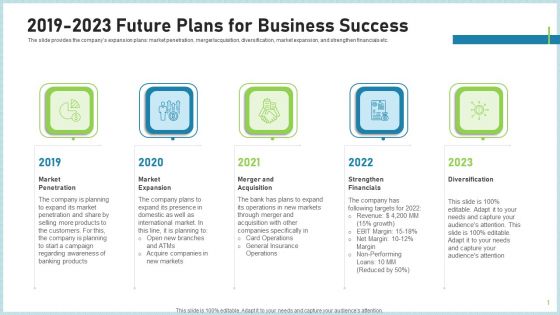
Pitch Deck To Attract Funding After IPO Market 2019 To 2023 Future Plans For Business Success Professional PDF
The slide provides the companys expansion plans market penetration, merger or acquisition, diversification, market expansion, and strengthen financials etc.This is a pitch deck to attract funding after ipo market 2019 to 2023 future plans for business success professional pdf template with various stages. Focus and dispense information on five stages using this creative set, that comes with editable features. It contains large content boxes to add your information on topics like market penetration, market expansion, merger and acquisition. You can also showcase facts, figures, and other relevant content using this PPT layout. Grab it now.
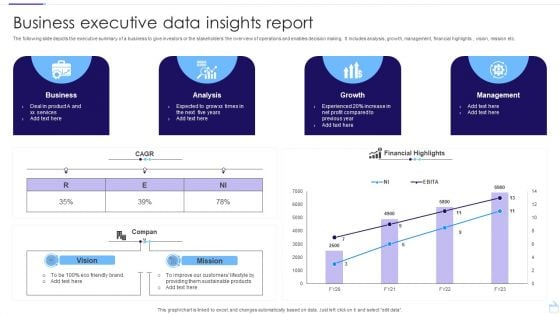
Business Executive Data Insights Report Pictures PDF
The following slide depicts the executive summary of a business to give investors or the stakeholders the overview of operations and enables decision making. It includes analysis, growth, management, financial highlights , vision, mission etc. Pitch your topic with ease and precision using this Business Executive Data Insights Report Pictures PDF. This layout presents information on Business, Analysis, Growth. It is also available for immediate download and adjustment. So, changes can be made in the color, design, graphics or any other component to create a unique layout.
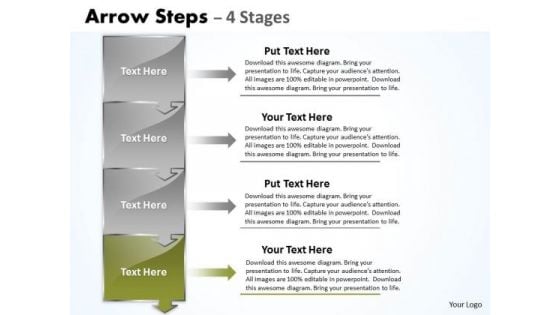
Usa Ppt Background Arrow Create PowerPoint Macro 4 Stage 5 Image
USA PPT Background arrow create powerpoint macro 4 stage 5 Image-Visually support your Microsoft office PPT Presentation with our above template illustrating vertical block list. It is a useful captivating tool conceived to enable you to define your message in your business and finance PPT presentations. Create captivating presentations to deliver comparative and weighted arguments.-USA PPT Background arrow create powerpoint macro 4 stage 5 Image-Arrow, Background, Business, Chart, Diagram, Financial, Graphic, Gray, Icon, Illustration, Management, Orange, Perspective, Planning, Process, Shapes, Metaphor, Stages, Steps, Text Influence teams with our Usa Ppt Background Arrow Create PowerPoint Macro 4 Stage 5 Image. Download without worries with our money back guaranteee.
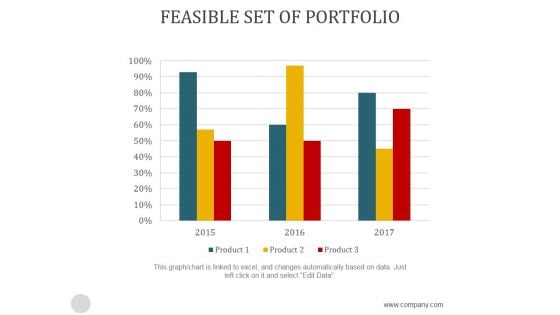
Feasible Set Of Portfolio Ppt PowerPoint Presentation Pictures
This is a feasible set of portfolio ppt powerpoint presentation pictures. This is a three stage process. The stages in this process are portfolio, business analysis, marketing, process.
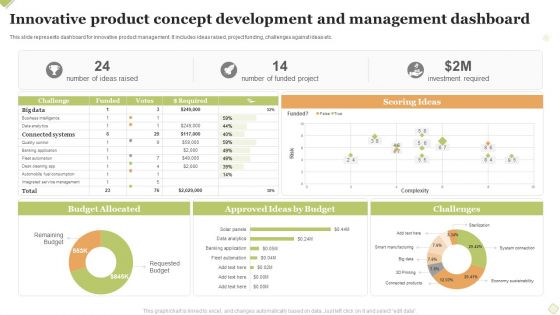
Innovative Product Concept Development And Management Dashboard Introduction PDF
This slide represents dashboard for innovative product management. It includes ideas raised, project funding, challenges against ideas etc. Pitch your topic with ease and precision using this Innovative Product Concept Development And Management Dashboard Introduction PDF This layout presents information on Scoring Ideas, Budget Allocated, Challenges. It is also available for immediate download and adjustment. So, changes can be made in the color, design, graphics or any other component to create a unique layout.
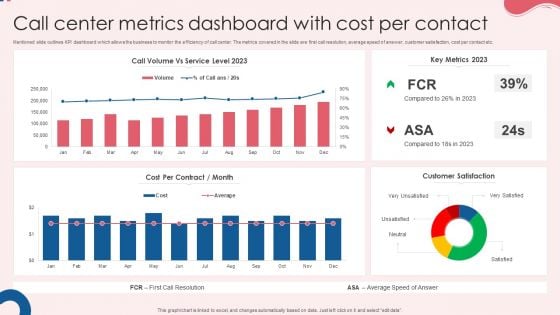
Call Center Metrics Dashboard With Cost Per Contact Rules PDF
Mentioned slide outlines KPI dashboard which allows the business to monitor the efficiency of call center. The metrics covered in the slide are first call resolution, average speed of answer, customer satisfaction, cost per contact etc. Pitch your topic with ease and precision using this Call Center Metrics Dashboard With Cost Per Contact Rules PDF. This layout presents information on Cost Per Contract, Key Metrics, Customer Satisfaction. It is also available for immediate download and adjustment. So, changes can be made in the color, design, graphics or any other component to create a unique layout.
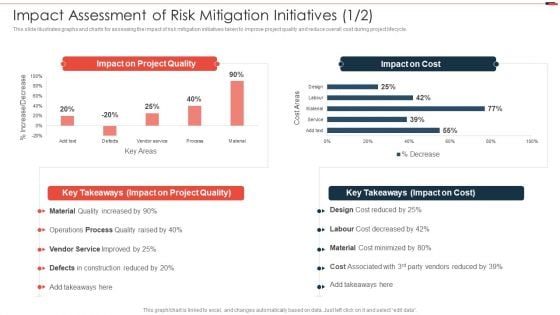
Commercial Property Development Impact Assessment Of Risk Mitigation Initiatives Slides PDF
This slide illustrates graphs and charts for assessing the impact of risk mitigation initiatives taken to improve project quality and reduce overall cost during project lifecycle. Deliver an awe inspiring pitch with this creative commercial property development impact assessment of risk mitigation initiatives slides pdf bundle. Topics like impact project quality, impact cost, operations process, quality raised can be discussed with this completely editable template. It is available for immediate download depending on the needs and requirements of the user.

Newspaper Ppt PowerPoint Presentation Microsoft
This is a newspaper ppt powerpoint presentation microsoft. This is a one stage process. The stages in this process are business, information, planning, business people, communication.
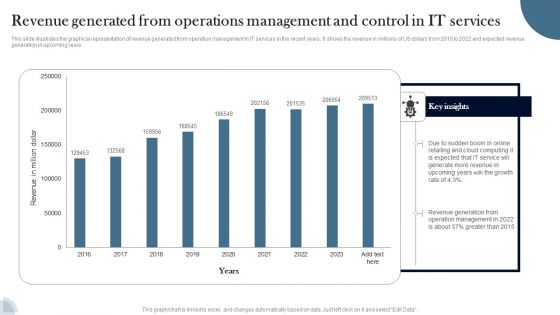
Revenue Generated From Operations Management And Control In IT Services Guidelines PDF
This slide illustrates the graphical representation of revenue generated from operation management in IT services in the recent years. It shows the revenue in millions of US dollars from 2015 to 2022 and expected revenue generation in upcoming years. Pitch your topic with ease and precision using this Revenue Generated From Operations Management And Control In IT Services Guidelines PDF. This layout presents information on Revenue, IT Service, Cloud Computing. It is also available for immediate download and adjustment. So, changes can be made in the color, design, graphics or any other component to create a unique layout.
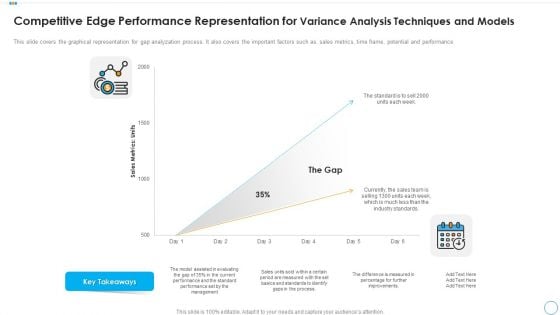
Competitive Edge Performance Representation For Variance Analysis Techniques And Models Ideas PDF
This slide covers the graphical representation for gap analyzation process. It also covers the important factors such as, sales metrics, time frame, potential and performance. Showcasing this set of slides titled competitive edge performance representation for variance analysis techniques and models ideas pdf. The topics addressed in these templates are competitive edge performance representation for variance analysis techniques and models. All the content presented in this PPT design is completely editable. Download it and make adjustments in color, background, font etc. as per your unique business setting.
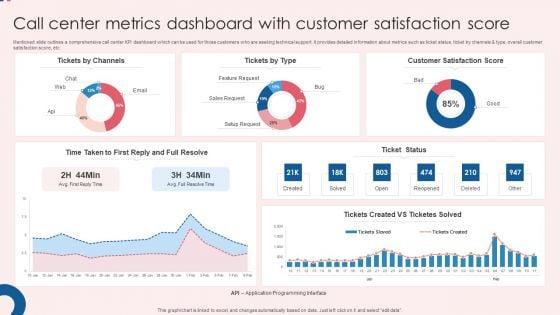
Call Center Metrics Dashboard With Customer Satisfaction Score Ideas PDF
Mentioned slide outlines a comprehensive call center KPI dashboard which can be used for those customers who are seeking technical support. It provides detailed information about metrics such as ticket status, ticket by channels and type, overall customer satisfaction score, etc. Showcasing this set of slides titled Call Center Metrics Dashboard With Customer Satisfaction Score Ideas PDF. The topics addressed in these templates are Customer Satisfaction, Score Ticket Status, Satisfaction Score. All the content presented in this PPT design is completely editable. Download it and make adjustments in color, background, font etc. as per your unique business setting.
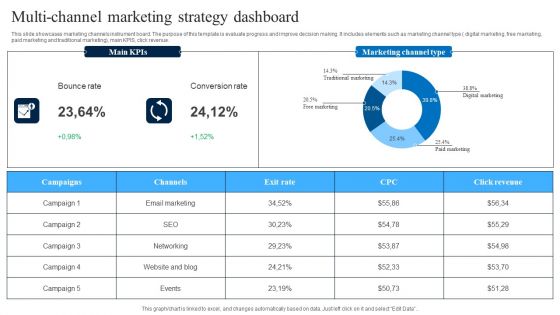
Multi Channel Marketing Strategy Dashboard Slides PDF
This slide showcases marketing channels instrument board. The purpose of this template is evaluate progress and improve decision making. It includes elements such as marketing channel type digital marketing, free marketing, paid marketing and traditional marketing, main KPIS, click revenue. Pitch your topic with ease and precision using this Multi Channel Marketing Strategy Dashboard Slides PDF. This layout presents information on Bounce Rate, Conversion Rate, Marketing Channel Type. It is also available for immediate download and adjustment. So, changes can be made in the color, design, graphics or any other component to create a unique layout.
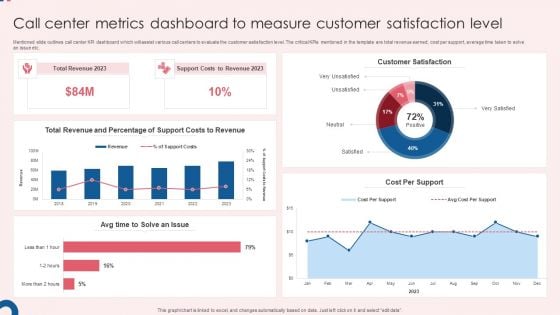
Call Center Metrics Dashboard To Measure Customer Satisfaction Level Slides PDF
Mentioned slide outlines call center KPI dashboard which will assist various call centers to evaluate the customer satisfaction level. The critical KPIs mentioned in the template are total revenue earned, cost per support, average time taken to solve an issue etc. Showcasing this set of slides titled Call Center Metrics Dashboard To Measure Customer Satisfaction Level Slides PDF. The topics addressed in these templates are Total Revenue, Support Costs, Customer Satisfaction. All the content presented in this PPT design is completely editable. Download it and make adjustments in color, background, font etc. as per your unique business setting.
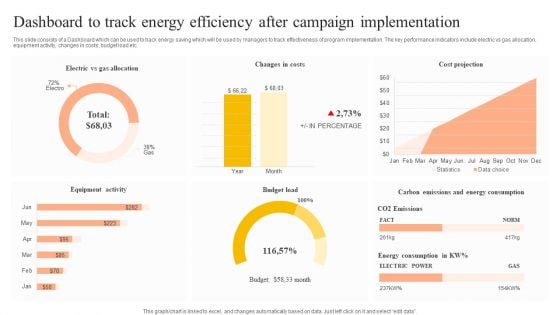
Dashboard To Track Energy Efficiency After Campaign Implementation Pictures PDF
This slide consists of a Dashboard which can be used to track energy saving which will be used by managers to track effectiveness of program implementation. The key performance indicators include electric vs gas allocation, equipment activity, changes in costs, budget load etc. Showcasing this set of slides titled Dashboard To Track Energy Efficiency After Campaign Implementation Pictures PDF. The topics addressed in these templates are Equipment Activity, Budget Load, Cost Projection. All the content presented in this PPT design is completely editable. Download it and make adjustments in color, background, font etc. as per your unique business setting.
Integrated Digital Marketing Strategy Dashboard For Lead Conversion Icons PDF
Following slide illustrates integrated marketing campaign dashboard utilized by organizations to improve business agility and increase operational efficiency. This slide provides data regarding lead conversion by campaign and channel, amount spent per campaign, monthly lead generations, etc. Showcasing this set of slides titled Integrated Digital Marketing Strategy Dashboard For Lead Conversion Icons PDF. The topics addressed in these templates are Total Page Views, Average Session Duration, Conversion. All the content presented in this PPT design is completely editable. Download it and make adjustments in color, background, font etc. as per your unique business setting.
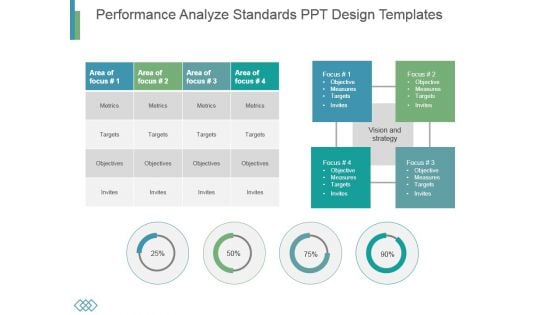
Performance Analyze Standards Ppt Design Templates
This is a performance analyze standards ppt design templates. This is a four stage process. The stages in this process are metrics, targets, objectives, invites.
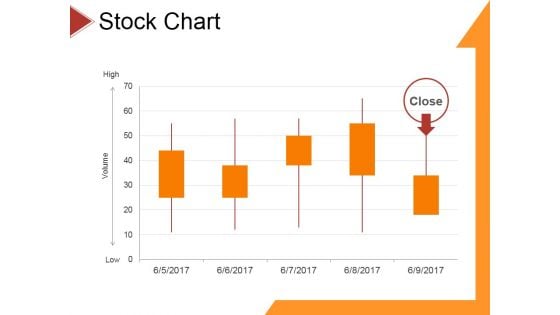
Stock Chart Ppt PowerPoint Presentation File Ideas
This is a stock chart ppt powerpoint presentation file ideas. This is a five stage process. The stages in this process are business, strategy, analysis, pretention, finance.
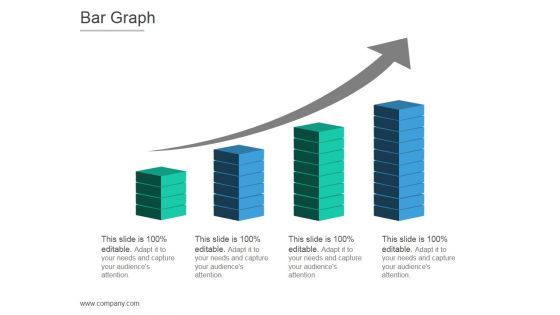
Bar Graph Ppt PowerPoint Presentation Templates
This is a bar graph ppt powerpoint presentation templates. This is a four stage process. The stages in this process are arrows, business, marketing, strategy, growth, graphic.
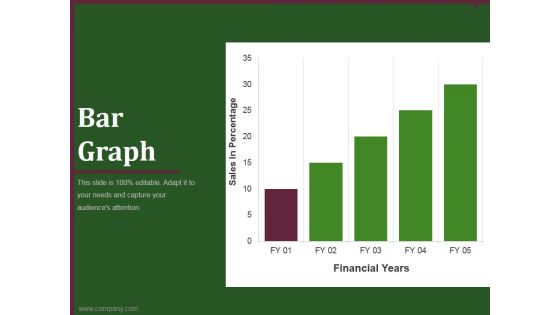
bar graph template 1 ppt powerpoint presentation infographics
This is a bar graph template 1 ppt powerpoint presentation infographics. This is a five stage process. The stages in this process are business, marketing, graph, analysis, growth.
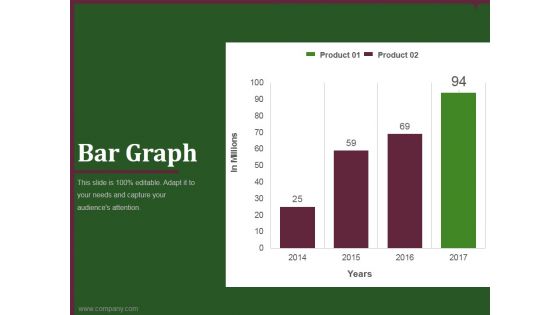
bar graph template 2 ppt powerpoint presentation gallery
This is a bar graph template 2 ppt powerpoint presentation gallery. This is a four stage process. The stages in this process are business, marketing, product, analysis, growth.
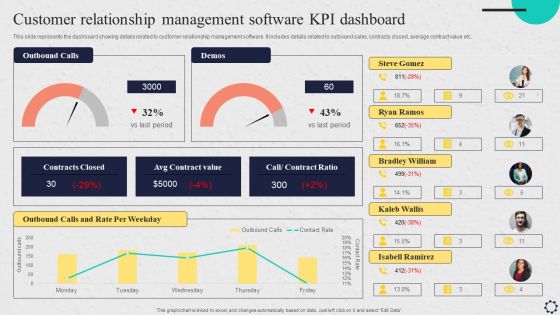
Software Implementation Strategy Customer Relationship Management Software Kpi Dashboard Clipart PDF
This slide represents the dashboard showing details related to customer relationship management software. It includes details related to outbound sales, contracts closed, average contract value etc. Are you in need of a template that can accommodate all of your creative concepts This one is crafted professionally and can be altered to fit any style. Use it with Google Slides or PowerPoint. Include striking photographs, symbols, depictions, and other visuals. Fill, move around, or remove text boxes as desired. Test out color palettes and font mixtures. Edit and save your work, or work with colleagues. Download Software Implementation Strategy Customer Relationship Management Software Kpi Dashboard Clipart PDF and observe how to make your presentation outstanding. Give an impeccable presentation to your group and make your presentation unforgettable.
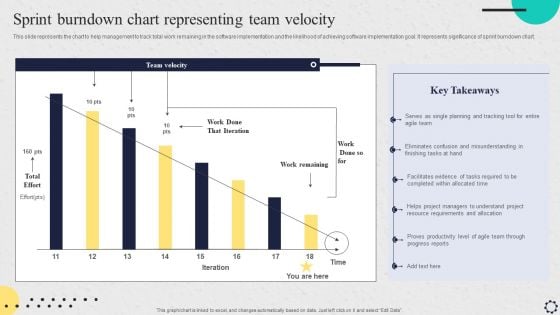
Software Implementation Strategy Sprint Burndown Chart Representing Team Velocity Brochure PDF
This slide represents the chart to help management to track total work remaining in the software implementation and the likelihood of achieving software implementation goal. It represents significance of sprint burndown chart. If your project calls for a presentation, then Slidegeeks is your go to partner because we have professionally designed, easy to edit templates that are perfect for any presentation. After downloading, you can easily edit Software Implementation Strategy Sprint Burndown Chart Representing Team Velocity Brochure PDF and make the changes accordingly. You can rearrange slides or fill them with different images. Check out all the handy templates.
Contact Us Ppt PowerPoint Presentation Picture
This is a contact us ppt powerpoint presentation picture. This is a four stage process. The stages in this process are business, marketing, contact us, information, management.
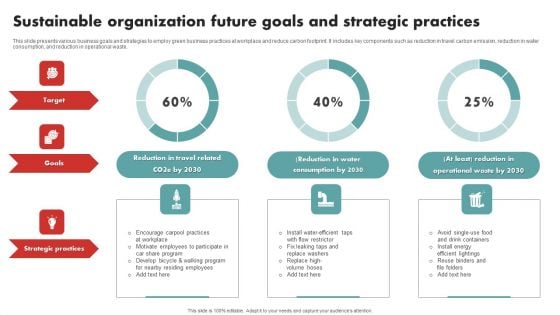
Sustainable Organization Future Goals And Strategic Practices Sample PDF
This slide presents various business goals and strategies to employ green business practices at workplace and reduce carbon footprint. It includes key components such as reduction in travel carbon emission, reduction in water consumption, and reduction in operational waste. Pitch your topic with ease and precision using this Sustainable Organization Future Goals And Strategic Practices Sample PDF This layout presents information on Goals, Target, Strategic Practices. It is also available for immediate download and adjustment. So, changes can be made in the color, design, graphics or any other component to create a unique layout.
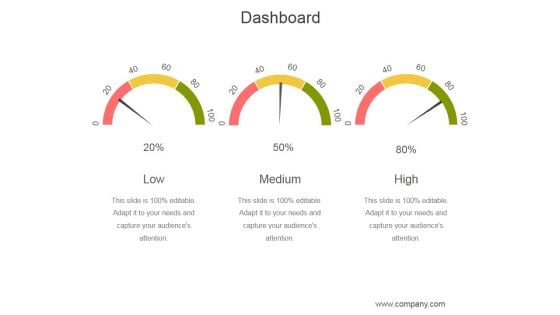
Dashboard Ppt PowerPoint Presentation Examples
This is a dashboard ppt powerpoint presentation examples. This is a three stage process. The stages in this process are low, medium, high.
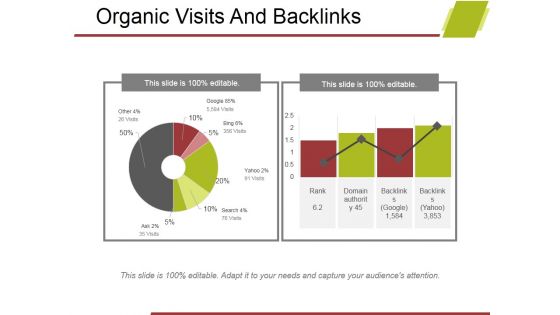
Organic Visits And Backlinks Ppt PowerPoint Presentation Professional Aids
This is a organic visits and backlinks ppt powerpoint presentation professional aids. This is a two stage process. The stages in this process are rank, domain authority, backlinks.

Location Ppt PowerPoint Presentation Gallery Master Slide
This is a location ppt powerpoint presentation gallery master slide. This is a four stage process. The stages in this process are usa, brazil, india, australia.
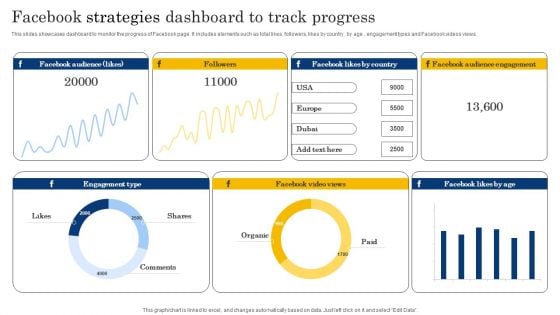
Facebook Strategies Dashboard To Track Progress Structure PDF
This slides showcases dashboard to monitor the progress of Facebook page. It includes elements such as total likes, followers, likes by country, by age , engagement types and Facebook videos views. Pitch your topic with ease and precision using this Facebook Strategies Dashboard To Track Progress Structure PDF. This layout presents information on Followers, Engagement Type, Shares. It is also available for immediate download and adjustment. So, changes can be made in the color, design, graphics or any other component to create a unique layout.
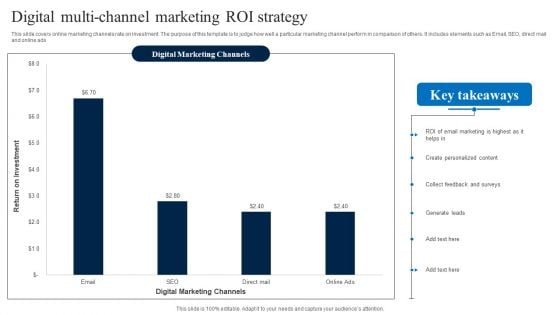
Digital Multi Channel Marketing Roi Strategy Clipart PDF
This slide covers online marketing channels rate on investment. The purpose of this template is to judge how well a particular marketing channel perform in comparison of others. It includes elements such as Email, SEO, direct mail and online ads Showcasing this set of slides titled Digital Multi Channel Marketing Roi Strategy Clipart PDF. The topics addressed in these templates are Return On Investment, Digital Marketing Channels, Key Takeaways. All the content presented in this PPT design is completely editable. Download it and make adjustments in color, background, font etc. as per your unique business setting.
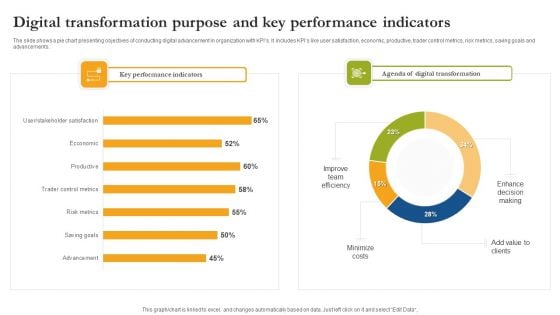
Digital Transformation Purpose And Key Performance Indicators Formats PDF
The slide shows a pie chart presenting objectives of conducting digital advancement in organization with KPIs. It includes KPIs like user satisfaction, economic, productive, trader control metrics, risk metrics, saving goals and advancements. Pitch your topic with ease and precision using this Digital Transformation Purpose And Key Performance Indicators Formats PDF. This layout presents information on Key Performance Indicators, Digital Transformation, Minimize Costs. It is also available for immediate download and adjustment. So, changes can be made in the color, design, graphics or any other component to create a unique layout.
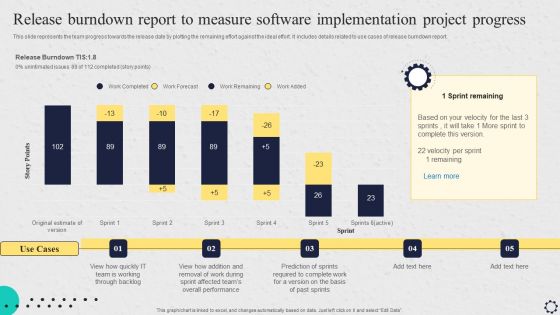
Software Implementation Strategy Release Burndown Report To Measure Software Implementation Project Progress Introduction PDF
This slide represents the team progress towards the release date by plotting the remaining effort against the ideal effort. It includes details related to use cases of release burndown report. Formulating a presentation can take up a lot of effort and time, so the content and message should always be the primary focus. The visuals of the PowerPoint can enhance the presenters message, so our Software Implementation Strategy Release Burndown Report To Measure Software Implementation Project Progress Introduction PDF was created to help save time. Instead of worrying about the design, the presenter can concentrate on the message while our designers work on creating the ideal templates for whatever situation is needed. Slidegeeks has experts for everything from amazing designs to valuable content, we have put everything into Software Implementation Strategy Release Burndown Report To Measure Software Implementation Project Progress Introduction PDF
Software Implementation Project Progress Tracking Dashboard Summary PDF
This slide represents the dashboard to track the progress of software implementation project. It includes details related to health, tasks, project, time, cost and workload of software implementation project. If you are looking for a format to display your unique thoughts, then the professionally designed Software Implementation Project Progress Tracking Dashboard Summary PDF is the one for you. You can use it as a Google Slides template or a PowerPoint template. Incorporate impressive visuals, symbols, images, and other charts. Modify or reorganize the text boxes as you desire. Experiment with shade schemes and font pairings. Alter, share or cooperate with other people on your work. Download Software Implementation Project Progress Tracking Dashboard Summary PDFSoftware Implementation Project Progress Tracking Dashboard Summary PDF and find out how to give a successful presentation. Present a perfect display to your team and make your presentation unforgettable.
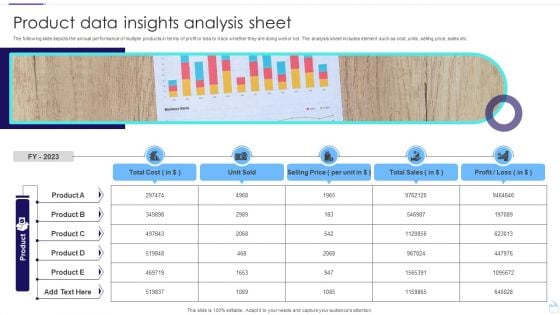
Product Data Insights Analysis Sheet Infographics PDF
The following slide depicts the annual performance of multiple products in terms of profit or loss to track whether they are doing well or not. The analysis sheet includes element such as cost, units, selling price, sales etc. Pitch your topic with ease and precision using this Product Data Insights Analysis Sheet Infographics PDF. This layout presents information on Unit Sold, Selling Price, Total Sales. It is also available for immediate download and adjustment. So, changes can be made in the color, design, graphics or any other component to create a unique layout.
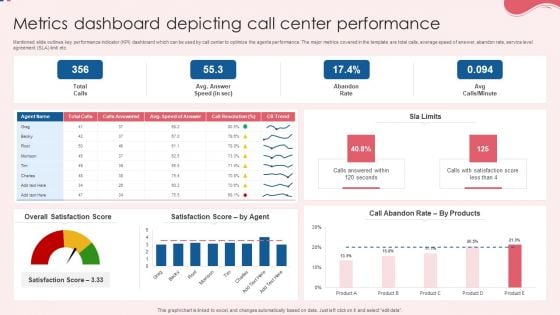
Metrics Dashboard Depicting Call Center Performance Pictures PDF
Mentioned slide outlines key performance indicator KPI dashboard which can be used by call center to optimize the agents performance. The major metrics covered in the template are total calls, average speed of answer, abandon rate, service level agreement SLA limit etc. Pitch your topic with ease and precision using this Metrics Dashboard Depicting Call Center Performance Pictures PDF. This layout presents information on Overall Satisfaction Score, Satisfaction Score, Performance. It is also available for immediate download and adjustment. So, changes can be made in the color, design, graphics or any other component to create a unique layout.
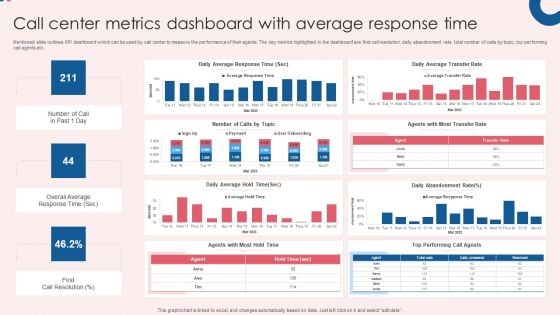
Call Center Metrics Dashboard With Average Response Time Inspiration PDF
Mentioned slide outlines KPI dashboard which can be used by call center to measure the performance of their agents. The key metrics highlighted in the dashboard are first call resolution, daily abandonment rate, total number of calls by topic, top performing call agents etc. Showcasing this set of slides titled Call Center Metrics Dashboard With Average Response Time Inspiration PDF. The topics addressed in these templates are Efficiency, Quality, Activity, Daily Average Response, Daily Average Transfer. All the content presented in this PPT design is completely editable. Download it and make adjustments in color, background, font etc. as per your unique business setting.
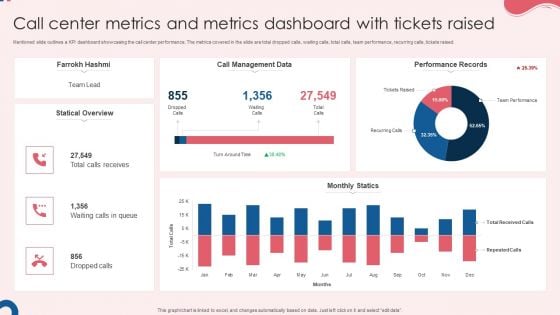
Call Center Metrics And Metrics Dashboard With Tickets Raised Graphics PDF
Mentioned slide outlines a KPI dashboard showcasing the call center performance. The metrics covered in the slide are total dropped calls, waiting calls, total calls, team performance, recurring calls, tickets raised. Showcasing this set of slides titled Call Center Metrics And Metrics Dashboard With Tickets Raised Graphics PDF. The topics addressed in these templates are Call Management Data, Monthly Statics, Performance Records. All the content presented in this PPT design is completely editable. Download it and make adjustments in color, background, font etc. as per your unique business setting.
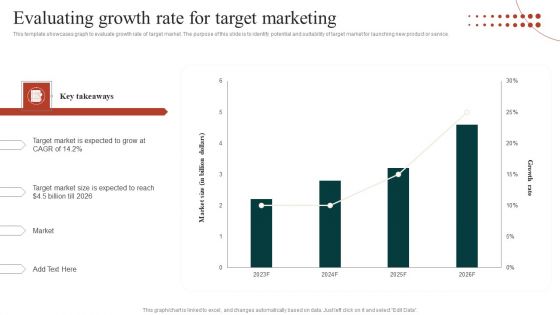
Target Marketing Techniques Evaluating Growth Rate For Target Marketing Slides PDF
This template showcases graph to evaluate growth rate of target market. The purpose of this slide is to identify potential and suitability of target market for launching new product or service. Boost your pitch with our creative Target Marketing Techniques Evaluating Growth Rate For Target Marketing Slides PDF. Deliver an awe inspiring pitch that will mesmerize everyone. Using these presentation templates you will surely catch everyones attention. You can browse the ppts collection on our website. We have researchers who are experts at creating the right content for the templates. So you do not have to invest time in any additional work. Just grab the template now and use them.
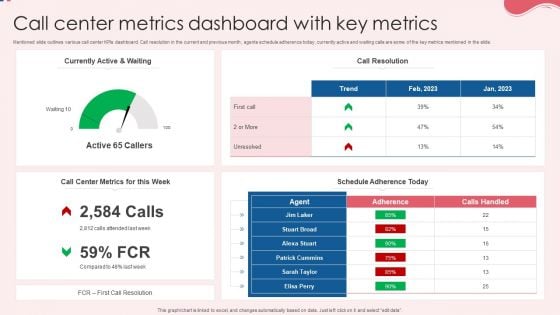
Call Center Metrics Dashboard With Key Metrics Information PDF
Mentioned slide outlines various call center KPIs dashboard. Call resolution in the current and previous month, agents schedule adherence today, currently active and waiting calls are some of the key metrics mentioned in the slide. Showcasing this set of slides titled Call Center Metrics Dashboard With Key Metrics Information PDF. The topics addressed in these templates are Currently Active, Call Resolution, Key Metrics. All the content presented in this PPT design is completely editable. Download it and make adjustments in color, background, font etc. as per your unique business setting.
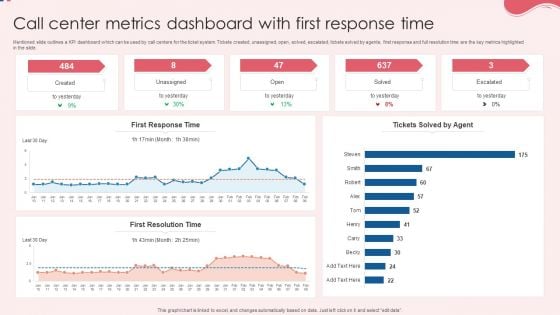
Call Center Metrics Dashboard With First Response Time Background PDF
Mentioned slide outlines a KPI dashboard which can be used by call centers for the ticket system. Tickets created, unassigned, open, solved, escalated, tickets solved by agents, first response and full resolution time are the key metrics highlighted in the slide. Pitch your topic with ease and precision using this Call Center Metrics Dashboard With First Response Time Background PDF. This layout presents information on First Response Time, First Resolution Time, Response Time. It is also available for immediate download and adjustment. So, changes can be made in the color, design, graphics or any other component to create a unique layout.
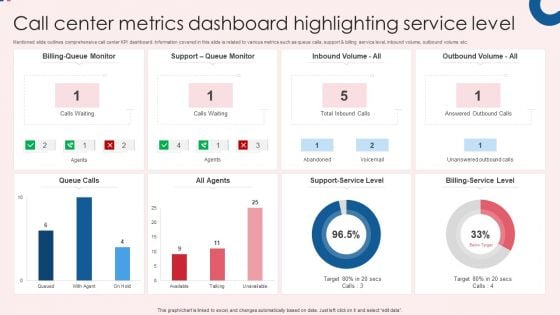
Call Center Metrics Dashboard Highlighting Service Level Infographics PDF
Mentioned slide outlines comprehensive call center KPI dashboard. Information covered in this slide is related to various metrics such as queue calls, support and billing service level, inbound volume, outbound volume etc. Pitch your topic with ease and precision using this Call Center Metrics Dashboard Highlighting Service Level Infographics PDF. This layout presents information on All Agents, Queue Calls, Billing Service Level. It is also available for immediate download and adjustment. So, changes can be made in the color, design, graphics or any other component to create a unique layout.
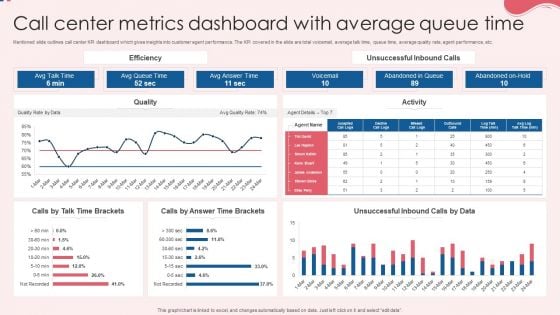
Call Center Metrics Dashboard With Average Queue Time Topics PDF
Mentioned slide outlines call center KPI dashboard which gives insights into customer agent performance. The KPI covered in the slide are total voicemail, average talk time, queue time, average quality rate, agent performance, etc. Pitch your topic with ease and precision using this Call Center Metrics Dashboard With Average Queue Time Topics PDF. This layout presents information on Efficiency, Quality, Activity. It is also available for immediate download and adjustment. So, changes can be made in the color, design, graphics or any other component to create a unique layout.
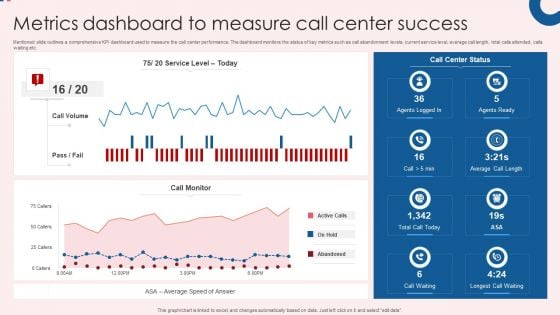
Metrics Dashboard To Measure Call Center Success Themes PDF
Mentioned slide outlines a comprehensive KPI dashboard used to measure the call center performance. The dashboard monitors the status of key metrics such as call abandonment levels, current service level, average call length, total calls attended, calls waiting etc. Showcasing this set of slides titled Metrics Dashboard To Measure Call Center Success Themes PDF. The topics addressed in these templates are Center Success, Call Center Status, Call Monitor. All the content presented in this PPT design is completely editable. Download it and make adjustments in color, background, font etc. as per your unique business setting.
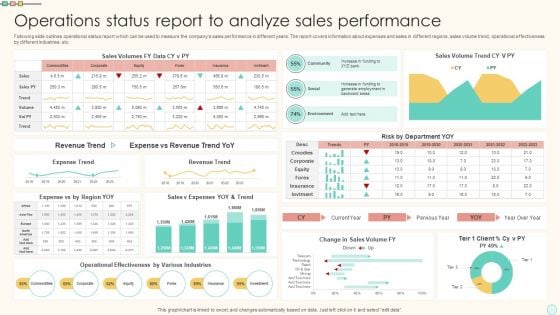
Operations Status Report To Analyze Sales Performance Portrait PDF
Following slide outlines operational status report which can be used to measure the companys sales performance in different years. The report covers information about expenses and sales in different regions, sales volume trend, operational effectiveness by different industries, etc. Showcasing this set of slides titled Operations Status Report To Analyze Sales Performance Portrait PDF. The topics addressed in these templates are Operations Status Report, Analyze Sales Performance. All the content presented in this PPT design is completely editable. Download it and make adjustments in color, background, font etc. as per your unique business setting.
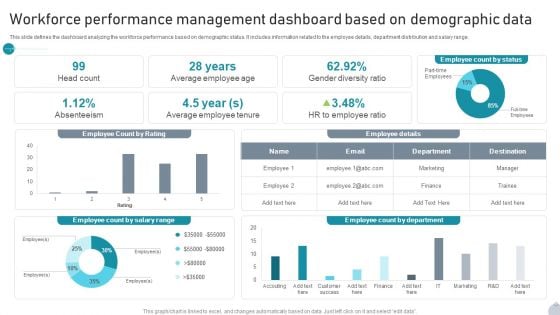
Workforce Performance Management Dashboard Based On Demographic Data Information PDF
This slide defines the dashboard analyzing the workforce performance based on demographic status. It includes information related to the employee details, department distribution and salary range. Showcasing this set of slides titled Workforce Performance Management Dashboard Based On Demographic Data Information PDF. The topics addressed in these templates are Employee Details, Department, Gender Diversity Ratio All the content presented in this PPT design is completely editable. Download it and make adjustments in color, background, font etc. as per your unique business setting.
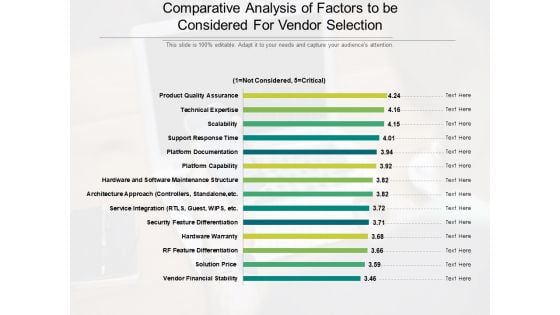
Comparitive Analysis Of Factors To Be Considered For Vendor Selection Ppt PowerPoint Presentation Portfolio Grid PDF
Presenting this set of slides with name comparitive analysis of factors to be considered for vendor selection ppt powerpoint presentation portfolio grid pdf. The topics discussed in these slides are product quality assurance, technical expertise, scalability, support response timen. This is a completely editable PowerPoint presentation and is available for immediate download. Download now and impress your audience.
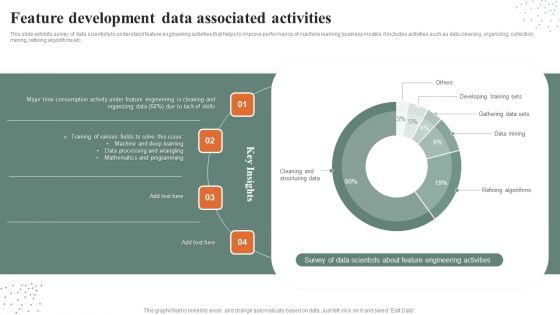
Feature Development Data Associated Activities Guidelines PDF
This slide exhibits survey of data scientists to understand feature engineering activities that helps to improve performance of machine learning business models. It includes activities such as data cleaning, organizing, collection, mining, refining algorithms etc. Pitch your topic with ease and precision using this Feature Development Data Associated Activities Guidelines PDF. This layout presents information on Programming, Developing Training Sets, Gathering Data Sets. It is also available for immediate download and adjustment. So, changes can be made in the color, design, graphics or any other component to create a unique layout.
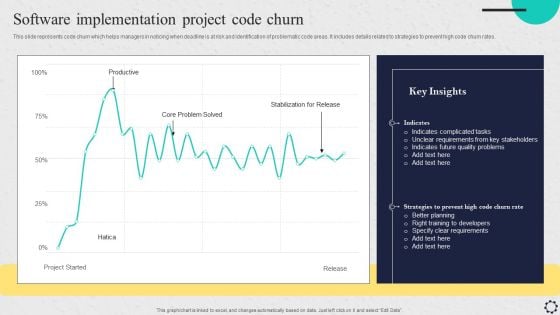
Software Implementation Project Code Churn Introduction PDF
This slide represents code churn which helps managers in noticing when deadline is at risk and identification of problematic code areas. It includes details related to strategies to prevent high code churn rates. This Software Implementation Project Code Churn Introduction PDF from Slidegeeks makes it easy to present information on your topic with precision. It provides customization options, so you can make changes to the colors, design, graphics, or any other component to create a unique layout. It is also available for immediate download, so you can begin using it right away. Slidegeeks has done good research to ensure that you have everything you need to make your presentation stand out. Make a name out there for a brilliant performance.
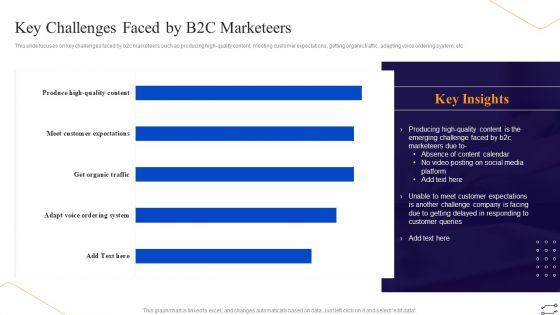
Online Marketing Tactics To Enhance Sales Key Challenges Faced By B2C Marketeers Inspiration PDF
This slide focuses on key challenges faced by b2c marketeers such as producing high-quality content, meeting customer expectations, getting organic traffic, adapting voice ordering system, etc. Deliver an awe inspiring pitch with this creative Online Marketing Tactics To Enhance Sales Key Challenges Faced By B2C Marketeers Inspiration PDF bundle. Topics like Adapt Voice, Ordering System, Get Organic Traffic, Meet Customer Expectations can be discussed with this completely editable template. It is available for immediate download depending on the needs and requirements of the user.
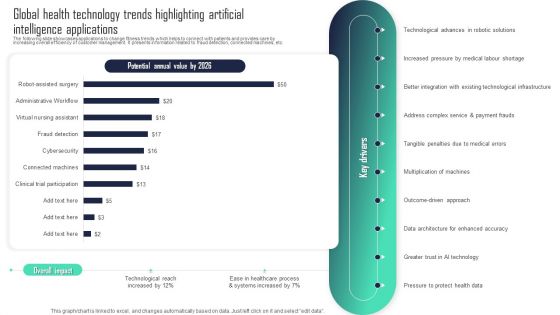
Global Health Technology Trends Highlighting Artificial Intelligence Applications Formats PDF
The following slide showcases applications to change fitness trends which helps to connect with patients and provides care by increasing overall efficiency of customer management. It presents information related to fraud detection, connected machines, etc. Pitch your topic with ease and precision using this Global Health Technology Trends Highlighting Artificial Intelligence Applications Formats PDF. This layout presents information on Key Drivers, Solutions, Enhanced Accuracy. It is also available for immediate download and adjustment. So, changes can be made in the color, design, graphics or any other component to create a unique layout.
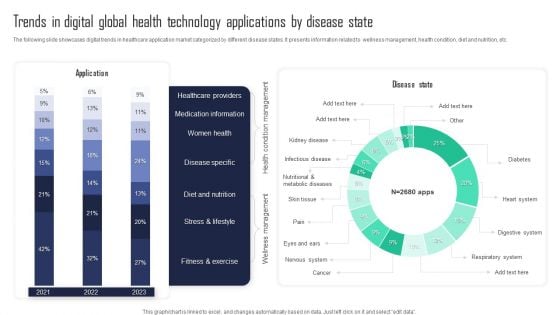
Trends In Digital Global Health Technology Applications By Disease State Pictures PDF
The following slide showcases digital trends in healthcare application market categorized by different disease states. It presents information related to wellness management, health condition, diet and nutrition, etc. Showcasing this set of slides titled Trends In Digital Global Health Technology Applications By Disease State Pictures PDF. The topics addressed in these templates are Healthcare Providers, Medication Information, Women Health. All the content presented in this PPT design is completely editable. Download it and make adjustments in color, background, font etc. as per your unique business setting.
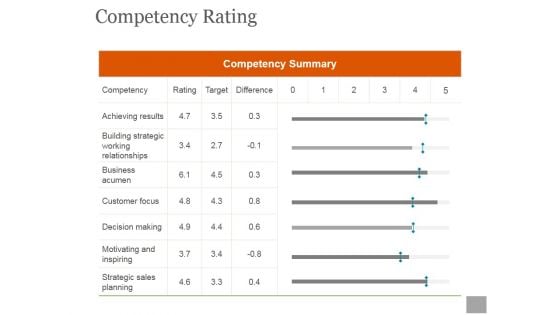
Competency Rating Ppt PowerPoint Presentation Designs
This is a competency rating ppt powerpoint presentation designs. This is a eight stage process. The stages in this process are managerial efficiency, resource planning, develop and implements, financial accounting, financial analysis.
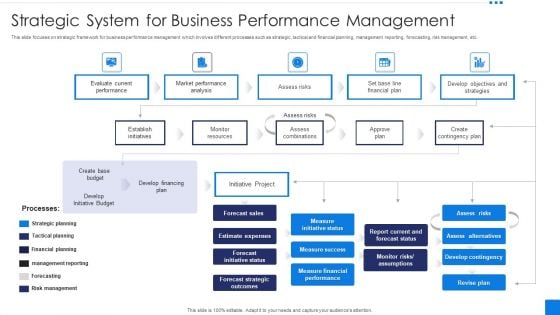
Strategic System For Business Performance Management Demonstration PDF
This slide focuses on strategic framework for business performance management which involves different processes such as strategic, tactical and financial planning, management reporting, forecasting, risk management, etc. Persuade your audience using this Strategic System For Business Performance Management Demonstration PDF. This PPT design covers five stages, thus making it a great tool to use. It also caters to a variety of topics including Initiative Project, Evaluate Current Performance, Assess Risks. Download this PPT design now to present a convincing pitch that not only emphasizes the topic but also showcases your presentation skills.

Bar Graph Ppt PowerPoint Presentation Visual Aids Styles
This is a bar graph ppt powerpoint presentation visual aids styles. This is a five stage process. The stages in this process are finance, analysis, planning, business, process.
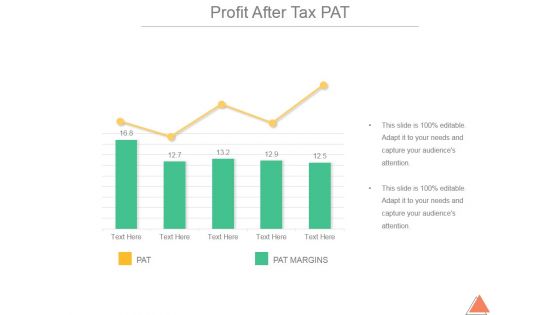
Profit After Tax Pat Ppt PowerPoint Presentation Show
This is a profit after tax pat ppt powerpoint presentation show. This is a two stage process. The stages in this process are business, marketing, management, finance, strategy.
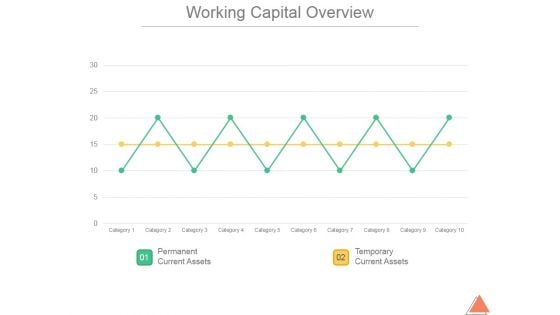
Working Capital Overview Ppt PowerPoint Presentation Inspiration
This is a working capital overview ppt powerpoint presentation inspiration. This is a two stage process. The stages in this process are permanent current assets, temporary current assets.
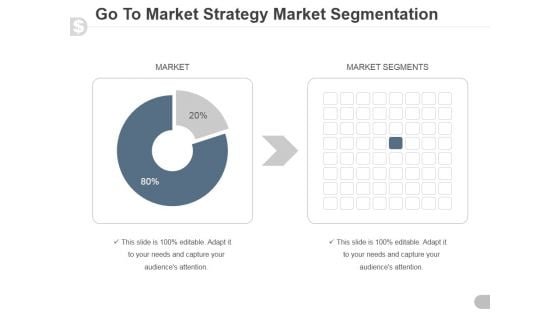
Go To Market Strategy Market Segmentation Ppt PowerPoint Presentation Guidelines
This is a go to market strategy market segmentation ppt powerpoint presentation guidelines. This is a two stage process. The stages in this process are market, market segments.


 Continue with Email

 Home
Home


