Financial Planning
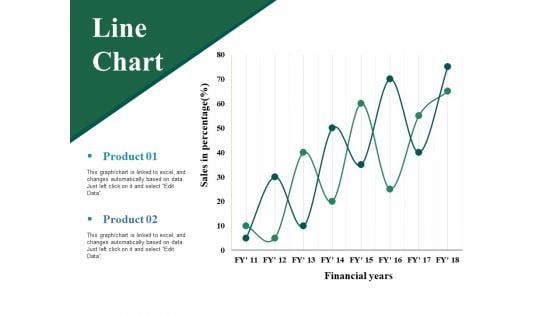
Line Chart Ppt PowerPoint Presentation Professional Grid
This is a line chart ppt powerpoint presentation professional grid. This is a two stage process. The stages in this process are sales in percentage, financial years, product, line chart.
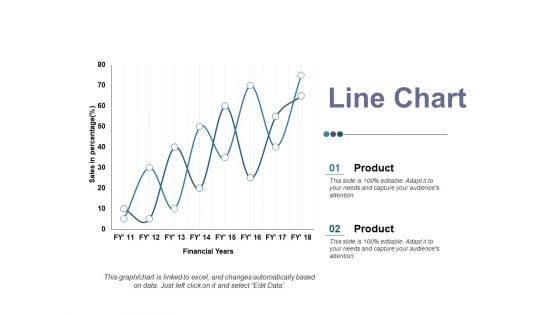
Line Chart Ppt PowerPoint Presentation Ideas Elements
This is a line chart ppt powerpoint presentation ideas elements. This is a two stage process. The stages in this process are product, sales in percentage, financial year, business, line chart.
Area Chart Ppt PowerPoint Presentation Icon Summary
This is a area chart ppt powerpoint presentation icon summary. This is a two stage process. The stages in this process are financial year, area chart, in percentage, product.
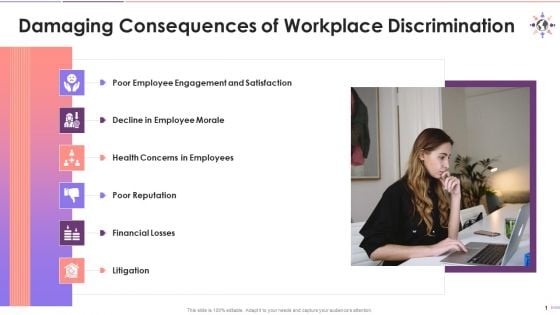
Adverse Consequences Of Workplace Discrimination Training Ppt
This slide lists six major damaging consequences of workplace discrimination. These are poor employee engagement and satisfaction decline in morale health concerns in employees companys poor reputation financial loss, and litigation.
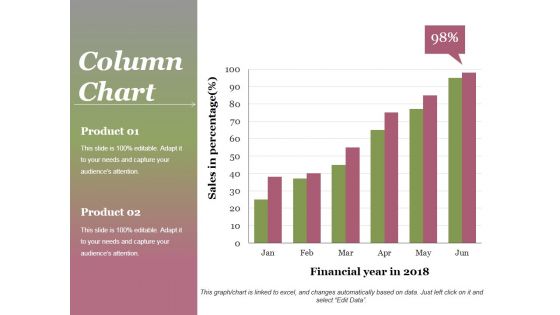
Column Chart Ppt PowerPoint Presentation Gallery Background
This is a column chart ppt powerpoint presentation gallery background. This is a two stage process. The stages in this process are product, sales in percentage, financial year, graph, success.
Bar Chart Ppt PowerPoint Presentation Icon Information
This is a bar chart ppt powerpoint presentation icon information. This is a one stage process. The stages in this process are product, sales in percentage, financial years, bar graph, growth.
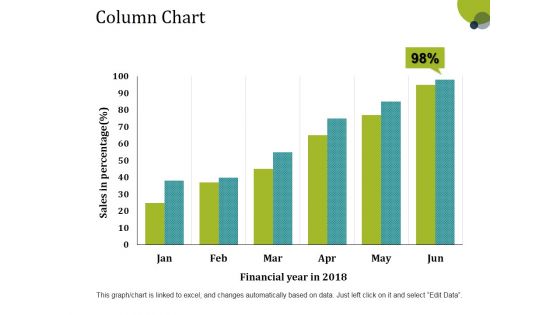
Column Chart Ppt PowerPoint Presentation Layouts Tips
This is a column chart ppt powerpoint presentation layouts tips. This is a six stage process. The stages in this process are sales in percentage, financial year, bar graph, growth, success.
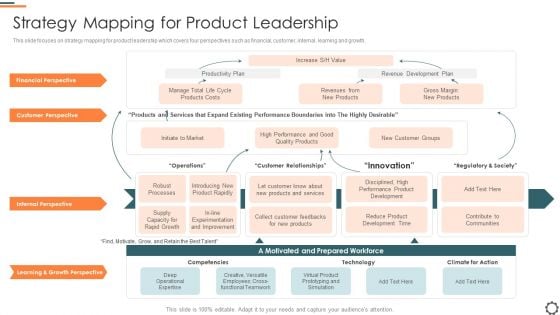
Agile Group For Product Development Strategy Mapping For Product Leadership Formats PDF
This slide focuses on strategy mapping for product leadership which covers four perspectives such as financial, customer, internal, learning and growth. Deliver an awe inspiring pitch with this creative agile group for product development strategy mapping for product leadership formats pdf bundle. Topics like financial perspective, customer perspective, learning and growth perspective can be discussed with this completely editable template. It is available for immediate download depending on the needs and requirements of the user.
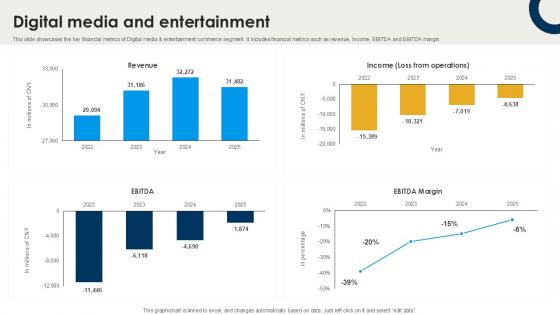
Digital Media And Entertainment International Trade Of Products And Services PPT Example CP SS V
This slide showcases the key financial metrics of Digital media and entertainment commerce segment. It includes financial metrics such as revenue, Income, EBITDA and EBITDA margin. Whether you have daily or monthly meetings, a brilliant presentation is necessary. Digital Media And Entertainment International Trade Of Products And Services PPT Example CP SS V can be your best option for delivering a presentation. Represent everything in detail using Digital Media And Entertainment International Trade Of Products And Services PPT Example CP SS V and make yourself stand out in meetings. The template is versatile and follows a structure that will cater to your requirements. All the templates prepared by Slidegeeks are easy to download and edit. Our research experts have taken care of the corporate themes as well. So, give it a try and see the results. This slide showcases the key financial metrics of Digital media and entertainment commerce segment. It includes financial metrics such as revenue, Income, EBITDA and EBITDA margin.
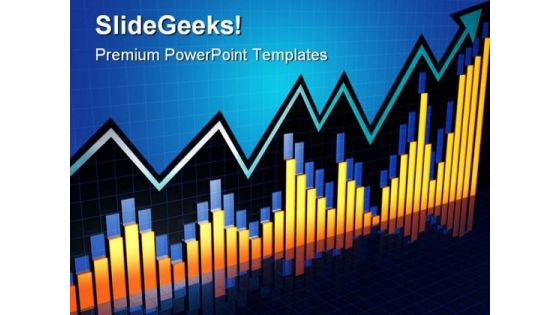
Chart Growth Business PowerPoint Template 0910
Arrow pointing to the higher financial chart bar 3d illustration Enter onto your new path with our Chart Growth Business PowerPoint Template 0910. Your thoughts will make a solid beginning.
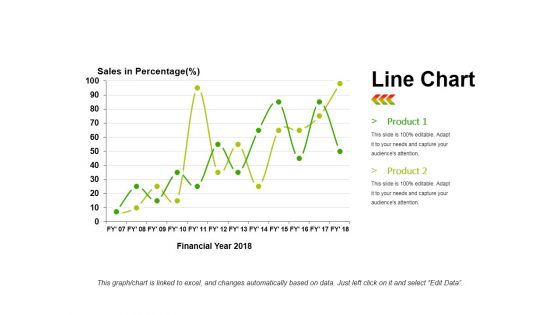
Line Chart Ppt PowerPoint Presentation Infographics Infographics
This is a line chart ppt powerpoint presentation infographics infographics. This is a two stage process. The stages in this process are product, sales in percentage, financial year, line chart, finance.
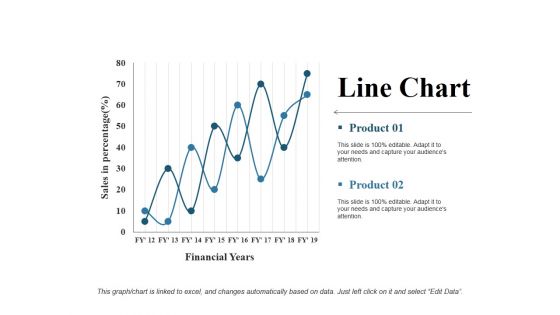
Line Chart Ppt PowerPoint Presentation Gallery Rules
This is a line chart ppt powerpoint presentation gallery rules. This is a two stage process. The stages in this process are financial years, product, sales in percentage, line chart, growth.
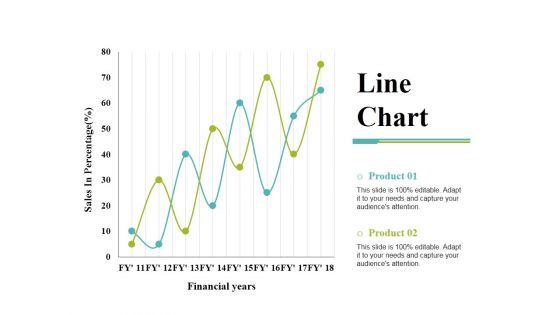
Line Chart Ppt PowerPoint Presentation Gallery Templates
This is a line chart ppt powerpoint presentation gallery templates. This is a two stage process. The stages in this process are product, financial years, sales in percentage, line chart.
Area Chart Ppt PowerPoint Presentation Icon Show
This is a area chart ppt powerpoint presentation icon show. This is a two stage process. The stages in this process are product, financial year, in percentage, area chart.
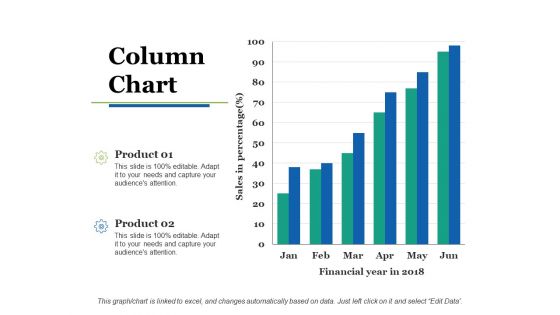
Column Chart Ppt PowerPoint Presentation Slides Show
This is a column chart ppt powerpoint presentation slides show. This is a two stage process. The stages in this process are column chart, product, sales in percentage, financial year, growth.
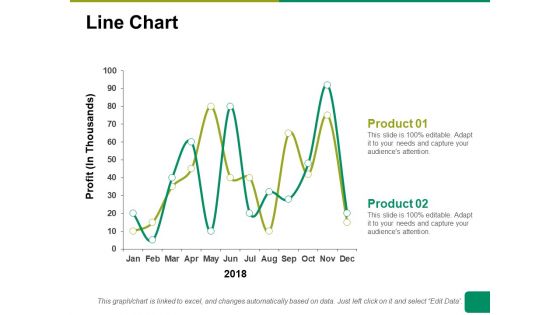
Line Chart Ppt PowerPoint Presentation Summary Ideas
This is a line chart ppt powerpoint presentation summary ideas. This is a two stage process. The stages in this process are line chart, profit, product, financial years, business.
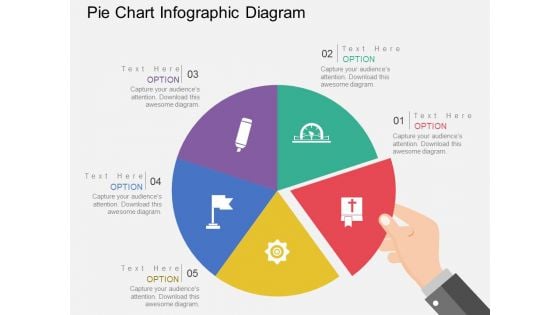
Pie Chart Infographic Diagram Powerpoint Templates
This Power Point template has been designed with pie chart infographic. This business slide is useful to present financial ratio analysis. Use this diagram to make business presentation. Illustrate these thoughts with this slide.
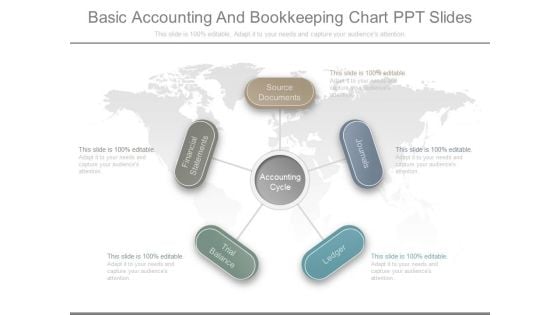
Basic Accounting And Bookkeeping Chart Ppt Slides
This is a basic accounting and bookkeeping chart ppt slides. This is a five stage process. The stages in this process are financial statements, source documents, accounting cycle, journals, ledger, trial balance.
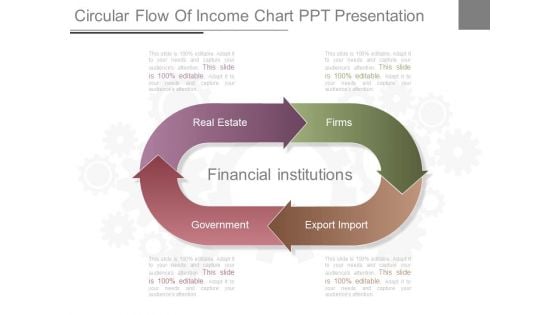
Circular Flow Of Income Chart Ppt Presentation
This is a circular flow of income chart ppt presentation. This is a four stage process. The stages in this process are real estate, government, financial institutions, export import, firms.
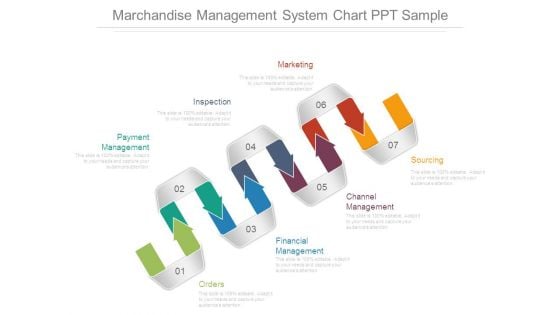
Marchandise Management System Chart Ppt Sample
This is a marchandise management system chart ppt sample. This is a seven stage process. The stages in this process are payment management, inspection, marketing, sourcing, channel management, financial management, orders.
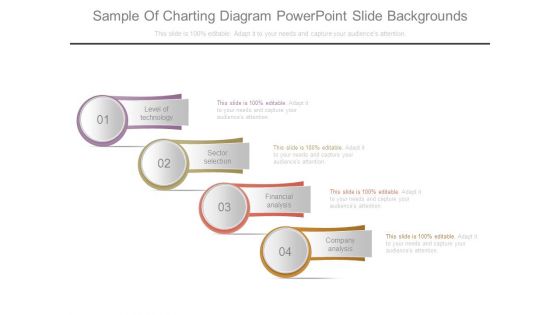
Sample Of Charting Diagram Powerpoint Slide Backgrounds
This is a sample of charting diagram powerpoint slide backgrounds. This is a four stage process. The stages in this process are level of technology, sector selection, financial analysis, company analysis.
Area Chart Ppt PowerPoint Presentation Gallery Icons
This is a area chart ppt powerpoint presentation gallery icons. This is a two stage process. The stages in this process are financial year, sales in percentage, product, finance, graph.
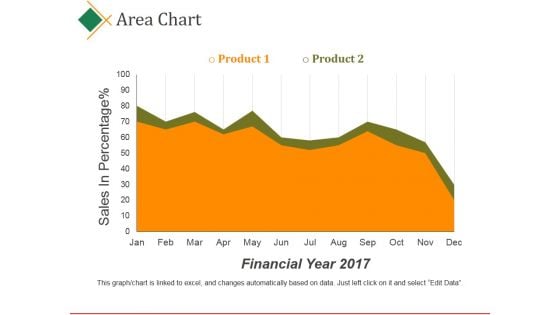
Area Chart Ppt PowerPoint Presentation Pictures Files
This is a area chart ppt powerpoint presentation pictures files. This is a two stage process. The stages in this process are product, sales, in percentage, financial year, business.
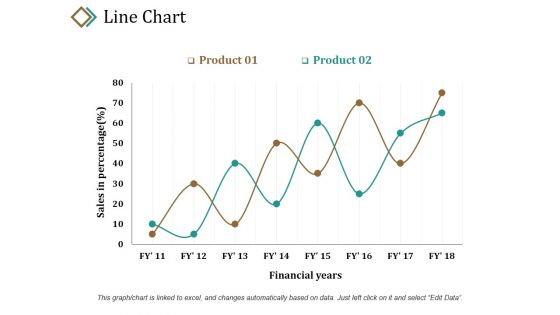
Line Chart Ppt PowerPoint Presentation Layouts Example
This is a line chart ppt powerpoint presentation layouts example. This is a two stage process. The stages in this process are sales in percentage, product, financial years, growth, success.

Line Chart Ppt PowerPoint Presentation Show Guide
This is a line chart ppt powerpoint presentation show guide. This is a two stage process. The stages in this process are product, sales in percentage, financial years, growth, success.

Business Network Growth Finance PowerPoint Templates And PowerPoint Backgrounds 0411
Microsoft PowerPoint Template and Background with business financial growth and network concept Map out your strategy with our Business Network Growth Finance PowerPoint Templates And PowerPoint Backgrounds 0411. Download without worries with our money back guaranteee.
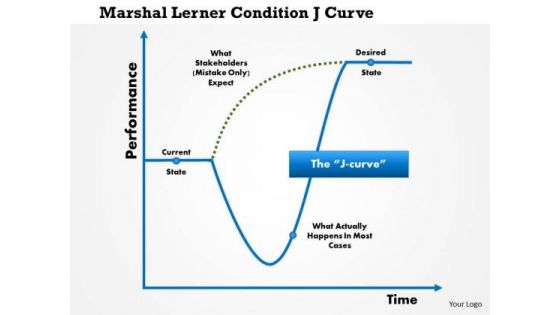
Business Framework Marshall Lerner Condition Ju Curve PowerPoint Presentation
Explain the Marshall Lerner condition and J-curve with suitable graphics. This business framework has been crafted with j-curve graphics. Use this PPT in your financial presentation to explain the depreciation and devaluation of currency for any country.
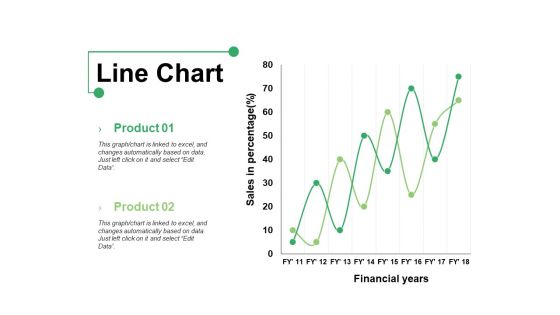
Line Chart Ppt PowerPoint Presentation Show Graphics Example
This is a line chart ppt powerpoint presentation show graphics example. This is a two stage process. The stages in this process are product, line chart, financial years, sales in percentage.
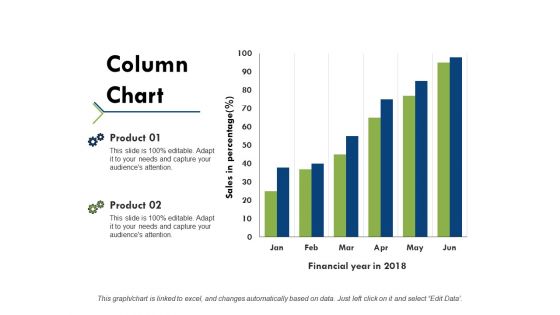
Column Chart Ppt PowerPoint Presentation Portfolio Example Topics
This is a column chart ppt powerpoint presentation portfolio example topics. This is a two stage process. The stages in this process are product, financial year, sales in percentage, column chart.
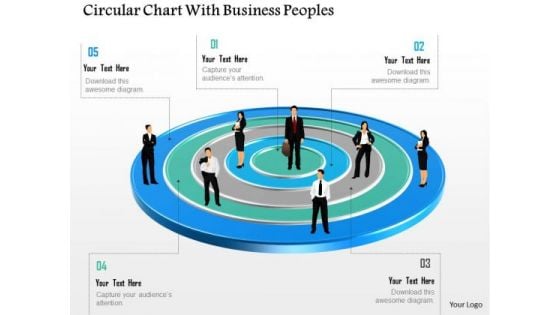
Business Diagram Circular Chart With Business Peoples Presentation Template
This business diagram has been designed with graphic of business people on circular chart. This diagram is designed to depict team meeting on financial matter. This diagram offers a way for your audience to visually conceptualize the process.

Exit Strategy For The Investors Ppt Visual Aids Model PDF
This slide Provides the Exit Strategy which includes Acquisition, Financial Buyer and Liquidation.Presenting exit strategy for the investors ppt visual aids model pdf. to provide visual cues and insights. Share and navigate important information on three stages that need your due attention. This template can be used to pitch topics like acquisition, financial buyer, liquidation. In addtion, this PPT design contains high resolution images, graphics, etc, that are easily editable and available for immediate download.
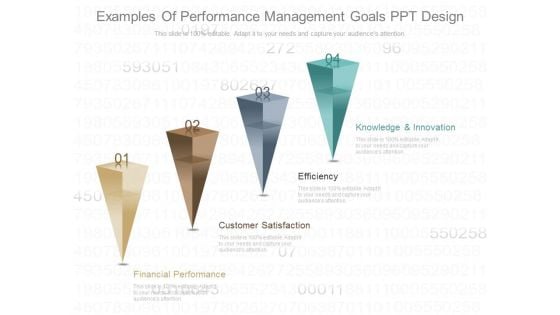
Examples Of Performance Management Goals Ppt Design
This is an examples of performance management goals ppt design. This is a four stage process. The stages in this process are financial performance, customer satisfaction, efficiency, knowledge and innovation.

Line Chart Ppt PowerPoint Presentation Infographics Graphic Images
This is a line chart ppt powerpoint presentation infographics graphic images. This is a two stage process. The stages in this process are sales in percentage, financial years, growth, business, marketing.
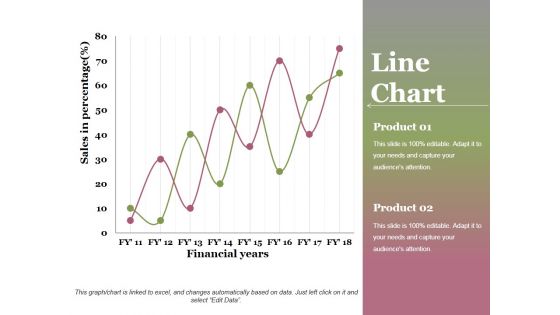
Line Chart Ppt PowerPoint Presentation Professional Graphics Design
This is a line chart ppt powerpoint presentation professional graphics design. This is a two stage process. The stages in this process are financial years, sales in percentage, product, growth, success.
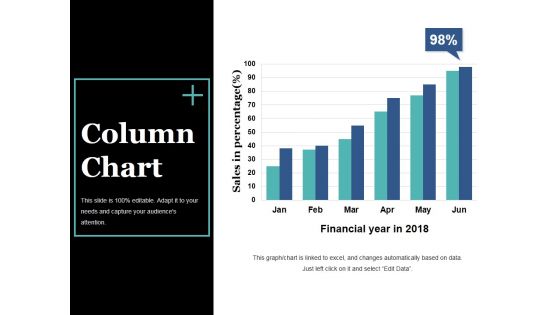
Column Chart Ppt PowerPoint Presentation Slides Visual Aids
This is a column chart ppt powerpoint presentation slides visual aids. This is a six stage process. The stages in this process are bar graph, growth, success, sales in percentage, financial year.
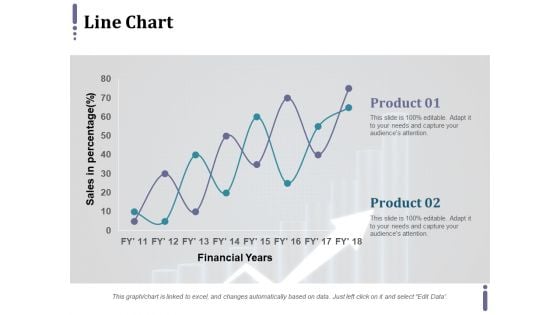
Line Chart Ppt PowerPoint Presentation Infographic Template Master Slide
This is a line chart ppt powerpoint presentation infographic template master slide. This is a two stage process. The stages in this process are product, financial years, sales in percentage.
Business Chart Showing Finance PowerPoint Templates And PowerPoint Backgrounds 0411
Microsoft PowerPoint Template and Background with business chart showing financial success objects Deliver your ideas decisively with our Business Chart Showing Finance PowerPoint Templates And PowerPoint Backgrounds 0411. They help you look the audience in the eye.
Pie Chart Finance PowerPoint Templates And PowerPoint Backgrounds 0511
Microsoft PowerPoint Template and Background with pie chart with financial success concept The audience will be happy to pay any fee. They will be all agog to see our Pie Chart Finance PowerPoint Templates And PowerPoint Backgrounds 0511.

Pie Chart02 Business PowerPoint Templates And PowerPoint Backgrounds 0611
Microsoft PowerPoint Template and Background with pie chart business concept financial management Cast our Pie Chart02 Business PowerPoint Templates And PowerPoint Backgrounds 0611 in your act. The audience will call for an encore.

Persons On Chart Success PowerPoint Templates And PowerPoint Backgrounds 0711
Microsoft PowerPoint Template and Background with pie chart with people financial Our Persons On Chart Success PowerPoint Templates And PowerPoint Backgrounds 0711 are extremely compatible. Your thoughts will find them absolutely amenable.
Business Chart Showing Finance PowerPoint Themes And PowerPoint Slides 0411
Microsoft PowerPoint Theme and Slide with business chart showing financial success objects Take care of your organizationwith our Business Chart Showing Finance PowerPoint Themes And PowerPoint Slides 0411. You'll deliver your best presentation yet.
Pie Chart Finance PowerPoint Themes And PowerPoint Slides 0511
Microsoft PowerPoint Slide and Theme with pie chart with financial success concept Our Pie Chart Finance PowerPoint Themes And PowerPoint Slides 0511 ensure a creditable performance. You will certainly recieve more than due applause.
Business Chart Showing Finance PowerPoint Presentation Slides C
Microsoft Powerpoint Slides and Backgrounds with business chart showing financial success. objects on a white Your customer is the center of it all. Our Business Chart Showing Finance PowerPoint Presentation Slides C will concentrate on him.
Business Chart Showing Finance PowerPoint Presentation Slides Cc
Microsoft Powerpoint Slides and Backgrounds with business chart showing financial success. objects on a white Get rid of all fetters with our Business Chart Showing Finance PowerPoint Presentation Slides Cc. Clear all the blockades with your ideas.
Business Chart Showing Finance PowerPoint Presentation Slides F
Microsoft Powerpoint Slides and Backgrounds with business chart showing financial success. objects on a white Add to your exhibition with our Business Chart Showing Finance PowerPoint Presentation Slides F. Your audience will find it cool.
Business Chart Showing Finance PowerPoint Presentation Slides R
Microsoft Powerpoint Slides and Backgrounds with business chart showing financial success. objects on a white Put your team out to field with our Business Chart Showing Finance PowerPoint Presentation Slides R. They will catch everything you throw at them.

Business Chart Showing Finance PowerPoint Presentation Slides S
Microsoft Powerpoint Slides and Backgrounds with business chart showing financial success. objects on a white Our Business Chart Showing Finance PowerPoint Presentation Slides S don't fiddle with facts. They are fearlessly factual.

Growth Chart Success Business PowerPoint Templates And PowerPoint Backgrounds 0611
Microsoft PowerPoint Template and Background with financial growth red arrow rising Calculate your growing success with our Growth Chart Success Business PowerPoint Templates And PowerPoint Backgrounds 0611. You will come out on top.
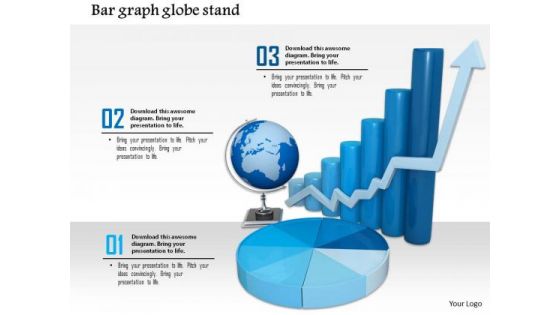
Stock Photo Graphics For Business Reports And Charts PowerPoint Slide
This image contains graphics of business reports and charts. Download this image for business and sales presentations where you have to focus on financial growth. Dazzle the audience with your thoughts.
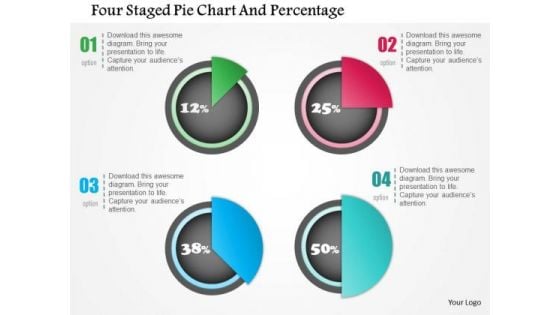
Business Diagram Four Staged Pie Chart And Percentage Presentation Template
Four staged pie chart and percentage values has been used to design this power point template. This PPT contains the concept of financial result analysis. Use this PPT for business and marketing related presentations.
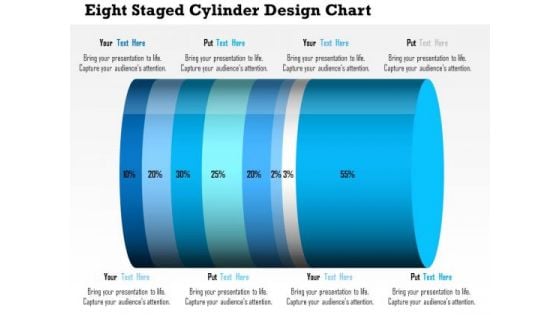
Business Daigram Eight Staged Cylinder Design Chart Presentation Templets
This business diagram contains eight staged cylinder design chart with percentage ratio. Download this diagram to display financial analysis. Use this diagram to make business and marketing related presentations.
Pie Chart With Seven Business Icons Powerpoint Templates
Our compelling template consists with a design of pie chart with seven business icons. This slide has been professionally designed to exhibit financial ratio analysis. This template offers an excellent background to build impressive presentation.
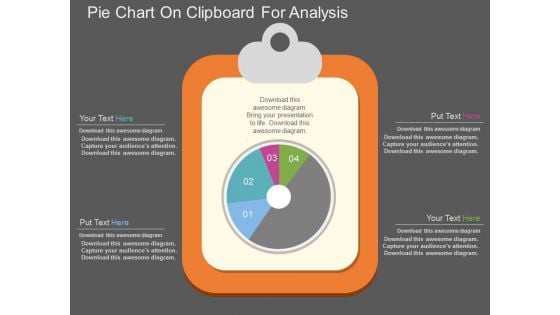
Pie Chart On Clipboard For Analysis Powerpoint Template
This PowerPoint template has been designed with graphics of pie chart on clipboard. Download this PPT slide for business and financial analysis. You may also use this professional template to depict statistical analysis.
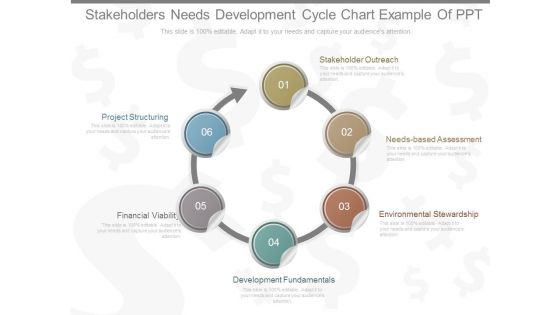
Stakeholders Needs Development Cycle Chart Example Of Ppt
This is a stakeholders needs development cycle chart example of ppt. This is a six stage process. The stages in this process are stakeholder outreach, needs based assessment, environmental stewardship,, development fundamentals, financial viability, project structuring.
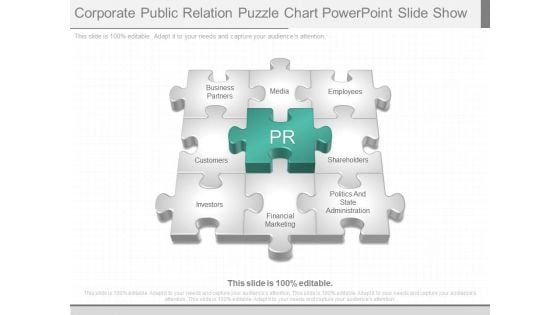
Corporate Public Relation Puzzle Chart Powerpoint Slide Show
This is a corporate public relation puzzle chart powerpoint slide show. This is a nine stage process. The stages in this process are business partners, media, employees, customers, shareholders, investors, financial marketing, politics and state administration, pr.
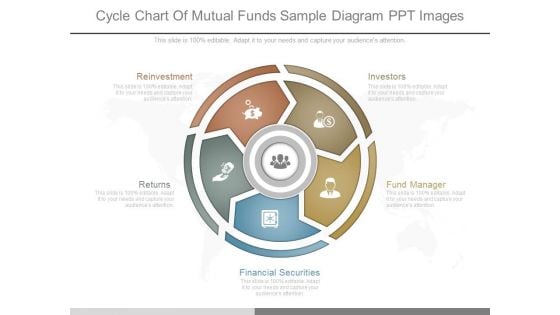
Cycle Chart Of Mutual Funds Sample Diagram Ppt Images
This is a cycle chart of mutual funds sample diagram ppt images. This is a five stage process. The stages in this process are reinvestment, returns, investors, fund manager, financial securities.
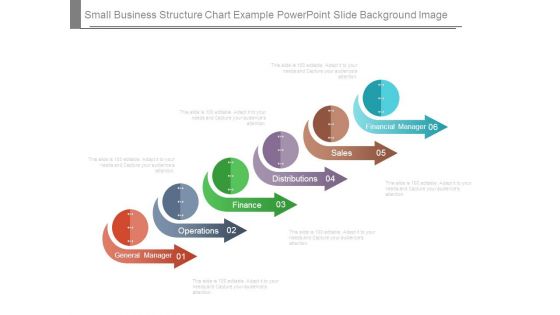
Small Business Structure Chart Example Powerpoint Slide Background Image
This is a small business structure chart example powerpoint slide background image. This is a six stage process. The stages in this process are financial manager, sales, distributions, finance, operations, general manager.
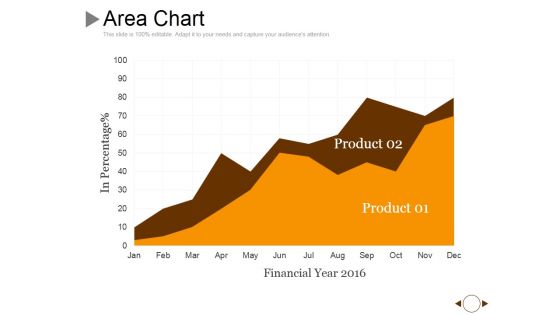
Area Chart Ppt PowerPoint Presentation Show Layout Ideas
This is a area chart ppt powerpoint presentation show layout ideas. This is a two stage process. The stages in this process are product, in percentage, financial year, growth.
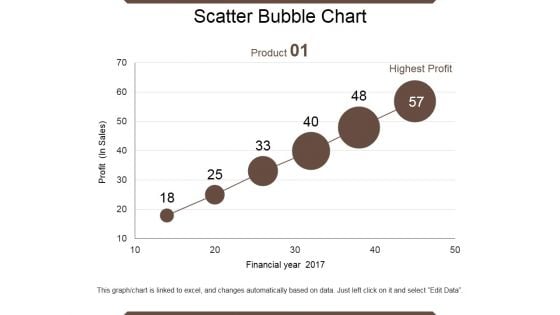
Scatter Bubble Chart Ppt PowerPoint Presentation Summary Files
This is a scatter bubble chart ppt powerpoint presentation summary files. This is a six stage process. The stages in this process are product, financial year, profit, highest profit.
Scatter Bubble Chart Ppt PowerPoint Presentation Icon Elements
This is a scatter bubble chart ppt powerpoint presentation icon elements. This is a six stage process. The stages in this process are highest profit, profit, financial year, product.


 Continue with Email

 Home
Home


